. 2022 Mar 15;3(3):100559.
doi: 10.1016/j.xcrm.2022.100559.

T cell-attracting CCL18 chemokine is a dominant rejection signal during limb transplantation

Affiliations

T cell-attracting CCL18 chemokine is a dominant rejection signal during limb transplantation

Thiago J Borges et al. Cell Rep Med. .

Abstract

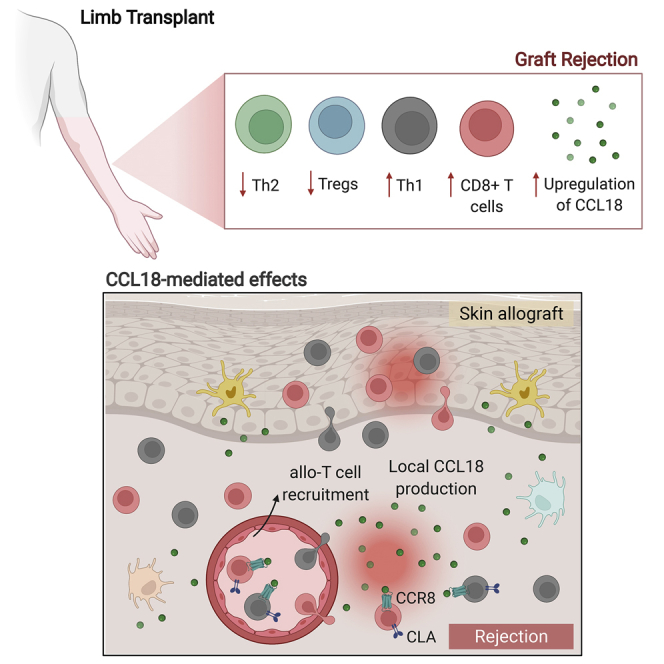
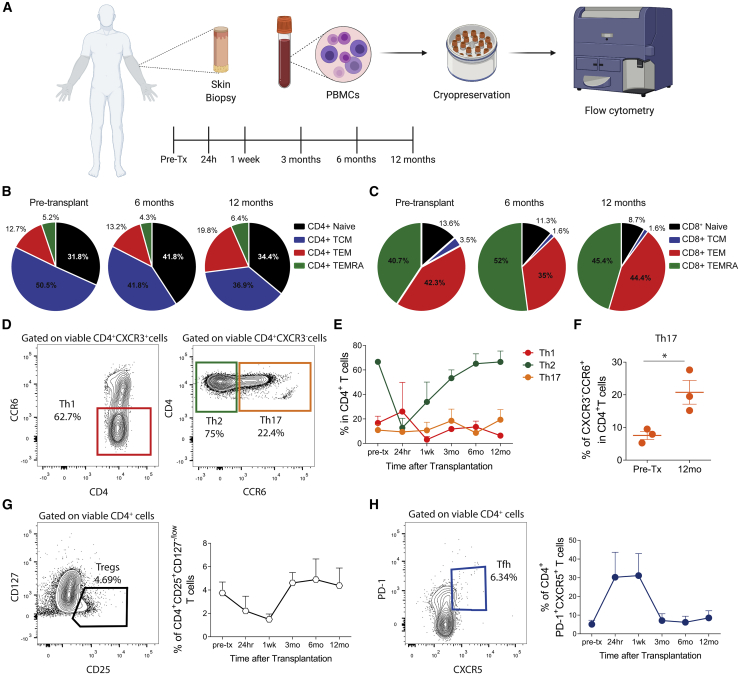
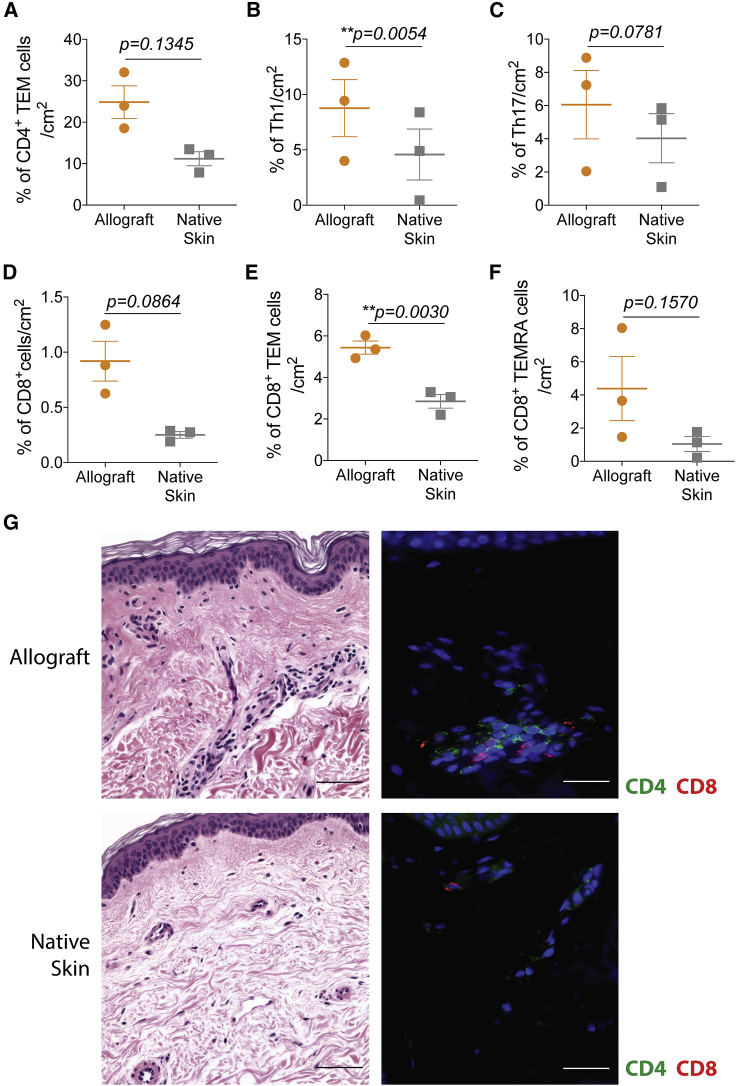
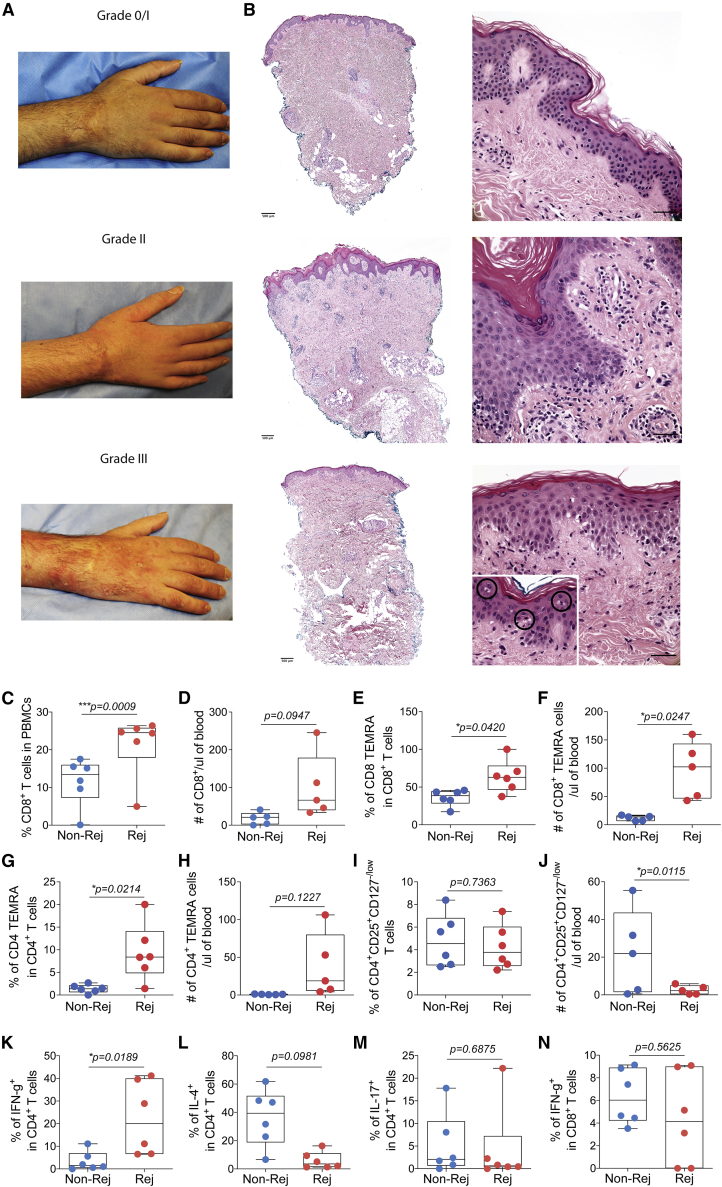
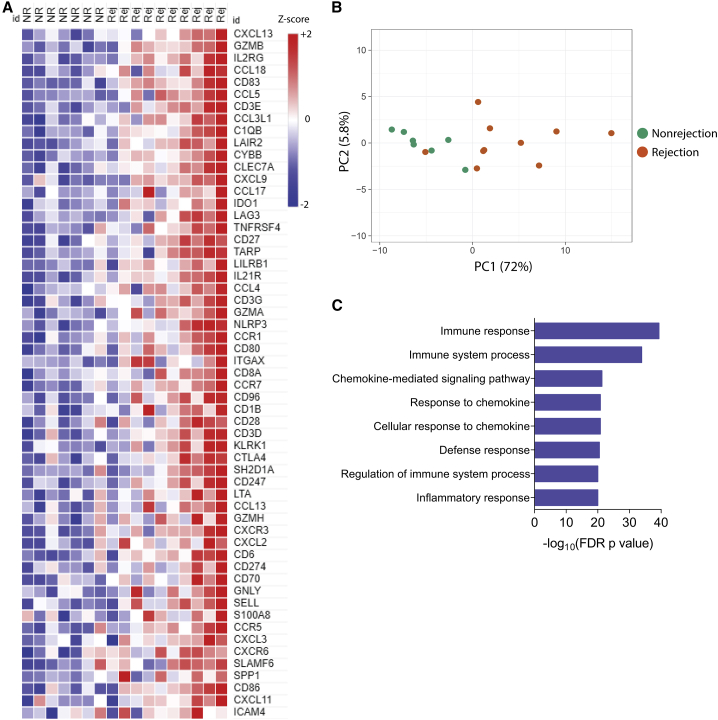
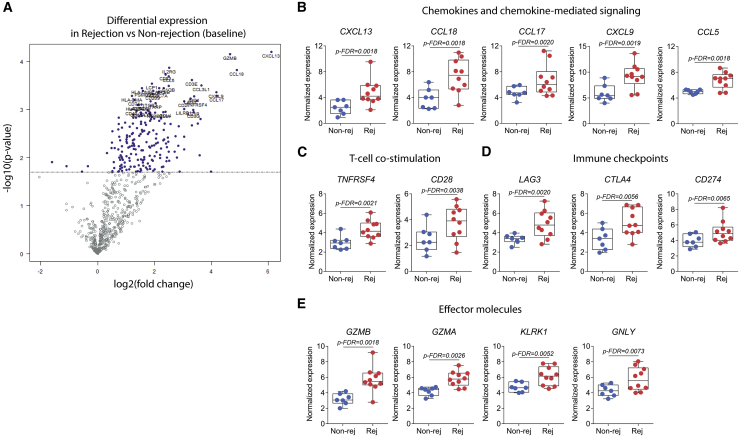
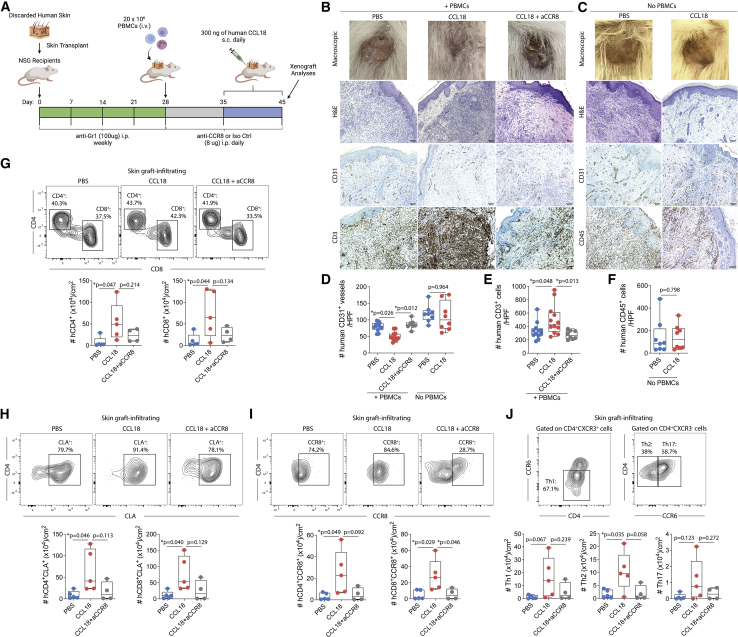
Limb transplantation is a life-changing procedure for amputees. However, limb recipients have a 6-fold greater rejection rate than solid organ transplant recipients, related in part to greater immunogenicity of the skin. Here, we report a detailed immunological and molecular characterization of individuals who underwent bilateral limb transplantation at our institution. Circulating Th17 cells are increased in limb transplant recipients over time. Molecular characterization of 770 genes in skin biopsies reveals upregulation of T cell effector immune molecules and chemokines, particularly CCL18. Skin antigen-presenting cells primarily express the chemokine CCL18, which binds to the CCR8 receptor. CCL18 treatment recruits more allo-T cells to the skin xenograft in a humanized skin transplantation model, leading to signs of accelerated graft rejection. Blockade of CCR8 remarkedly decreases CCL18-induced allo-T cell infiltration. Our results suggest that targeting the CCL18:CCR8 pathway could be a promising immunosuppressive approach in transplantation.

Trial registration: ClinicalTrials.gov NCT01293214.

Keywords: CCL18; CCR8; chemokines; extremity; limb transplantation; rejection; upper extremity transplantation; vascular composite allograft.


Conflict of interest statement

The authors declare no competing interests.

Figures

None
Graphical abstract
Figure 1
Figure 1
Analysis of circulating CD4+ and CD8+ T cell subsets from upper extremity recipients over time (A) Skin biopsies and peripheral blood were collected over time (pre-transplantation, 24 h, 1 week, and 3, 6, and 12 months after transplantation) from upper extremity transplant recipients. PBMCs were isolated for posterior flow cytometry analysis. The cartoon was created with BioRender. (B and C) Mean percentages of blood CD4+ (B) and CD8+ (C) naive cells (CCR7+CD45RA+), central memory T cells (TCM cells; CCR7+CD45RA), effector memory T cells (TEM cells; CCR7CD45RA), and effector memory RA cells (TEMRA cells; CCR7CD45RA+) before transplantation and 6 and 12 months after transplantation, represented as pie charts. Data are from all three individuals. (D) Representative contour plots of gating of T helper (Th) 1 (CD4+CXCR3+CCR6), Th2 (CD4+CXCR3CCR6), and Th17 (CD4+CXCR3CCR6+) cells. (E) Mean percentages of Th1, Th2, and Th17 cells from all three individuals over time. (F–H) Mean percentages of circulating Th17 cells before transplantation and 12 months after transplantation. Statistic by paired t test, ∗p < 0.05. (G and H) Representative contour plots and mean percentages of (G) regulatory T (Treg) cells (CD4+CD25+CD127−/low) and (H) T follicular helper (Tfh) cells (CD4+CXCR5+PD-1+) from all three individuals over time. Graphs are displayed as mean ± SD at each time point examined. See also Figure 1, Figure 2, Figure 3, Figure 4, Figure 5, Figure 6and S2.
Figure 2
Figure 2
Characterization of CD4+ and CD8+ T cell subsets from allografts and native skin of upper extremity recipients (A–F) Mean percentages per skin area of infiltrating (A) CD4+ TEM cells (CCR7CD45RA), (B) Th1 cells (CD4+CXCR3+CCR6), (C) Th17 cells (CD4+CXCR3CCR6+), (D) total CD8+ cells, (E) CD8+ TEM cells, and (F) CD8+ TEMRA cells (CCR7CD45RA+) from the allografts and adjacent native skins. Data are from all three individuals and represented as mean ± SD; statistics by paired t test. (G) Representative H&E staining (left) and immunofluorescence of CD4+ and CD8+ cells (right) from the allograft and adjacent native skin of the same upper extremity transplant recipient; 200× (scale bars, 100 μm). See also Figure S3.
Figure 3
Figure 3
Clinical and histopathological aspects in upper extremity allograft rejection with correlation to peripheral T cell populations (A and B) Clinical photographs of an upper extremity transplant recipient and (B) corresponding H&E graft staining during clinical cellular rejection episodes with graft erythema and edema (grades 2–3) compared with mild rejection on surveillance biopsy (grade 1) without significant erythema or edema. Grade 3 rejection retains lymphocytic vasculopathy (bottom right panel) but also shows epithelial apoptosis associated with lymphoid exocytosis (circled in higher magnification, 400×). Left images, 40×; right images, 400× (scale bars, 50 μm). (C–I) Percentages and (D, F, H, and J) absolute numbers of circulating total CD8+, CD8+ TEMRA, CD4+ TEMRA, and Treg cells at rejection (grades 2–3, n = 6) and nonrejection (grade 0, n = 6) events. Percentages of (K) IFN-γ+, (L) IL-4+, (M) IL-17+ CD4+ T cells, and (N) IFN-γ+ CD8+ T cells from peripheral blood at rejection and nonrejection time points. (C–N) Data are from all three individuals and represented as mean ± SD; statistics by paired t test. Rejection time points included samples from 1 week to 3 years after transplantation and nonrejection time points from 1 month to 4 years after transplantation.
Figure 4
Figure 4
Unique gene expression signature in human upper extremity transplant rejection is associated with chemokines-related genes (A) Heatmap of the 57 differentially expressed genes (DEGs) in rejection (grades 2–3, n = 10) compared with nonrejection (grades 0–1, n = 7) skin biopsies (log2 fold change of genes assessed were transformed into Z scores). (B) Unsupervised principal-component analysis of the top 57 DEGs, clustering the samples with rejection compared with nonrejection events, except by one resolving rejection. (C) Top 8 Gene Ontology (GO) biological process terms enriched among the 57 DEGs in rejection biopsies compared with nonrejection. Statistics used Fisher’s one-tailed test with Benjamini-Hochberg false discovery rate (FDR; p value) for multiple testing correction. For all analyses, rejection biopsies included samples from 1 month to 3 years after transplantation and nonrejection biopsies from 1 month to 4.5 years after transplantation.
Figure 5
Figure 5
Chemokine-mediated signaling, T cell effector molecules, and immune checkpoints are upregulated in the limb transplant skin microenvironment during rejection (A) Volcano plot showing DEGs in rejection in relation to nonrejection. Log2 fold change is represented on the x axis, and the y axis displays −log10 of each gene’s p value. (B–E) Normalized expression of genes associated with (B) chemokines and chemokine-mediated signaling, (C) T cell co-stimulation, (D) immune checkpoints, and (E) effector molecules. Boxplots represent mean values with whiskers of maximum and minimum values. Statistics are represented by FDR p values. For all analyses, rejection biopsies (n = 10; 1 month to 3 years after transplantation) and nonrejection biopsies (n = 7; 1 month to 4.5 years after transplantation).
Figure 6
Figure 6
CCL18 attracts human allo-T cells to human skin xenografts (A and B) Discarded human skin was transplanted into NSG recipient mice. Mice were injected weekly with anti-Gr1 to reduce local inflammation and establish an intact vasculature (A). Twenty-eight days after transplantation, recipients were injected with 20 × 106 allo-PBMCs. Seven days thereafter, 300 ng of CCL18 or PBS 1× was injected subcutaneously into the skin xenografts for 10 consecutive days. Recipient animals were treated with anti-CCR8 or isotype control daily. Skin xenografts and peripheral blood were analyzed by histology and flow cytometry on day 45 after transplantation. (B–D) Representative macroscopic images of skin xenografts, H&E graft staining, and immunohistochemical staining for human CD31, human CD3, or human CD45 after the CCL18 injections into animals (A) injected (B) or not injected (C) with human PBMCs. Shown are absolute counts of human CD31+ vessels. (E and F) Human CD3+ cells (E) and human CD45+ cells (F) in the skin xenografts, 100×. The number of positive cells was quantified from two representative 400× fields from each transplanted xenograft. Statistics by one-way ANOVA with Tukey’s post-test. (G–J) Representative contour plot and absolute numbers of skin-infiltrating (G) CD4+ and CD8+ cells, (H) skin CD8+CLA+ and CD4+CLA+ cells, (I) skin CD8+CCR8+ and CD4+CCR8+ cells, and (J) Th1, Th17, and Th2 in PBS-, CCL18, or CCL18+ anti-CCR8-treated groups that received human PBMCs. All data were normalized by square centimeter of tissue. Data represent a pool of two independent experiments (n = 4–6 animals per group) and are represented as mean ± SD. Statistics by one-way ANOVA with Tukey’s post-test. See also Figure S4.

Similar articles

Cited by

References

    1. Murray J.E. Organ transplantation (skin, kidney, heart) and the plastic surgeon. Plast. Reconstr. Surg. 1971;47:425–431. - PubMed
    1. Kollar B., Pomahac B., Riella L.V. Novel immunological and clinical insights in vascularized composite allotransplantation. Curr. Opin. Organ Transpl. 2019;24:42–48. - PubMed
    1. Hein R.E., Ruch D.S., Klifto C.S., Leversedge F.J., Mithani S.K., Pidgeon T.S., Richard M.J., Cendales L.C. Hand transplantation in the United States: a review of the organ procurement and transplantation network/united network for organ sharing database. Am. J. Transpl. 2019;20:1417–1423. - PubMed
    1. Islam S.A., Ling M.F., Leung J., Shreffler W.G., Luster A.D. Identification of human CCR8 as a CCL18 receptor. J. Exp. Med. 2013;210:1889–1898. - PMC - PubMed
    1. Günther C., Bello-Fernandez C., Kopp T., Kund J., Carballido-Perrig N., Hinteregger S., Fassl S., Schwärzler C., Lametschwandtner G., Stingl G., et al. CCL18 is expressed in atopic dermatitis and mediates skin homing of human memory T cells. J. Immunol. 2005;174:1723–1728. - PubMed

Publication types

Associated data