. 2022 Apr 14:10:861000.
doi: 10.3389/fcell.2022.861000. eCollection 2022.

Uncovering N4-Acetylcytidine-Related mRNA Modification Pattern and Landscape of Stemness and Immunity in Hepatocellular Carcinoma

Affiliations

Uncovering N4-Acetylcytidine-Related mRNA Modification Pattern and Landscape of Stemness and Immunity in Hepatocellular Carcinoma

Sicheng Liu et al. Front Cell Dev Biol. .

Abstract

N4-acetylcytidine (ac4C) is an ancient and conserved RNA modification. Previously, ac4C mRNA modification has been reported promoting proliferation and metastasis of tumor cells. However, it remains unclear whether and how ac4C-related mRNA modification patterns influencing the prognosis of hepatocellular carcinoma (HCC) patients. Hereby, we constructed an ac4Cscore model and classified patients into two groups and investigated the potential intrinsic and extrinsic characteristics of tumor. The ac4Cscore model, including COL15A1, G6PD and TP53I3, represented ac4C-related mRNA modification patterns in HCC. According to ac4Cscore, patients were stratified to high and low groups with distinct prognosis. Patients subject to high group was related to advanced tumor stage, higher TP53 mutation rate, higher tumor stemness, more activated pathways in DNA-repair system, lower stromal score, higher immune score and higher infiltrating of T cells regulatory. While patients attributed to low group were correlated with abundance of T cells CD4 memory, less aggressive immune subtype and durable therapy benefit. We also found ac4Cscore as a novel marker to predict patients' prognosis with anti-PD1 immunotherapy and/or mTOR inhibitor treatment. Our study for the first time showed the association between ac4C-related mRNA modification patterns and tumor intrinsic and extrinsic characteristics, thus influencing the prognosis of patients.

Keywords: ac4C; hepatocellular carcinoma; mRNA modification; prognosis predictor; tumor microenvironment; tumor stemness.


Conflict of interest statement

The authors declare that the research was conducted in the absence of any commercial or financial relationships that could be construed as a potential conflict of interest.

Figures

FIGURE 1
FIGURE 1
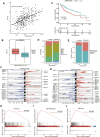
Potential oncogenic role of NAT10 in HCC. (A) Density plots show the expression of NAT10 in normal and HCC samples. Wilcox test with p value < 0.05 is considered as significant. (B) Representative images and statistics of IHC staining for NAT10 in liver tissues and HCC from the Human Protein Atlas dataset. Scale bar, 200 μM. (C) Survival analysis of NAT10 in HCC patients. Kaplan-Meier curves with log-rank p values < 0.05 are considered significant. (D) Cell proliferation of HepG2 and Huh7 cells after NAT10 knockdown measured with CCK-8, n = 3, data were expressed as mean ± SEM. (E) Cell proliferation of HepG2 and Huh7 cells after NAT10 knockdown measured with colony formation, n = 3. Left, representative image. Right, quantitative analysis, **, p < 0.01, ***, p < 0.001.
FIGURE 2
FIGURE 2
Identification of ac4C-DEGs associated with prognosis in HCC. (A) Venn diagram shows the number of intersected genes between ac4C peaks and DEGs. (B) Principal component analysis of the expression patterns of 21 ac4C-DEGs distinguishes tumor and normal samples. (C) Forest plot of multivariate Cox analysis determines three key genes significantly associated with overall survival. HRs are shown with 95% confidence intervals. * indicates p < 0.05 and ** p < 0.01. (D) The expression of three key genes between normal and tumor samples. The top and bottom of the boxes represent the 75th and 25th percentiles, respectively. The middle lines in the boxes represent median values. The black dots indicate outliers. **** indicates p < 0.0001. (E–G) Survival analysis for the three key genes. Kaplan-Meier curves with log-rank p values < 0.05 are considered significant. (H) Bar graphs show differential ac4C modification of COL15A1, G6PD, and TP53I3 between wild-type and NAT10-ablated cells.
FIGURE 3
FIGURE 3
Construction of the ac4Cscore model and different biological characteristics of groups. (A) Correlation of ac4Cscore and expression of NAT10. Pearson correlation coefficient with p value < 0.05 is considered significant. (B) The expression of NAT10 between the ac4Cscore high and low groups. T test with p value < 0.05 is considered significant. (C) Survival analysis for ac4Cscore groups. Kaplan-Meier curves with log-rank p values < 0.05 are considered significant. (D) Proportion of tumor grade in the ac4Cscore groups. (E) Proportion of patients with or without TP53 mutations in the ac4Cscore groups. Fisher’s exact test with p value < 0.05 is considered significant. (F, G) Significantly altered CNV regions of ac4Cscore high and low groups determined by GISTIC2. The left two panels show the profiles of the ac4Cscore high group, and the right two panels show the profiles of the low group. The panel with the red line indicates amplification regions, and the blue line indicates deletion regions. (H–J) GSEA plots show the upregulated genes in the ac4Cscore high group enriched in the cell cycle, DNA replication and ribosome pathways. A strict criterion with p value < 0.01 and adjusted p value < 0.05 is considered significant.
FIGURE 4
FIGURE 4
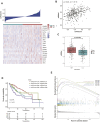
ac4Cscore is associated with tumor stemness. (A) Heatmap delineates the relationship between ac4Cscore and stem cell markers. (B) Correlation of ac4Cscore and estimated mRNAsi. A Pearson correlation coefficient with p value < 0.05 is considered significant. (C) The mRNAsi values between the ac4Cscore high and low groups. Each dot represents the value of individual patient. T test with p value < 0.05 is considered significant. (D) Survival analysis based on ac4Cscore and mRNAsi of patients. Log-rank t test with p value < 0.05 is considered significant. (E) GSEA plots show the upregulated genes in the ac4Cscore high group enriched in several stemness-related gene sets. Strict criterion with p value < 0.01 and adjusted p value < 0.05 is considered significant.
FIGURE 5
FIGURE 5
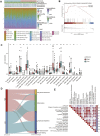
The landscape of the TME and biological characteristics in the ac4Cscore groups. (A) The calculated values of the TME score and proportion of immune cell infiltration of each patient. (B) GSEA plot shows the upregulated genes in the ac4Cscore high group enriched in the primary immunodeficiency pathway. (C) The distribution of 22 immune cell types in different ac4Cscore groups. Wilcoxon test is used for statistical analysis. * p < 0.05, ** p < 0.01, *** p < 0.001, **** p < 0.0001 and ns indicates not significant. (D) Alluvial diagram depicts the attribution of immune subtypes in the ac4Cscore groups. (E) Correlation plot displaying the relationships between ac4Cscore and immune signatures. Pearson correlation coefficient is used for analysis. Size and colors of circle indicates the coefficient.
FIGURE 6
FIGURE 6
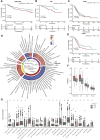
ac4Cscore is a common predictive marker in other datasets. (A–D) Survival analysis of the ac4Cscore groups in GSE14520, LIRI, LUAD and PAAD. Kaplan-Meier curves with log-rank p values < 0.05 are considered significant. (E) Ring heatmap of GSEA-based KEGG pathway analysis between the ac4Cscore-high and ac4Cscore-low groups. The inner most ring annotates pathway categories. Cells in the outer rings are colored by normalized enrichment score (NES) calculated by GSEA. A higher NES means higher pathway activity in the ac4Cscore-high group. Only pathways that showed consistent results in three HCC datasets are extracted and visualized. (F) The mRNAsi values for ac4Cscore high and low groups in GSE14520, LIRI, LUAD and PAAD. Dots represent the outliers. (G) The distribution of 22 immune cell types for the four ac4Cscore groups. Wilcoxon test is used for statistical analysis. * p < 0.05, ** p < 0.01, *** p < 0.001, **** p < 0.0001 and ns means not significant.
FIGURE 7
FIGURE 7
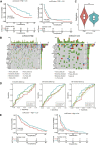
ac4Cscore is a prognostic biomarker in anti-PD1/mTOR treatment cohorts. (A) Survival analysis for ac4Cscore groups treated with anti-PD1 inhibitors. Left: overall survival; Right: progression-free survival. (B) Waterfall plots depict SNVs and INDELs of patients in the anti-PD1 cohort. Left, ac4Cscore high group; Right, ac4Cscore low group. (C) The value of the calculated dysfunction score for the ac4Cscore high and low groups in the anti-PD1 cohort. ** represented p < 0.01. (D) Roc curves delineating ac4Cscore and the expression of PDCD1 and TIDE on the overall survival of the anti-PD1 cohort at the 12-, 36- and 60-month follow-ups. (E) Survival analysis for ac4Cscore groups treated with anti-mTOR inhibitors. Left: overall survival; Right: progression-free survival.

References

    1. Arango D., Sturgill D., Alhusaini N., Dillman A. A., Sweet T. J., Hanson G., et al. (2018). Acetylation of Cytidine in mRNA Promotes Translation Efficiency. Cell 175 (7), 1872–1886. e24. 10.1016/j.cell.2018.10.030 - DOI - PMC - PubMed
    1. Batlle E., Clevers H. (2017). Cancer Stem Cells Revisited. Nat. Med. 23 (10), 1124–1134. 10.1038/nm.4409 - DOI - PubMed
    1. Bauer T., Trump S., Ishaque N., Thurmann L., Gu L., Bauer M., et al. (2016). Environment-induced Epigenetic Reprogramming in Genomic Regulatory Elements in Smoking Mothers and Their Children. Mol. Syst. Biol. 12 (3), 861. 10.15252/msb.20156520 - DOI - PMC - PubMed
    1. Bayik D., Lathia J. D. (2021). Cancer Stem Cell-Immune Cell Crosstalk in Tumour Progression. Nat. Rev. Cancer 21 (8), 526–536. 10.1038/s41568-021-00366-w - DOI - PMC - PubMed
    1. Binnewies M., Roberts E. W., Kersten K., Chan V., Fearon D. F., Merad M., et al. (2018). Understanding the Tumor Immune Microenvironment (TIME) for Effective Therapy. Nat. Med. 24 (5), 541–550. 10.1038/s41591-018-0014-x - DOI - PMC - PubMed