

Quantifying the Population-Level Effect of the COVID-19 Mass Vaccination Campaign in Israel: A Modeling Study
- PMID: 35493128
- PMCID: PMC9043004
- DOI: 10.1093/ofid/ofac087
Quantifying the Population-Level Effect of the COVID-19 Mass Vaccination Campaign in Israel: A Modeling Study
Abstract
Background: Estimating real-world vaccine effectiveness is challenging as a variety of population factors can impact vaccine effectiveness. We aimed to assess the population-level reduction in cumulative severe acute respiratory syndrome coronavirus 2 (SARS-CoV-2) cases, hospitalizations, and mortality due to the BNT162b2 mRNA coronavirus disease 2019 (COVID-19) vaccination campaign in Israel during January-February 2021.
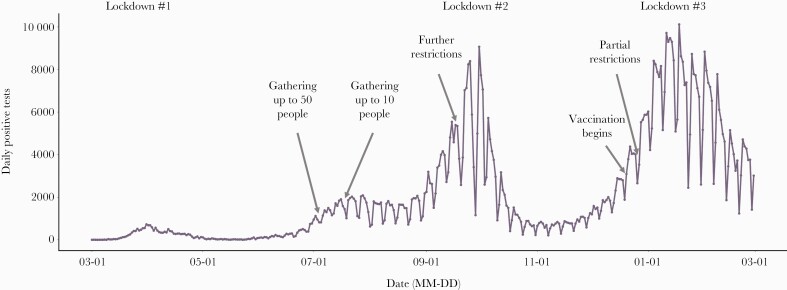
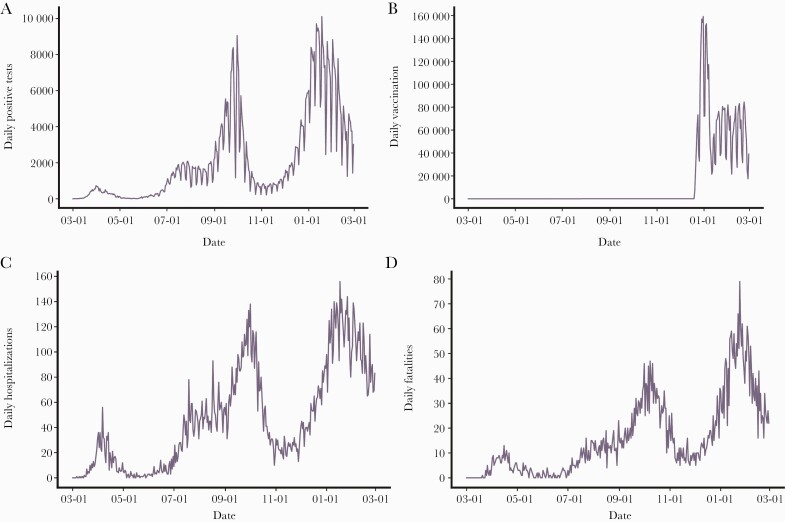
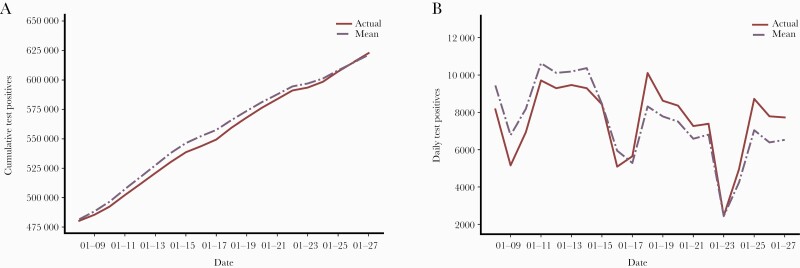
Methods: A susceptible-infected-recovered/removed (SIR) model and a Dynamic Survival Analysis (DSA) statistical approach were used. Daily counts of individuals who tested positive and of vaccine doses administered, obtained from the Israeli Ministry of Health, were used to calibrate the model. The model was parameterized using values derived from a previous phase of the pandemic during which similar lockdown and other preventive measures were implemented in order to take into account the effect of these prevention measures on COVID-19 spread.
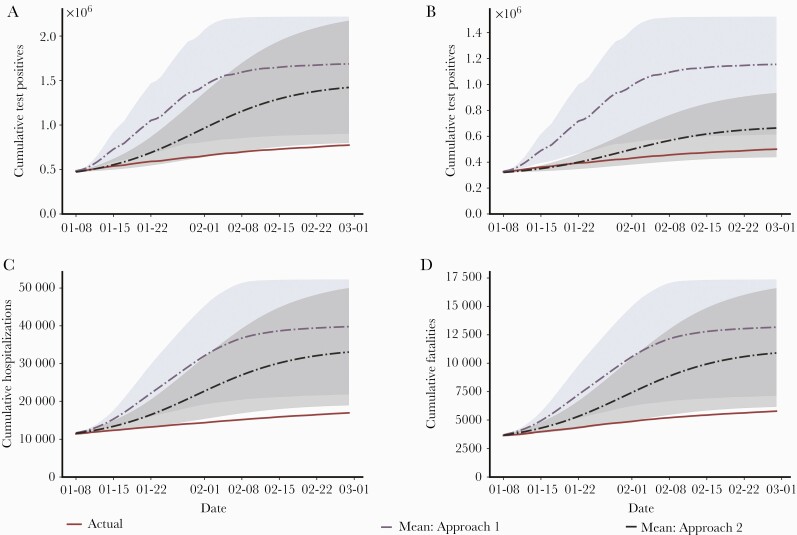
Results: Our model predicted for the total population a reduction of 648 585 SARS-CoV-2 cases (75% confidence interval [CI], 25 877-1 396 963) during the first 2 months of the vaccination campaign. The number of averted hospitalizations for moderate to severe conditions was 16 101 (75% CI, 2010-33 035), and reduction of death was estimated at 5123 (75% CI, 388-10 815) fatalities. Among children aged 0-19 years, we estimated a reduction of 163 436 (75% CI, 0-433 233) SARS-CoV-2 cases, which we consider to be an indirect effect of the vaccine.
Conclusions: Our results suggest that the rapid vaccination campaign prevented hundreds of thousands of new cases as well as thousands of hospitalizations and fatalities and has probably averted a major health care crisis.
Keywords: COVID-19; effect; modeling; real-life; vaccination.
© The Author(s) 2022. Published by Oxford University Press on behalf of Infectious Diseases Society of America.
Figures
Similar articles
-
Infections, hospitalisations, and deaths averted via a nationwide vaccination campaign using the Pfizer-BioNTech BNT162b2 mRNA COVID-19 vaccine in Israel: a retrospective surveillance study.Lancet Infect Dis. 2022 Mar;22(3):357-366. doi: 10.1016/S1473-3099(21)00566-1. Epub 2021 Sep 22. Lancet Infect Dis. 2022. PMID: 34562375 Free PMC article.
-
Estimated COVID-19 severe cases and deaths averted in the first year of the vaccination campaign in Brazil: A retrospective observational study.Lancet Reg Health Am. 2023 Jan;17:100418. doi: 10.1016/j.lana.2022.100418. Epub 2022 Dec 22. Lancet Reg Health Am. 2023. PMID: 36575682 Free PMC article.
-
Estimating the number of severe COVID-19 cases and COVID-19-related deaths averted by a nationwide vaccination campaign in Republic of Korea.Osong Public Health Res Perspect. 2023 Jun;14(3):164-172. doi: 10.24171/j.phrp.2023.0096. Epub 2023 Jun 22. Osong Public Health Res Perspect. 2023. PMID: 37415433 Free PMC article.
-
Direct impact of COVID-19 vaccination in Chile: averted cases, hospitalizations, ICU admissions, and deaths.BMC Infect Dis. 2024 May 3;24(1):467. doi: 10.1186/s12879-024-09304-1. BMC Infect Dis. 2024. PMID: 38698324 Free PMC article.
-
Effect of Pfizer/BioNTech and Oxford/AstraZeneca vaccines against COVID-19 morbidity and mortality in real-world settings at countrywide vaccination campaign in Saudi Arabia.Eur Rev Med Pharmacol Sci. 2021 Nov;25(22):7185-7191. doi: 10.26355/eurrev_202111_27271. Eur Rev Med Pharmacol Sci. 2021. PMID: 34859883
Cited by
-
A Game-Theory-Based Approach to Promoting Health Policy among Minorities.Int J Environ Res Public Health. 2023 Feb 28;20(5):4335. doi: 10.3390/ijerph20054335. Int J Environ Res Public Health. 2023. PMID: 36901344 Free PMC article.
-
Projecting COVID-19 Cases and Subsequent Hospital Burden in Ohio.medRxiv [Preprint]. 2022 Jul 29:2022.07.27.22278117. doi: 10.1101/2022.07.27.22278117. medRxiv. 2022. Update in: J Theor Biol. 2023 Mar 21;561:111404. doi: 10.1016/j.jtbi.2022.111404. PMID: 35923319 Free PMC article. Updated. Preprint.
-
Predictive models for health outcomes due to SARS-CoV-2, including the effect of vaccination: a systematic review.Syst Rev. 2024 Jan 16;13(1):30. doi: 10.1186/s13643-023-02411-1. Syst Rev. 2024. PMID: 38229123 Free PMC article.
-
Projecting COVID-19 cases and hospital burden in Ohio.J Theor Biol. 2023 Mar 21;561:111404. doi: 10.1016/j.jtbi.2022.111404. Epub 2023 Jan 7. J Theor Biol. 2023. PMID: 36627078 Free PMC article.
-
Effect of vaccination on the case fatality rate for COVID-19 infections 2020-2021: multivariate modelling of data from the US Department of Veterans Affairs.BMJ Open. 2022 Dec 23;12(12):e064135. doi: 10.1136/bmjopen-2022-064135. BMJ Open. 2022. PMID: 36564105 Free PMC article.
References
-
- Haas EJ, Angulo FJ, McLaughlin JM, et al. . Impact and effectiveness of mRNA BNT162b2 vaccine against SARS-CoV-2 infections and COVID-19 cases, hospitalisations, and deaths following a nationwide vaccination campaign in Israel: an observational study using national surveillance data. Lancet 2021; 397:1819–29. - PMC - PubMed
-
- Chodick G, Tene L, Patalon T, et al. . The effectiveness of the first dose of BNT162b2 vaccine in reducing SARS-CoV -2 infection 13-24 days after immunization: real-world evidence. medRxiv 2021.01.27.21250612 [Preprint]. 29 January 2021. Available at: 10.1101/2021.01.27.21250612. Accessed 15 March 2022. - DOI
LinkOut - more resources
Full Text Sources
Miscellaneous
