

Effect of co-administration of metformin and extracts of Costus pictus D.Don leaves on alloxan-induced diabetes in rats
- PMID: 35493313
- PMCID: PMC9039101
- DOI: 10.1016/j.jtcme.2021.08.007
Effect of co-administration of metformin and extracts of Costus pictus D.Don leaves on alloxan-induced diabetes in rats
Abstract
Background and aim: The present study evaluates the antidiabetic effects of aqueous (CPAQ) and methanolic (CPME) extract of Costus pictus D. Don singly and/or in combination with metformin in alloxan-induced diabetic rats.
Experimental procedure: CPAQ and CPME (400 mg/kg dose), metformin (120 mg/kg) and two different combinations of plant extracts and metformin (200 + 60 mg/kg and 400 mg/kg + 60 mg/kg) were orally given to alloxan-induced diabetic rats for 21 days. At 0, 7, 14, and 21 days, body weight and blood glucose levels were measured.
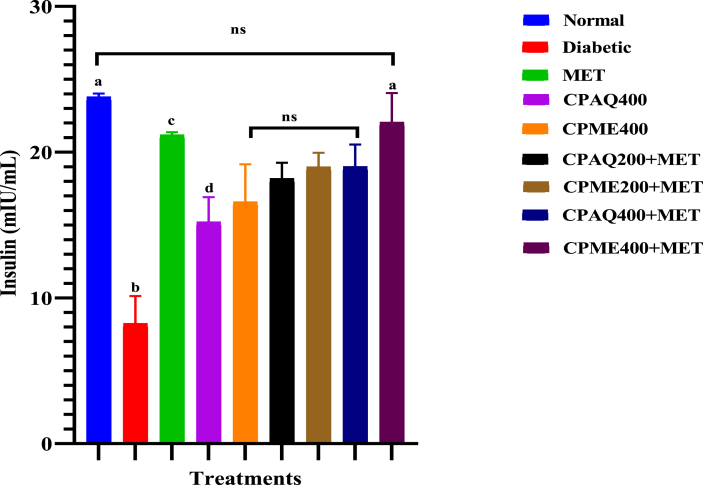
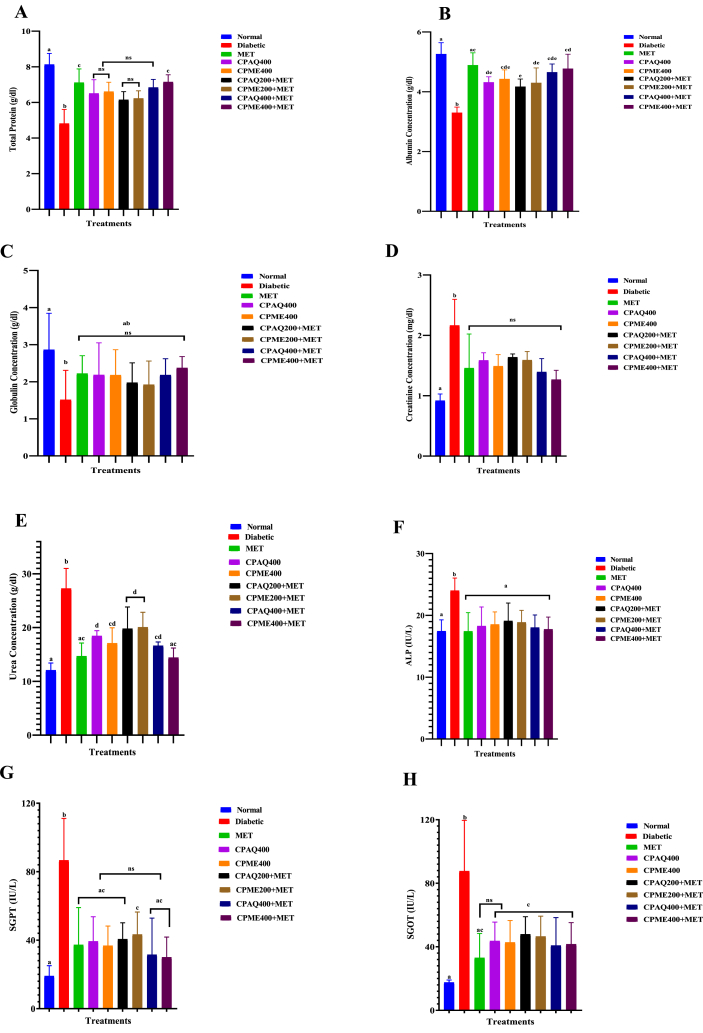
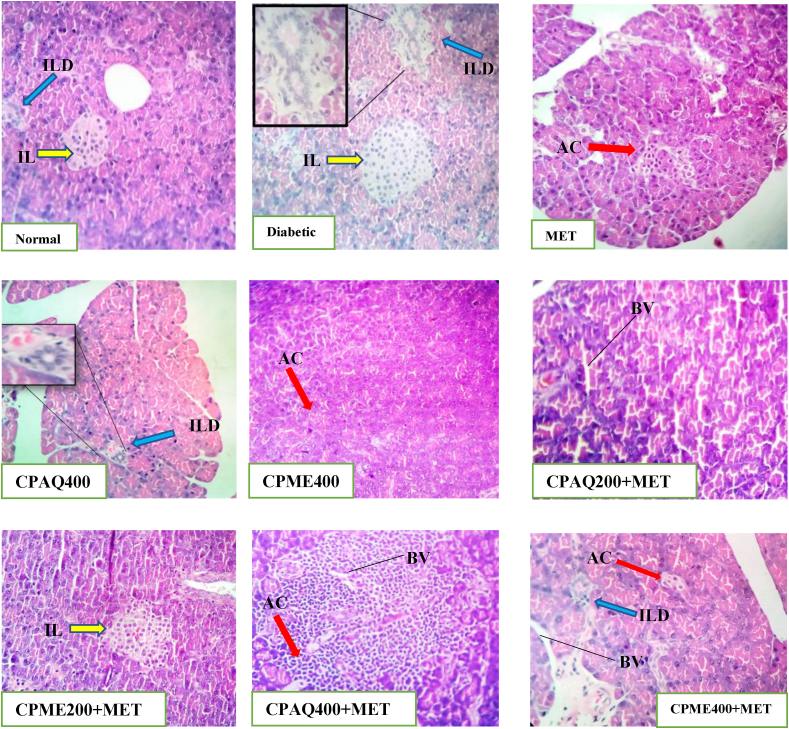
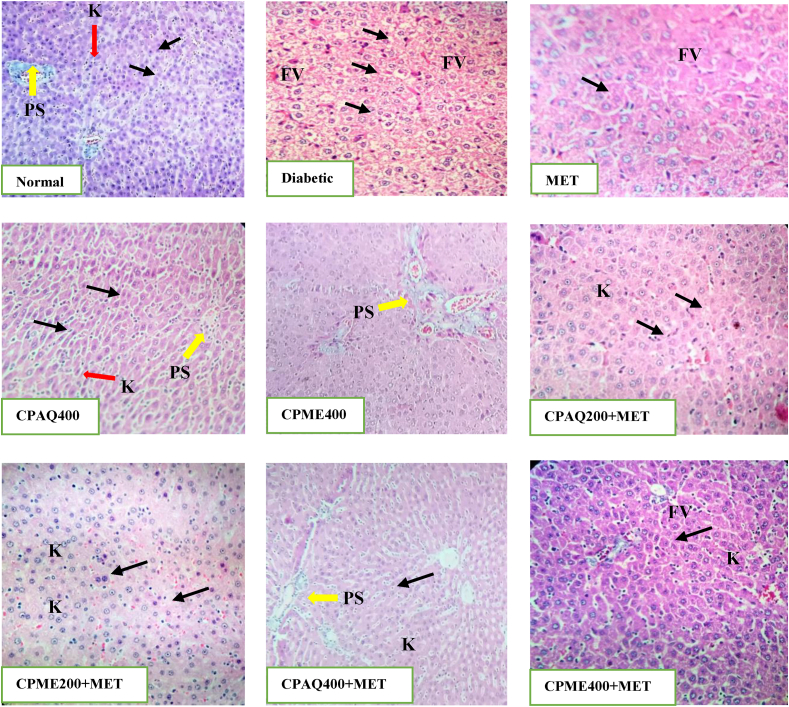
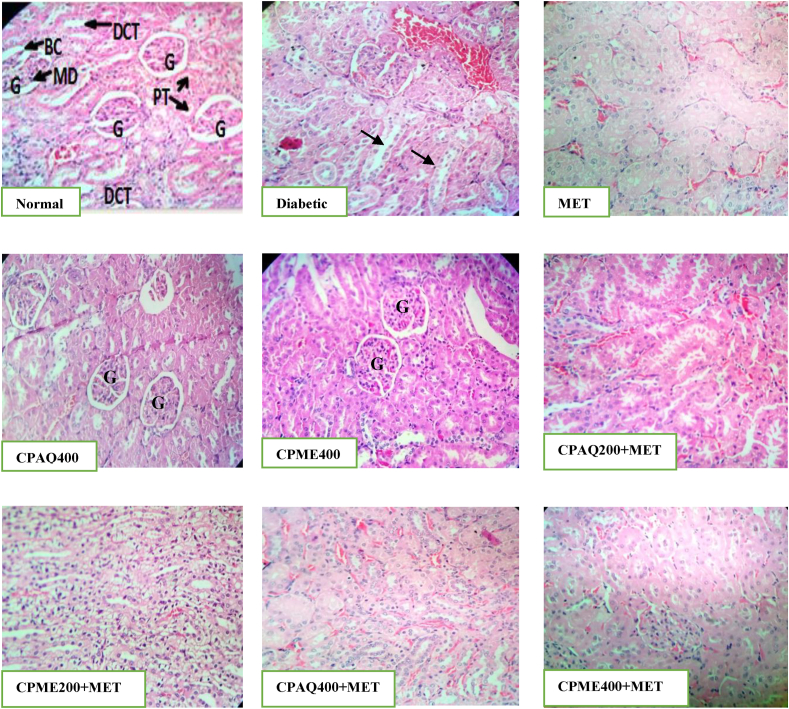
Results and conclusion: After 21 days of treatment, biochemical profiling and histopathology analysis were carried out. CPAQ and CPME, when administrated separately, could decrease blood glucose levels (P ≤ 0.05). CPME showed more promising results (P ≤ 0.05) compared to the diabetic control group. Extracts co-administrated with metformin showed dose-dependent significant recovery of hypoglycemic activity of metformin. Fasting blood glucose levels, body weight, protein, and lipid profile of the treatment group were compared to the diabetic and normal control groups. Animal groups co-administered with CPME and metformin showed more significant effects on the recovery of tissue damages. The synergistic effect of plant extracts with metformin has positive effects on all the parameters and enhanced the efficiency and reduction of blood glucose levels.
Keywords: Costaceae; Histopathology; Hypoglycaemia; Insulin; Synergistic.
© 2021 Center for Food and Biomolecules, National Taiwan University. Production and hosting by Elsevier Taiwan LLC.
Conflict of interest statement
The authors declare no conflict of interest.
Figures


Similar articles
-
Methanolic Extract of Costus pictus D. DON Induces Cytotoxicity in Liver Hepatocellular Carcinoma Cells Mediated by Histone Deacetylase Inhibition.Pharmacogn Mag. 2017 Oct;13(Suppl 3):S533-S538. doi: 10.4103/pm.pm_524_16. Epub 2017 Oct 11. Pharmacogn Mag. 2017. PMID: 29142410 Free PMC article.
-
Antihyperglycemic and insulin secretory activity of Costus pictus leaf extract in streptozotocin induced diabetic rats and in in vitro pancreatic islet culture.J Ethnopharmacol. 2009 Jun 25;123(3):470-4. doi: 10.1016/j.jep.2009.03.026. Epub 2009 Mar 26. J Ethnopharmacol. 2009. PMID: 19501280
-
Cytological and biochemical studies during the progression of alloxan-induced diabetes and possible protection of an aqueous leaf extract of Costus afer.Chin J Nat Med. 2014 Oct;12(10):745-52. doi: 10.1016/S1875-5364(14)60114-X. Epub 2014 Oct 31. Chin J Nat Med. 2014. PMID: 25443367
-
Possible antidiabetic and antihyperlipidaemic effect of fermented Parkia biglobosa (JACQ) extract in alloxan-induced diabetic rats.Clin Exp Pharmacol Physiol. 2006 Sep;33(9):808-12. doi: 10.1111/j.1440-1681.2006.04444.x. Clin Exp Pharmacol Physiol. 2006. PMID: 16922811
-
Morphological changes in the pancreas and glucose reduction of the aqueous extract of Costus afer leaf on alloxan-induced diabetic rats.J Basic Clin Physiol Pharmacol. 2015 Nov;26(6):595-601. doi: 10.1515/jbcpp-2014-0033. J Basic Clin Physiol Pharmacol. 2015. PMID: 25514330
Cited by
-
An Update on Pharmacological and Phytochemical Aspects of Costus pictus D. Don - A Promising Anti-diabetic Plant.Curr Top Med Chem. 2024;24(9):810-829. doi: 10.2174/0115680266278569240123115329. Curr Top Med Chem. 2024. PMID: 38288805 Review.
-
Apoptotic and proliferative processes in the small intestine of rats with type 2 diabetes mellitus after metformin and propionic acid treatment.Front Pharmacol. 2024 Oct 16;15:1477793. doi: 10.3389/fphar.2024.1477793. eCollection 2024. Front Pharmacol. 2024. PMID: 39478962 Free PMC article.
-
Investigating the potential effects of olive leaves and ginger rhizome extracts on kidney and liver functions in alloxan-induced diabetic rats.Avicenna J Phytomed. 2025 May-Jun;15(3):1124-1136. doi: 10.22038/ajp.2024.24986. Avicenna J Phytomed. 2025. PMID: 40365185 Free PMC article.
-
Lactiplantibacillus plantarum and Saussurea costus as Therapeutic Agents against a Diabetic Rat Model-Approaches to Investigate Pharmacophore Modeling of Human IkB Kinase and Molecular Interaction with Dehydrocostus Lactone of Saussurea costus.Metabolites. 2023 Jun 19;13(6):764. doi: 10.3390/metabo13060764. Metabolites. 2023. PMID: 37367922 Free PMC article.
-
Emerging therapeutic options in the management of diabetes: recent trends, challenges and future directions.Int J Obes (Lond). 2023 Dec;47(12):1179-1199. doi: 10.1038/s41366-023-01369-3. Epub 2023 Sep 11. Int J Obes (Lond). 2023. PMID: 37696926 Review.
References
-
- Shaw J.E., Sicree R.A., Zimmet P.Z. Global estimates of the prevalence of diabetes for 2010 and 2030. Diabetes Res Clin Pract. 2010;87(1):4–14. - PubMed
-
- Kerner W., Brückel J. Definition, classification and diagnosis of diabetes mellitus. Exp Clin Endocrinol Diabetes. 2014;122(7):384–386. - PubMed
-
- Bailey C.J. Biguanides and NIDDM. Diabetes Care. 1992;15(6):755–772. - PubMed
-
- Stumvoll M., Nurjhan N., Perriello G., Dailey G., Gerich J.E. Metabolic effects of metformin in non-insulin-dependent diabetes mellitus. N Engl J Med. 1995;333(9):550–554. - PubMed
-
- Ting R.Z.-W., Szeto C.C., Chan M.H.-M., Ma K.K., Chow K.M. Risk factors of vitamin B12 deficiency in patients receiving metformin. Arch Intern Med. 2006;166(18):1975–1979. - PubMed
LinkOut - more resources
Full Text Sources