. 2022 Apr 14:13:853682.
doi: 10.3389/fimmu.2022.853682. eCollection 2022.

Differences in Humoral and Cellular Vaccine Responses to SARS-CoV-2 in Kidney and Liver Transplant Recipients

Affiliations

Differences in Humoral and Cellular Vaccine Responses to SARS-CoV-2 in Kidney and Liver Transplant Recipients

Lucrezia Furian et al. Front Immunol. .

Abstract

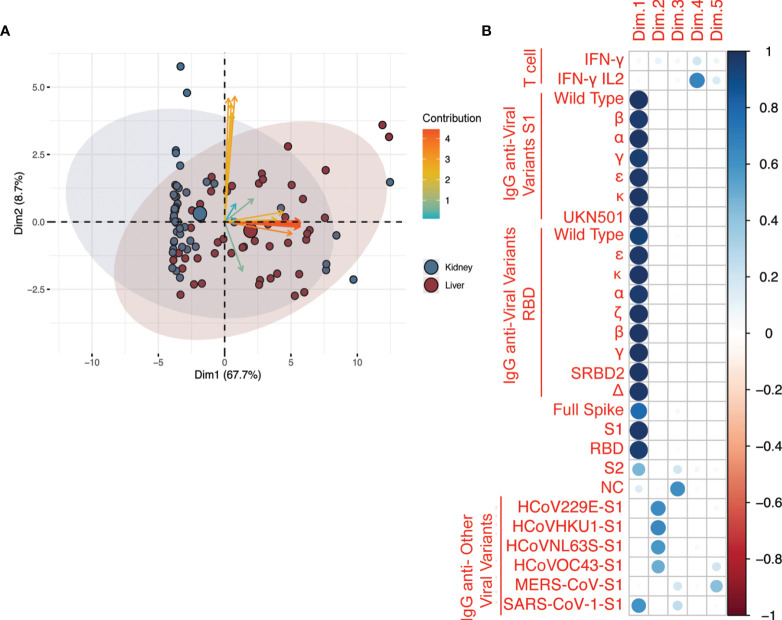
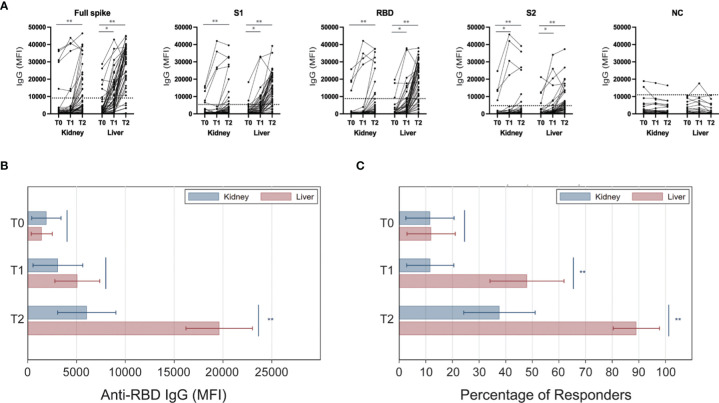
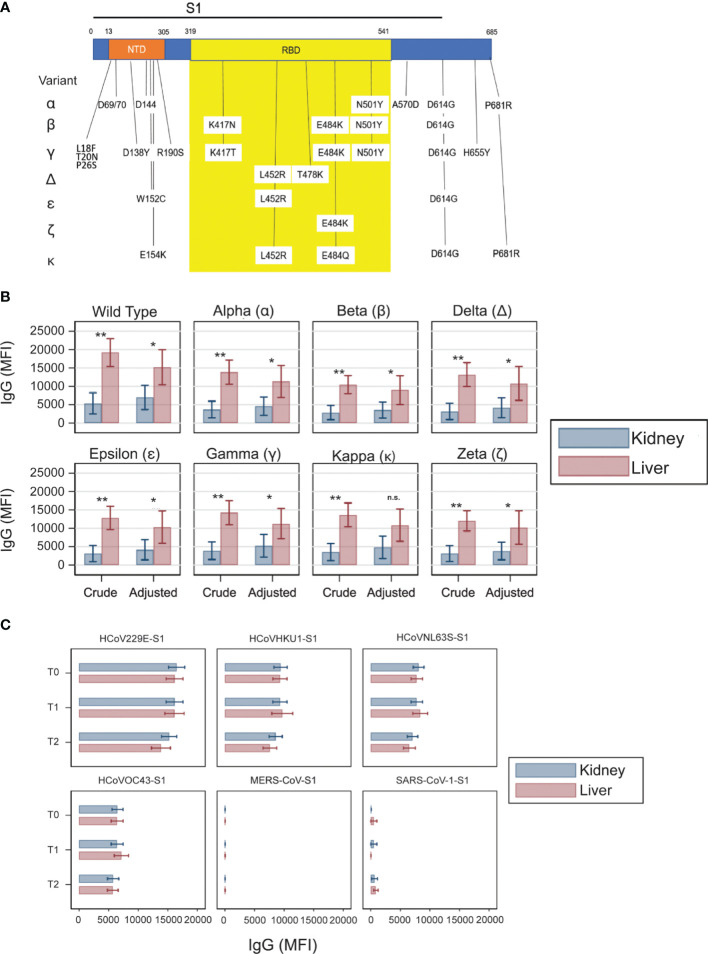
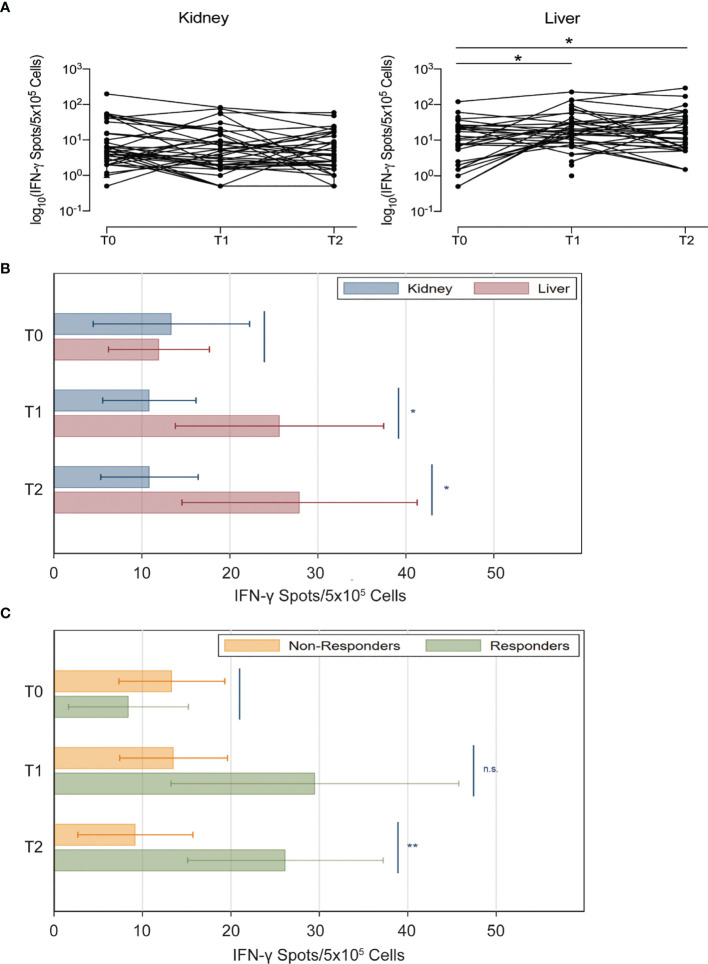
The antibody and T cell responses after SARS-CoV-2 vaccination have not been formally compared between kidney and liver transplant recipients. Using a multiplex assay, we measured IgG levels against 4 epitopes of SARS-CoV-2 spike protein and nucleocapsid (NC) antigen, SARS-CoV-2 variants, and common coronaviruses in serial blood samples from 52 kidney and 50 liver transplant recipients undergoing mRNA SARS-CoV-2 vaccination. We quantified IFN-γ/IL-2 T cells reactive against SARS-CoV-2 spike protein by FluoroSpot. We used multivariable generalized linear models to adjust for the differences in immunosuppression between groups. In liver transplant recipients, IgG levels against every SARS-CoV-2 spike epitope increased significantly more than in kidney transplant recipients (MFI: 19,617 vs 6,056; P<0.001), a difference that remained significant after adjustments. Vaccine did not affect IgG levels against NC nor common coronaviruses. Elicited antibodies recognized all variants tested but at significantly lower strength than the original Wuhan strain. Anti-spike IFN-γ-producing T cells increased significantly more in liver than in kidney transplant recipients (IFN-γ-producing T cells 28 vs 11 spots/5x105 cells), but this difference lost statistical significance after adjustments. SARS-CoV-2 vaccine elicits a stronger antibody response in liver than in kidney transplant recipients, a phenomenon that is not entirely explained by the different immunosuppression.

Keywords: COVID-19; T cell; antibody; immunosuppression; variant.


Conflict of interest statement

JM has received research support and honoraria from Thermo Fisher Scientific/One Lambda, Inc. The remaining authors declare that the research was conducted in the absence of any commercial or financial relationships that could be construed as a potential conflict of interest.

Figures

Figure 1
Figure 1
Principal component analysis (PCA) of all the assays after second vaccination. (A) Analysis included antibodies against anti-SARS-CoV-2, anti-SARS-CoV-2 variants, and common coronaviruses, and IFN-γ and IL-2 T cell responses. The axes represent the two variables, among all those generated by PCA, that ranked first in terms of proportion of assay variability. The variables are represented by arrows; blue arrows = Fluorospot assays, orange arrows = anti-SARS-CoV-2 serological assays, yellow = serological assays for other coronaviruses. The angle between arrows represents the correlation between assays: assays with the same direction have a correlation coefficient of 1, those with opposite directions have a correlation coefficient of -1. Those that are perpendicular to each other have a correlation coefficient of 0. The patients are represented by data points with individual point size proportional to the quality of representation in the bi-dimensional plot. The plot is based on data after two vaccinations only (T2). The categorical variable type-of-solid-organ-transplantation (i.e. kidney vs liver) is added to the plot as a supplementary variable to visualize how the pattern of correlated variables and cloud of data points are distributed between types of solid organ transplantation. The colored ellipses represent the 95% confidence ellipses of the scatter around overall assay mean of each group (liver = blue or kidney = red). (B) Correlation between the five principal components extracted from PCA and the original variables (assays: T cell reactivity and IgG against SARS-CoV2 antigens and variants and other coronaviruses, including common coronaviruses: HCoV229E-S1, HCoVHKU1-S1, HCoVNL63S-S1, HCoVOC43-S1). As shown by the legend in the rightmost column, the correlation is represented by a color gradient as follows: blue for positive correlation, red for negative correlation, and white for no correlation. The correlation coefficient is represented by a circle, the diameter of which is proportional to the strength of the correlation. The variability explained by the principal components Dim.1 to Dim.5 was 67.7, 8.7, 5.6, 3.8, and 3.5%, respectively (not shown).
Figure 2
Figure 2
Anti-viral IgG levels in kidney and liver transplant recipients after SARS-CoV-2 vaccination. Serum samples were collected at the time of the first (T0) and the second (T1) mRNA SARS-CoV-2 vaccine administration, and at 3 weeks after the second dose (T2). (A) Serological response of individual subjects against each of the tested viral antigens. Level considered positive is indicated by dotted horizontal lines for each antibody specificity. (B) Levels of IgG anti-RBD in kidney (blue) and liver (red) kidney transplant recipients at each time point. (C) Analyses shown in panel B were repeated after stratifying patients based on anti-RBD antibody response (MFI threshold for positivity: 8880). Horizontal lines represent 95 percent confidence intervals. *P < 0.05, **P < 0.01. MFI, Mean Fluorescence Intensity.
Figure 3
Figure 3
Antibody responses against the SARS-CoV-2 variants and non-SARS-CoV-2 coronaviruses. (A) Schematic of the SARS-CoV-2 S1 region with N terminal domain (NTD) and receptor binding domain (RBD) indicated. Vertical drop downs list the location and amino acid changes from each variant conjugated to the beads. (B) Crude and adjusted levels of IgG anti-RBD in various SARS-CoV-2 variants in kidney (blue) and liver (red) kidney transplant recipients on tacrolimus at T2. Adjusted analysis was adjusted for induction, blood tacrolimus levels, mycophenolate use, and steroid use. Horizontal lines represent 95 percent confidence intervals. n.s., not significant; *P < 0.05, **P < 0.01. (C) Antibody strength directed against the S1 region of non-SARS-CoV-2 coronaviruses. MFI thresholds for positivity: HCoV229ES1: 11,636; HCoVHKU1S1: 6,161; HCoVNL63SS1: 6,392; HCoVOC43S1: 4,888; MERSCoVS1: 27; SARSCoV1: 58.
Figure 4
Figure 4
Anti-spike IFN-γ+ T cell responses in kidney and liver transplant recipients after SARS-CoV-2 vaccination. (A) Anti-spike IFN-γ+ T cell spots of individual subjects (natural logarithmic scale). (B) Number of spots of anti-S IFN-γ FluoroSpot in kidney (blue) and liver (red) transplant recipients at each time point. (C) Analyses shown in panel B were repeated after stratifying patients based on anti-RBD antibody response (MFI threshold for positivity: 8880) (kidney and liver transplant recipients have been pooled together for this analysis). Horizontal lines represent 95 percent confidence intervals n.s., not significant; *P < 0.05, **P < 0.01.

References

    1. Woodle ES, Gebel HM, Montgomery RA, Maltzman JS. SARS-CoV-2 Vaccination, Immune Responses, and Antibody Testing in Immunosuppressed Populations: Tip of the Iceberg. Transplantation (2021) 105(9):1911–3. doi: 10.1097/TP.0000000000003859 - DOI - PubMed
    1. Kumar D, Blumberg EA, Danziger-Isakov L, Kotton CN, Halasa NB, Ison MG, et al. . Influenza Vaccination in the Organ Transplant Recipient: Review and Summary Recommendations. Am J Transpl (2011) 11(10):2020–30. doi: 10.1111/j.1600-6143.2011.03753.x - DOI - PubMed
    1. Lindemann M, Zaslavskaya M, Fiedler M, Wilde B, Heinemann FM, Heinold A, et al. . Humoral and Cellular Responses to a Single Dose of Fendrix in Renal Transplant Recipients With Non-Response to Previous Hepatitis B Vaccination. Scand J Immunol (2017) 85(1):51–7. doi: 10.1111/sji.12497 - DOI - PubMed
    1. Friedrich P, Sattler A, Muller K, Nienen M, Reinke P, Babel N. Comparing Humoral and Cellular Immune Response Against HBV Vaccine in Kidney Transplant Patients. Am J Transpl (2015) 15(12):3157–65. doi: 10.1111/ajt.13380 - DOI - PubMed
    1. Thuluvath PJ, Robarts P, Chauhan M. Analysis of Antibody Responses After COVID-19 Vaccination in Liver Transplant Recipients and Those With Chronic Liver Diseases. J Hepatol (2021) 75(6):1434–9. doi: 10.1016/j.jhep.2021.08.008 - DOI - PMC - PubMed

Publication types

Supplementary concepts