. 2022 Apr 14:13:826164.
doi: 10.3389/fimmu.2022.826164. eCollection 2022.

Peptides-Coated Oncolytic Vaccines for Cancer Personalized Medicine

Affiliations

Peptides-Coated Oncolytic Vaccines for Cancer Personalized Medicine

Sara Feola et al. Front Immunol. .

Abstract

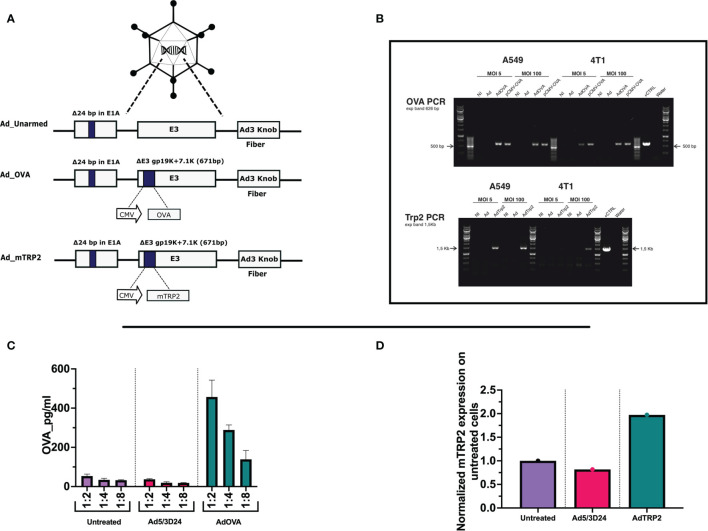
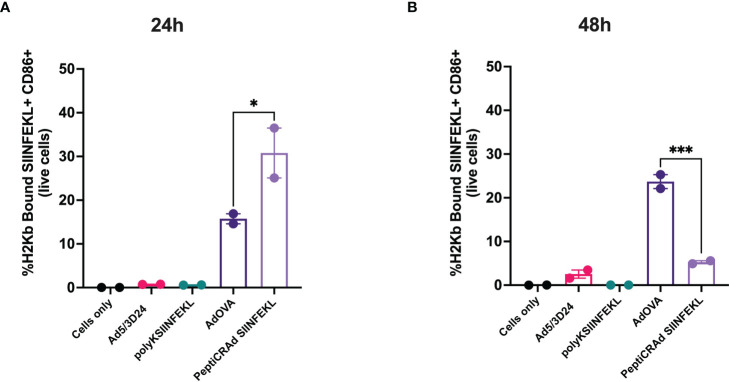
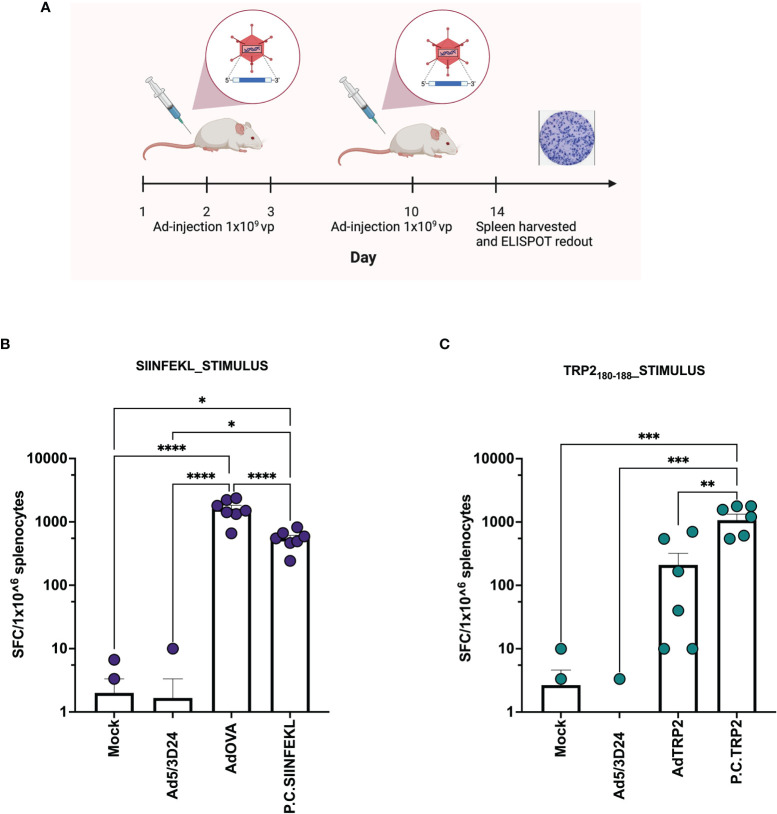
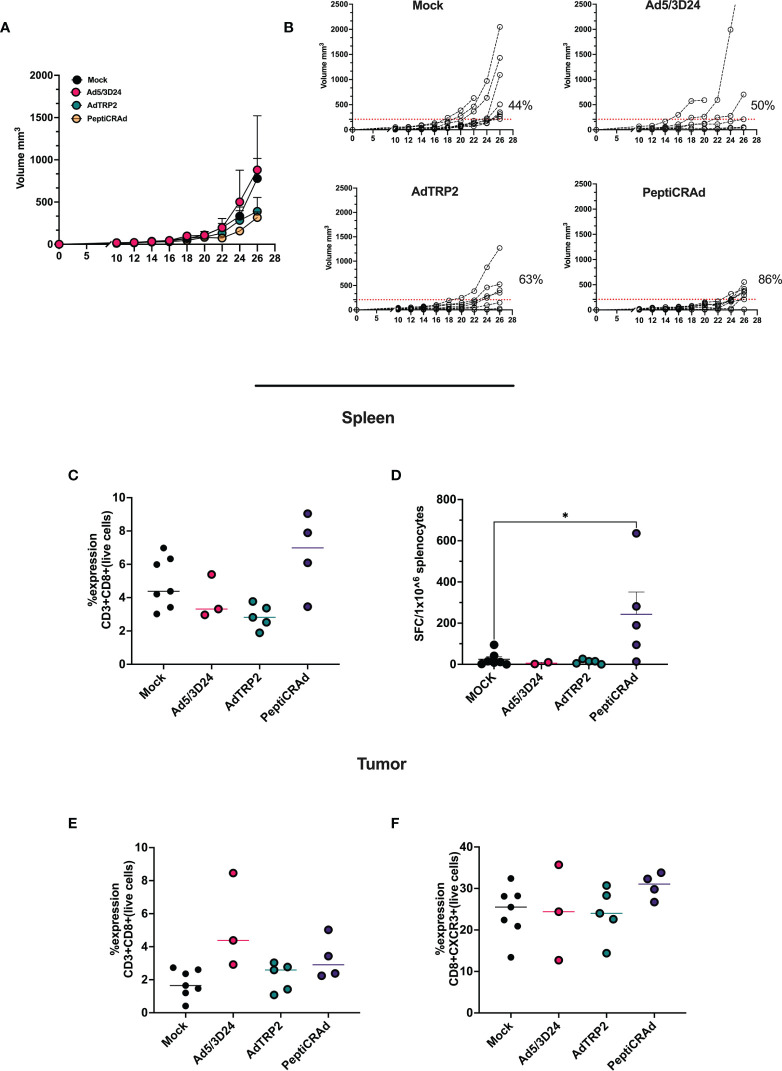
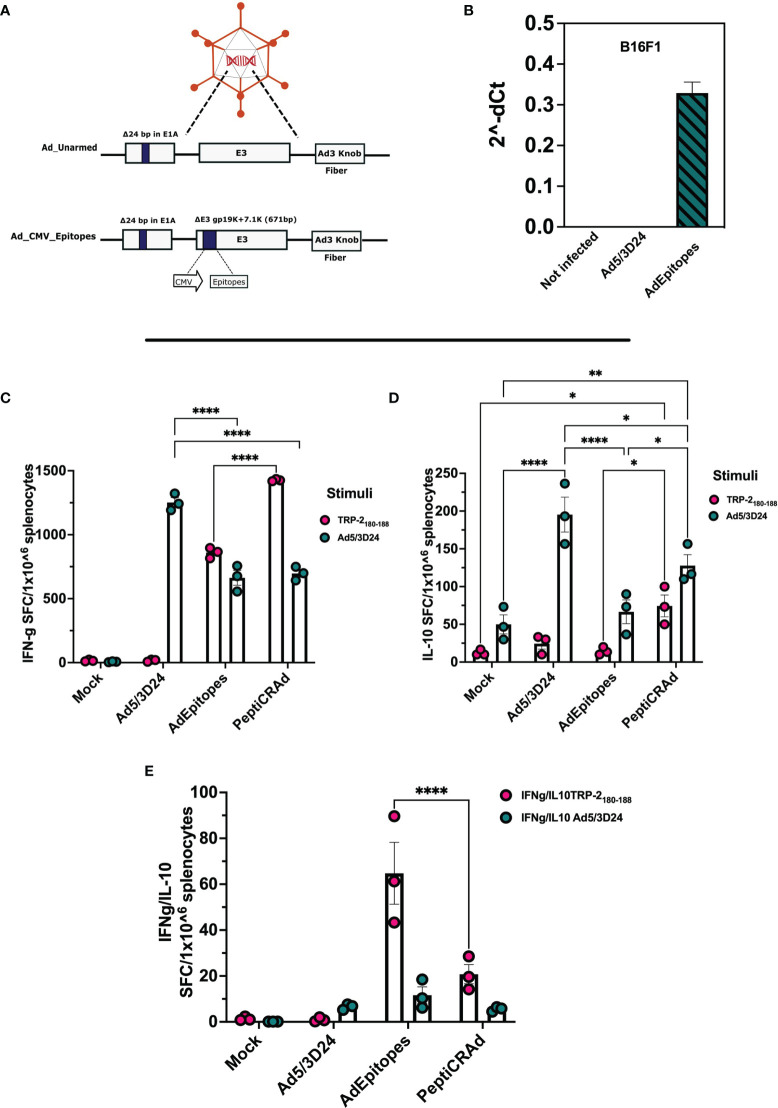
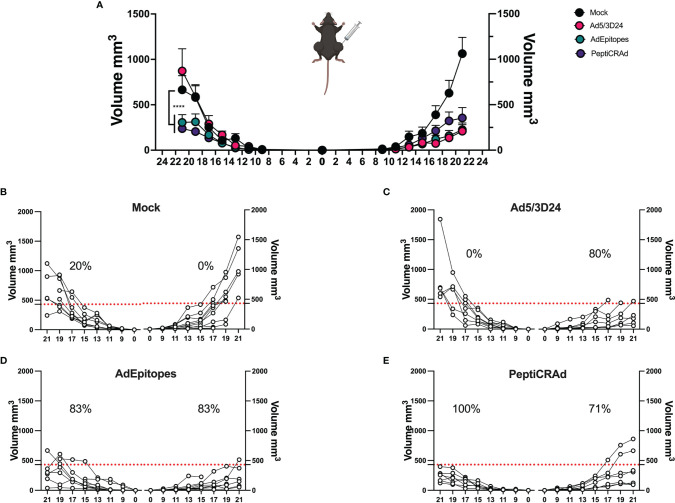
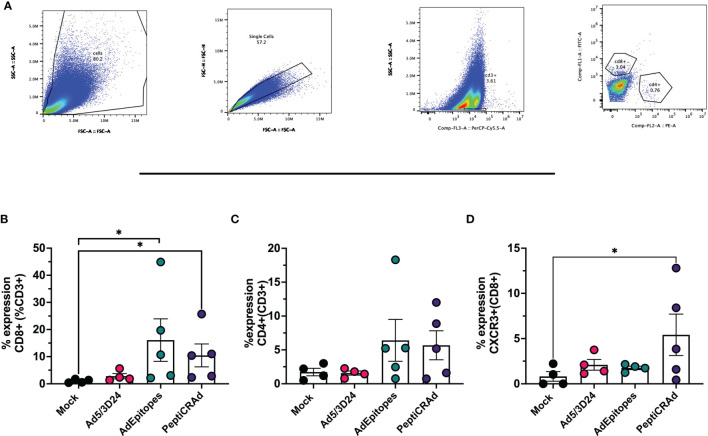
Oncolytic Viruses (OVs) work through two main mechanisms of action: the direct lysis of the virus-infected cancer cells and the release of tumor antigens as a result of the viral burst. In this sc.enario, the OVs act as in situ cancer vaccines, since the immunogenicity of the virus is combined with tumor antigens, that direct the specificity of the anti-tumor adaptive immune response. However, this mechanism in some cases fails in eliciting a strong specific T cell response. One way to overcome this problem and enhance the priming efficiency is the production of genetically modified oncolytic viruses encoding one or more tumor antigens. To avoid the long and expensive process related to the engineering of the OVs, we have exploited an approach based on coating OVs (adenovirus and vaccinia virus) with tumor antigens. In this work, oncolytic viruses encoding tumor antigens and tumor antigen decorated adenoviral platform (PeptiCRAd) have been used as cancer vaccines and evaluated both for their prophylactic and therapeutic efficacy. We have first tested the oncolytic vaccines by exploiting the OVA model, moving then to TRP2, a more clinically relevant tumor antigen. Finally, both approaches have been investigated in tumor neo-antigens settings. Interestingly, both genetically modified oncolytic adenovirus and PeptiCRAd elicited T cells-specific anti-tumor responses. However, in vitro cross-representation experiments, showed an advantage of PeptiCRAd as regards the fast presentation of the model epitope SIINFEKL from OVA in an immunogenic rather than tolerogenic fashion. Here two approaches used as cancer oncolytic vaccines have been explored and characterized for their efficacy. Although the generation of specific anti-tumor T cells was elicited in both approaches, PeptiCRAd retains the advantage of being rapidly adaptable by coating the adenovirus with a different set of tumor antigens, which is crucial in personalized cancer vaccines clinical setting.

Keywords: PeptiCRAd; cancer vaccines; oncolytic viruses; personalized medicine; tumor antigens.


Conflict of interest statement

VC is a co-founder and shareholder at VALO Therapeutics. SP is an employee and a shareholder at VALO Therapeutics. The remaining authors declare that the research was conducted in the absence of any commercial or financial relationships that could be construed as a potential conflict of interest.

Figures

Figure 1
Figure 1
Generation and characterization of AdOVA and AdTRP2 (A) Schematic representation of oncolytic adenovirus delta 24 (Ad5/3-D24) constructs with modifications in E1, E3, and fiber region. Both unarmed (Ad_unarmed) and armed (Ad_OVA and Ad_mTRP2) bear a deletion of 24bp in the E1A gene. Additionally, AdOVA (Ad_OVA) and AdTRP2 (Ad_mTRP2) contains an expression cassette under CMV promoter in E3 region. (B) Reverse-transcribed PCR reaction with specific primers for OVA and mTRP2 on cDNA derived from A549 and 4T1 infected with 5 and 100 MOI. (C, D) A549 cells were infected with 10MOI and the cell lysate was collected at 48h and OVA and TRP2 levels were checked by ELISA and the data are depicted as bar plots.
Figure 2
Figure 2
DCs cross-present antigen in an immunogenic fashion upon stimulation with Ad encoding TAs or PeptiCRAd. Mouse dendritic cell line JAWS II was pulsed with Ad5/3Δ24, peptide alone (polyKSIINFEKL), AdOVA, PeptiCRAd-SIINFEKL or left unpulsed (cells only). The viruses were used at 250 MOI. Flow cytometry analysis was used to determine the cross-presentation at 24h (A) and 48h (B) post incubation. CD86 was used to measure DCs activation and an antibody specific for OVA peptide SIINFEKL complexed with H2Kb to detect the antigen presentation. The data are depicted as bar plot mean ± SEM. Statistical analysis was performed with ordinary One-way ANOVA (ns P > 0.05, *P ≤ 0.05, **P ≤ 0.01, ***P ≤ 0.001, P ≤ 0.0001).
Figure 3
Figure 3
Ad encoding TAs and PeptiCRAd show in vivo prophylactic efficacy. (A) Schematic representation of the schedule followed during the vaccination procedure. The mice have been subcutaneously injected with Ad5/3Δ24, PeptiCRAd (P.C. SIINFEKL, P.C. TRP2), cloned viruses (AdOVA, AdTRP2) or PBS (Mock) at day 1,2,3 and 10. The spleens were harvested at day 14. (B, C) IFN-γ ELISpot was performed on harvested splenocytes and individual response to SIINFEKL (B) and TRP2 (C) for each mouse is reported as IFN-γ spot forming cells (SFC)/106 splenocytes. The data are depicted as bar plot and mean + SEM is shown. (P.C.=PeptiCRAd) and the statistical analysis was performed with ordinary One-way ANOVA (ns P > 0.05, *P ≤ 0.05, **P ≤ 0.01, ***P ≤ 0.001, ****P ≤ 0.0001). Created with BioRender BioRender.com.
Figure 4
Figure 4
Intratumorally administration of PeptiCRAd induced tumor regression and immunological modulation (A) Ad5/3Δ24, AdTRP2 or PeptiCRAd was given intratumorally at 9,11,13 and 15 days post tumor implantation. The tumor growth was followed until the end of the experiment and the tumor size is presented as the mean ± SEM. Statistically difference was assessed with two-way ANOVA (ns P > 0.05, *P ≤ 0.05, **P ≤ 0.01, ***P ≤ 0.001, P ≤ 0.0001). (Mock n=9, Ad5/3Δ24 n=6 AdTRP2 n=8 or PeptiCRAd n=7) (B) Single tumor growth for single mouse for each treatment group is depicted. A threshold of 209 mm3 was set to define the percentage of mice responding to the different therapies (red dotted line). The percentage of responders in each treatment group is shown on the right side of the dotted line. (The threshold was defined as the median of the tumor size at the last day of the experiment in the Ad5/3Δ24 treated group). (C) Flow cytometry analysis of spleens from treated mice showing the frequency of CD8+T cells. Data are expressed as single dot for each mouse and median is reported (D) IFN-γ ELISpot was performed on harvested splenocytes and individual response to TRP2 for each mouse is reported as IFN-γ spot forming cells (SFC)/106 splenocytes. The data are depicted as dot plot and mean ± SEM is shown. Statistical analysis was performed with ordinary One-way ANOVA (ns P > 0.05, *P ≤ 0.05, **P ≤ 0.01, ***P ≤ 0.001, P ≤ 0.0001). The frequency of CD8+ (E) and CD8+CXCR3+ (F) was analyzed in TME through flow cytometry analysis and the data are shown as single dot for each mouse and median is reported.
Figure 5
Figure 5
Generation and characterization of AdEpitopes (A) Schematic representation of oncolytic adenovirus delta 24 (Ad5/3-D24) constructs with modifications in E1, E3, and fiber region. Both unarmed (Ad_unarmed) and armed (Ad_CMV_Epitopes) bear a deletion of 24bp in the E1A gene. Additionally, AdEpitopes (Ad_CMV_Epitopes) contains an expression cassette under CMV promoter in E3 region. (B) Real-time PCR was performed in B16F1 infected with 5MOI of AdEpitopes, Ad5/3Δ24 or left untreated (not infected) and the fold gene expression is analyzed as 2-dCt.The data are represented ad bar blot and mean ± SEM. (C) IFN-γ ELISpot was performed on harvested splenocytes from mice treated with Ad5/3Δ24, AdEpitopes or PBS (Mock). The individual response to TRP2 (pink) and Ad5/3Δ24 (green) is reported as IFN-γ spot forming cells (SFC)/106 splenocytes. (D) IL-10 FluoroSpot evaluated the level of IL-10 released upon stimulation with TRP2 (pink) and Ad5/3Δ24 (green) in splenocytes harvested from mice immunized with Ad5/3Δ24, AdEpitopes or PBS (Mock). (E) The ratio IFN-γ/IL-10 spot forming cells is depicted and TRP2 (pink) and Ad5/3Δ24 (green). The data are shown as bar and dot plot for each technical replicate, and mean ± SEM. Significance was assessed with ordinary One-way ANOVA (ns P > 0.05, *P ≤ 0.05, **P ≤ 0.01, ***P ≤ 0.001, ****P ≤ 0.0001).
Figure 6
Figure 6
PeptiCRAd elicited local and systemic antitumor response in a poor immunogenic tumor melanoma model. (A) Immunocompetent C57Bl/6 mice were subcutaneously injected with the syngeneic tumor model B16.F1 in the left (0.5x10⁴ cells) and right flank (1x10⁵). Ad5/3Δ24, AdEpitopes and PeptiCRAd were intratumorally administrated four times, two days apart starting from day 9. The B16F1 tumor growth was followed until the end of the experiment and the tumor size is presented as the mean ± SEM and statistically difference was assessed with two-way ANOVA; (ns P > 0.05, *P ≤ 0.05, **P ≤ 0.01, ***P ≤ 0.001, ****P ≤ 0.0001). (B–E) Single tumor growth for single mouse for Mock (B), Ad5/3Δ24 (C), AdEpitopes (D) and PeptiCRAd (E) is shown. A threshold of 431 mm3 was set to define the percentage of mice responding to the different therapies (red dotted line) for right and left tumors. The percentage of responders in each treatment group is shown on the top of the dotted line. The threshold was defined as the median of the tumor size at the last day of the experiment in Ad5/3Δ24 treated group. (Mock n=9, Ad5/3 Δ24n=9, AdEpitopes n= 9, PeptiCRAd n=8).
Figure 7
Figure 7
PeptiCRAd induced immune infiltration in distant not treated cancer lesions. (A) A representative gating strategy for the flow cytometry analysis of the untreated tumors is showed. (B–D) The immunological T cell profile was investigated in untreated lesions by flow cytometry. The frequency of CD8+ (B), of CD4+ (C) and CXCR3+ (CD8+) (D) T cells is shows. All the data are plotted as dot plot for each tumor and for each treatment group as mean± SEM. The significance was assessed by One way ANOVA and Tukey´s correction (ns P > 0.05, *P ≤ 0.05, **P ≤ 0.01, ***P ≤ 0.001, P ≤ 0.0001).

References

    1. Waldman AD, Fritz JM, Lenardo MJ. A Guide to Cancer Immunotherapy: From T Cell Basic Science to Clinical Practice. Nat Rev Immunol (2020) 20(11):651–68. doi: 10.1038/s41577-020-0306-5 - DOI - PMC - PubMed
    1. Chen DS, Mellman I. Oncology Meets Immunology: The Cancer-Immunity Cycle. Immunity (2013) 39(1):1–10. doi: 10.1016/j.immuni.2013.07.012 - DOI - PubMed
    1. Kumar AR, Devan AR, Nair B, Vinod BS, Nath LR. Harnessing the Immune System Against Cancer: Current Immunotherapy Approaches and Therapeutic Targets. Mol Biol Rep (2021) 48(68):1–21. doi: 10.1007/s11033-021-06752-9 - DOI - PMC - PubMed
    1. Melief CJ, van der Burg SH. Immunotherapy of Established (Pre)Malignant Disease by Synthetic Long Peptide Vaccines. Nat Rev Cancer (2008) 8(5):351–60. doi: 10.1038/nrc2373 - DOI - PubMed
    1. Rabu C, Rangan L, Florenceau L, Fortun A, Charpentier M, Dupre E, et al. . Cancer Vaccines: Designing Artificial Synthetic Long Peptides to Improve Presentation of Class I and Class II T Cell Epitopes by Dendritic Cells. Oncoimmunology (2019) 8(4):e1560919. doi: 10.1080/2162402X.2018.1560919 - DOI - PMC - PubMed