. 2022 Apr 14:13:823910.
doi: 10.3389/fimmu.2022.823910. eCollection 2022.

Immune Gene Signatures and Immunotypes in Immune Microenvironment Are Associated With Glioma Prognose

Affiliations

Immune Gene Signatures and Immunotypes in Immune Microenvironment Are Associated With Glioma Prognose

Xiang-Xu Wang et al. Front Immunol. .

Abstract

Glioma is the most common primary malignant brain tumor in adults with very poor prognosis. The limited new therapeutic strategies for glioma patients can be partially attributed to the complex tumor microenvironment. However, knowledge about the glioma immune microenvironment and the associated regulatory mechanisms is still lacking. In this study, we found that, different immune subtypes have a significant impact on patient survival. Glioma patients with a high immune response subtype had a shorter survival compared with patients with a low immune response subtype. Moreover, the number of B cell, T cell, NK cell, and in particular, the macrophage in the immune microenvironment of patients with a high immune response subtype were significantly enhanced. In addition, 132 genes were found to be related to glioma immunity. The functional analysis and verification of seven core genes showed that their expression levels were significantly correlated with the prognosis of glioma patients, and the results were consistent at tissue levels. These findings indicated that the glioma immune microenvironment was significantly correlated with the prognosis of glioma patients and multiple genes were involved in regulating the progression of glioma. The identified genes could be used to stratify glioma patients based on immune subgroup analysis, which may guide their clinical treatment regimen.

Keywords: glioma; immune microenvironment; immunotherapy; immunotype; macrophages.


Conflict of interest statement

The authors declare that the research was conducted in the absence of any commercial or financial relationships that could be construed as a potential conflict of interest.

Figures

Figure 1
Figure 1
Identification of three immunity-subgroups base on 25 immunity-related gene sets. (A) The heatmap showing the glioma samples divided into three distinct sub-group based on the GSVA enrichment scores of 25 immunity-related gene sets. Three subgroups defined as immunity-H, immunity-M and immunity-L. Color bars at the top of the graph labels, the gender, grade, histology, PRS type. (B–E) Comparison of stromal scores (B), immune scores (C), estimated scores (D), tumor purity (E) among three immunity-subgroups. (F) PCA analyses for three immunity-subgroups depicted by the dot in different colors. immunity-H, pink, immunity-M, blue; immunity-L, aquamarine. (G) OS Kaplan-Meier survival analysis among three immunity-subgroups (Log-rank test).
Figure 2
Figure 2
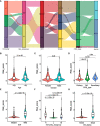
Association analysis and risk score comparison of clinical features of glioma. (A) Alluvial diagram of immunity-sub-groups with different risk-subgroups, IDH status, grade stages, PRS types and survival status. (B–G) The risk score comparison between different clinical features. (B) Age, (C) Gender, (D) PRS type, (E) IDH status, (F) immunity-subgroup and (G) survival status.
Figure 3
Figure 3
The enrichment molecular pathways and immune cells infiltration among three immunity-subgroups of glioma. (A, B) Heatmap shows the GSVA score of top 10 KEGG pathways (A) and 50 hallmarks pathways (B) curated from MSigDB between immunity-H and immunity-L subtypes. (C) The abundance of each 22 types of infiltrating cell in three immunity-subtypes. *P≤0.05, **P≤0.01, ***P≤0.001. ns, no significance.
Figure 4
Figure 4
The immune cells infiltration among three grades of glioma. (A) Flow cytometry results showed the abundance of each 6 types of infiltrating cell in three grades and (B) the results of statistical analysis showed the proportion of cell infiltration.*P≤0.05, **P≤0.01, ***P≤0.001. ns, no significance.
Figure 5
Figure 5
Volcano plot, heatmap and GO enrichment analysis of differential gene among three glioma immune subtype. (A) The volcano plot of different genes between immunity-H and immunity-L subtype. (B) The Venn plot showed the different genes among three glioma immune subtype. (C) The heatmap shown that the different genes among three glioma immune subtype. (D) GO enrichment analysis of differential gene among between immunity-H and immunity-L subtypes.
Figure 6
Figure 6
Construction of a prognostic model based on differential genes of immune subtypes. (A) The LASSO coefficients profile of the 132 significate genes selected for overall survival against the log lambda sequence. (B) Ten-fold cross-validated error (first vertical line equals the minimum error, whereas the second vertical line shows the cross-validated error within 1 standard error of the minimum). (C) Forest plot of 7 immunity-subtype-related genes identified by multivariate Cox regression. (D) Glioma patients are sorted by risk score, red is high risk, green is low risk. (E) The survival status of Glioma patients, dark blue is dead, light green is alive. (F) The heatmap of the 7-hub gene expression. (G) Kaplan–Meier curve survival analysis between high risk and low risk, red line means high risk group, blue line means low risk group; (H) Time–ROC curve analysis of the 7 hub genes signature, red line means 1-year OS, green line means 2-year OS, blue line means 3-year DFS, purple line means 3-year DFS.
Figure 7
Figure 7
Univariate Cox Forest plot and Kaplan–Meier survival analysis of 7 hub genes in CGGA cohort. (A) Univariate Cox Forest plot of 7 immunity-subtype-related genes. (B) Kaplan–Meier curve survival analysis of 7 hub genes, (B) SVOP, (C) TNR, (D) VAMP5, (E) IGFBP2, (F) METTL7N, (G) VIM, (H) TAGLN2.
Figure 8
Figure 8
The 7 core prognostic genes of glioma are significantly related to immune cells infiltration and GEP genes. (A) The correlation between 7 prognostic hub genes and 22 immune cells infiltration. (B) The correlation between 7 prognostic hub genes and 18 GEP expression. *P≤0.05, **P≤0.01.
Figure 9
Figure 9
Functional validation of 7 hub genes in clinical specimens. (A) WB assay was used to detect the expression differences of 7 core genes in glioma tissues and adjacent tissues. (B–H) Immunohistochemical staining and statistical analysis of tumor and adjacent tissues in patients with glioma, and Kaplan-Meier curve analysis of overall survival in glioma patients by the expression of 7 core genes. Death/total number of patients in each subgroup were presented. (P, paracancerous; C, cancer). *P≤0.05, **P≤0.01, ***P≤0.001. ns, no significance.

Similar articles

Cited by

References

    1. Ilkhanizadeh S, Lau J, Huang M, Foster DJ, Wong R, Frantz A, et al. . Glial Progenitors as Targets for Transformation in Glioma. Adv Cancer Res (2014) 121:1–65. doi: 10.1016/B978-0-12-800249-0.00001-9 - DOI - PMC - PubMed
    1. Yuan L, Shen J, Chen Z. Catalytic Ozonation of P-Chloronitrobenzene Over Pumice-Supported Zinc Oxyhydroxide. Water Sci Technol (2013) 68(8):1895–900. doi: 10.2166/wst.2013.449 - DOI - PubMed
    1. Stupp R, Brada M, van den Bent MJ, Tonn JC, Pentheroudakis G. High-Grade Glioma: ESMO Clinical Practice Guidelines for Diagnosis, Treatment and Follow-Up. Ann Oncol (2014) 25(Suppl 3):iii93–101. doi: 10.1093/annonc/mdu050 - DOI - PubMed
    1. Tan AC, Ashley DM, Lopez GY, Malinzak M, Friedman HS, Khasraw M. Management of Glioblastoma: State of the Art and Future Directions. CA Cancer J Clin (2020) 70(4):299–312. doi: 10.3322/caac.21613 - DOI - PubMed
    1. Tong N, He Z, Ma Y, Wang Z, Huang Z, Cao H, et al. . Tumor Associated Macrophages, as the Dominant Immune Cells, Are an Indispensable Target for Immunologically Cold Tumor-Glioma Therapy? Front Cell Dev Biol (2021) 9:706286. doi: 10.3389/fcell.2021.706286 - DOI - PMC - PubMed