. 2022 Apr 14:13:842605.
doi: 10.3389/fimmu.2022.842605. eCollection 2022.

Non-Muscle Myosin II Is Essential for the Negative Regulation of B-Cell Receptor Signaling and B-Cell Activation

Affiliations

Non-Muscle Myosin II Is Essential for the Negative Regulation of B-Cell Receptor Signaling and B-Cell Activation

Margaret K Seeley-Fallen et al. Front Immunol. .

Abstract

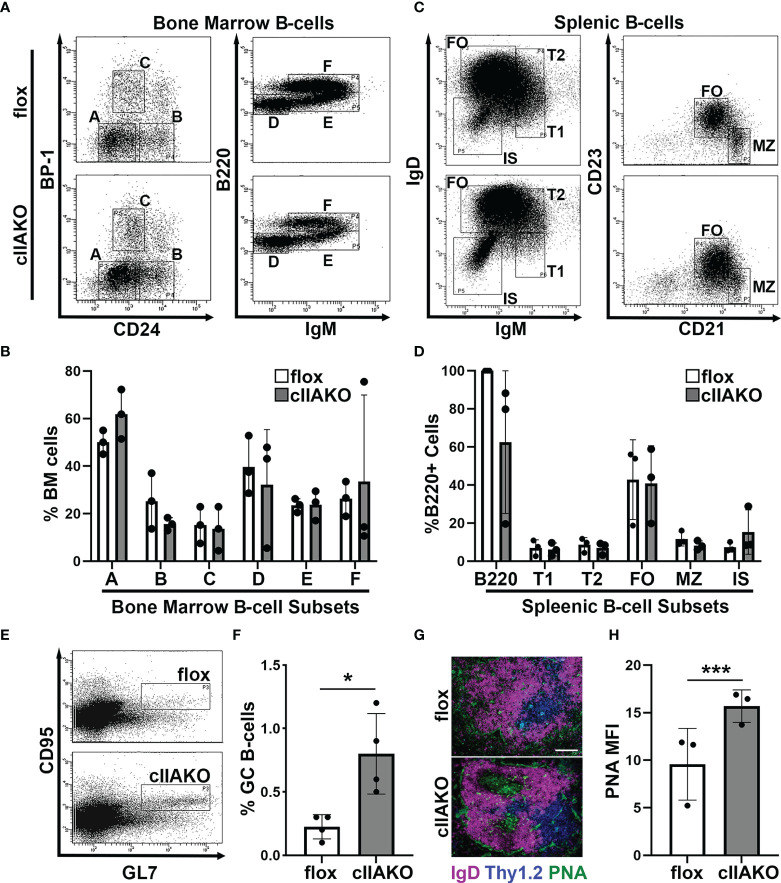
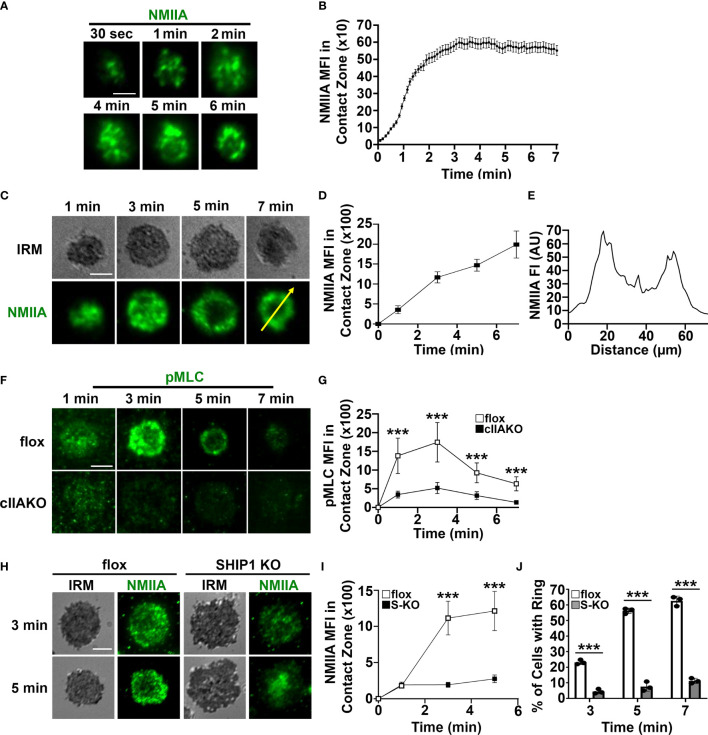
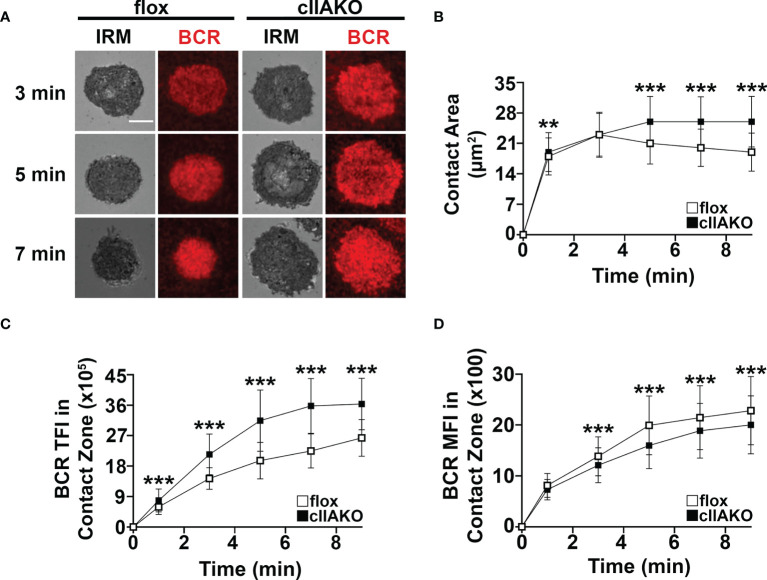
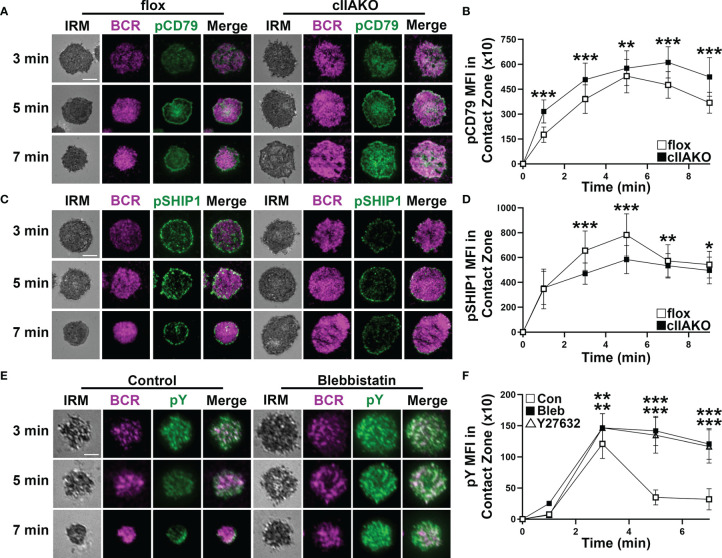
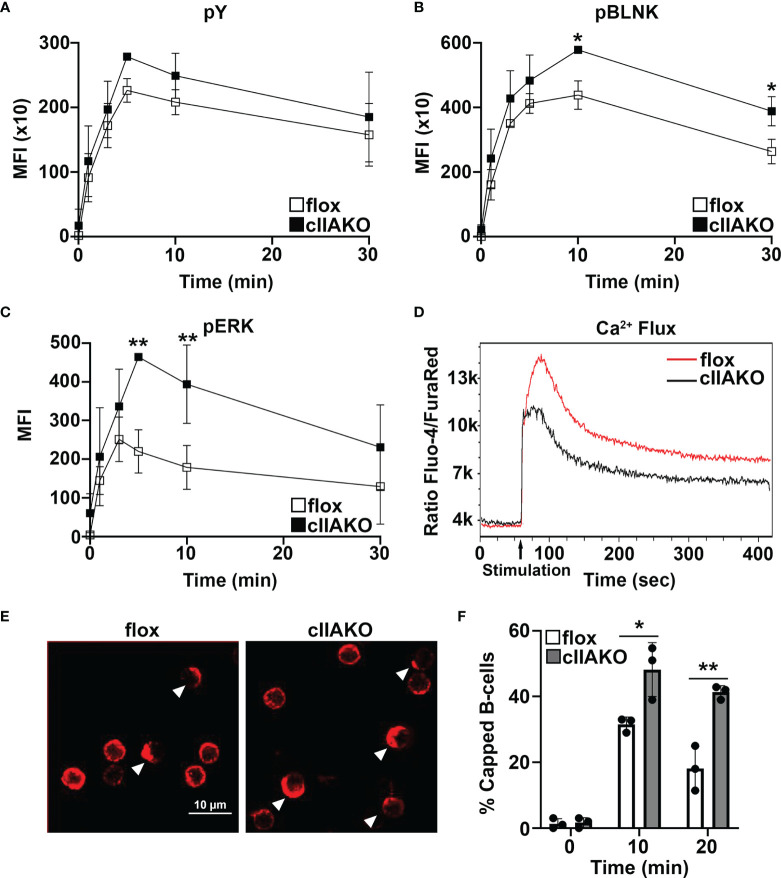
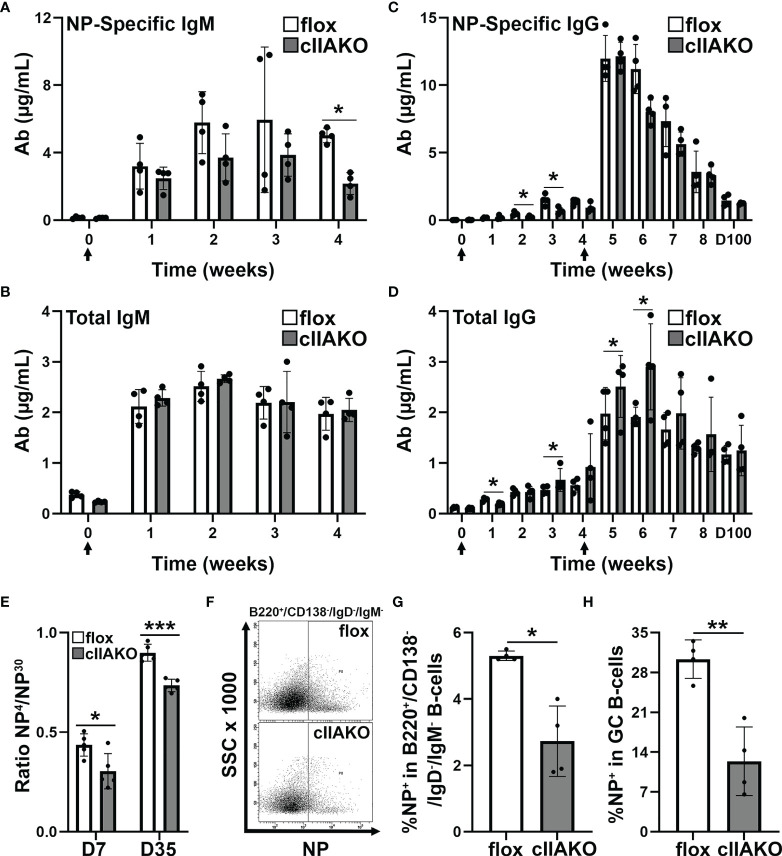
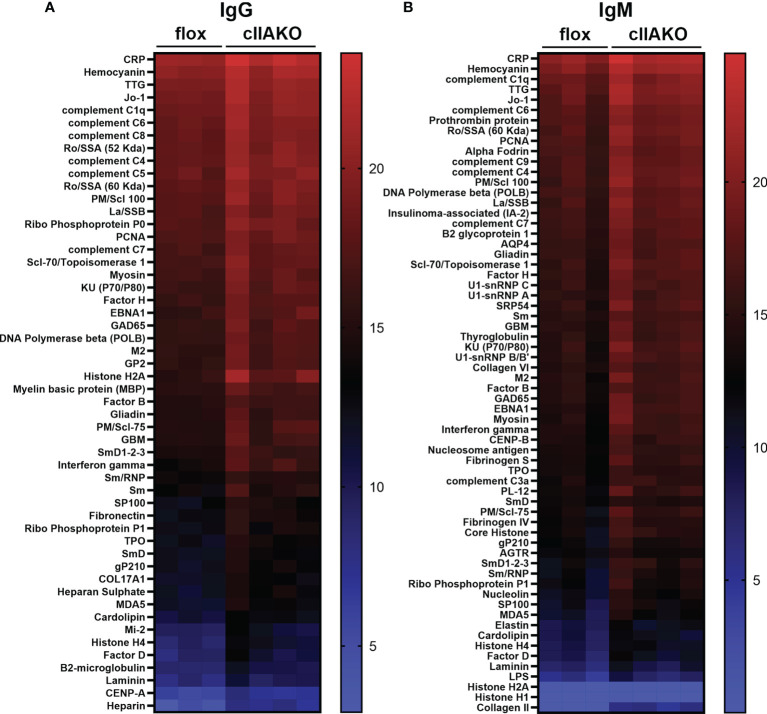
Antigen (Ag)-triggered B-cell receptor (BCR) signaling initiates antibody responses. However, prolonged or uncontrolled BCR signaling is associated with the development of self-reactive B-cells and autoimmune diseases. We previously showed that actin-mediated B-cell contraction on Ag-presenting surfaces negatively regulates BCR signaling. Non-muscle myosin II (NMII), an actin motor, is involved in B-cell development and antibody responses by mediating B-cell migration, cytokinesis, and Ag extraction from Ag-presenting cells. However, whether and how NMII regulates humoral responses through BCR signaling remains elusive. Utilizing a B-cell-specific, partial NMIIA knockout (cIIAKO) mouse model and NMII inhibitors, this study examined the role of NMII in BCR signaling. Upon BCR binding to antibody-coated planar lipid bilayers (PLB), NMIIA was recruited to the B-cell contact membrane and formed a ring-like structure during B-cell contraction. NMII recruitment depended on phosphatidylinositol 5-phosphatase (SHIP1), an inhibitory signaling molecule. NMII inhibition by cIIAKO did not affect B-cell spreading on PLB but delayed B-cell contraction and altered BCR clustering. Surface BCR "cap" formation induced by soluble stimulation was enhanced in cIIAKO B-cells. Notably, NMII inhibition by cIIAKO and inhibitors up-regulated BCR signaling in response to both surface-associated and soluble stimulation, increasing phosphorylated tyrosine, CD79a, BLNK, and Erk and decreasing phosphorylated SHIP1. While cIIAKO did not affect B-cell development, the number of germinal center B-cells was significantly increased in unimmunized cIIAKO mice, compared to control mice. While cIIAKO mice mounted similar antibody responses when compared to control mice upon immunization, the percentages of high-affinity antibodies, Ag-specific germinal center B-cells and isotype switched B-cells were significantly lower in cIIAKO mice than in control mice. Furthermore, autoantibody levels were elevated in cIIAKO mice, compared to control mice. Collectively, our results reveal that NMII exerts a B-cell-intrinsic inhibition on BCR signaling by regulating B-cell membrane contraction and surface BCR clustering, which curtails the activation of non-specific and self-reactive B-cells.

Keywords: B lymphocytes; B-cell receptor; actin cytoskeleton; antibody response; non-muscle myosin II; signal transduction.


Conflict of interest statement

The authors declare that the research was conducted in the absence of any commercial or financial relationships that could be construed as a potential conflict of interest.

Figures

Figure 1
Figure 1
CD19 Cre-driven non-muscle myosin IIA knockout (cIIAKO) increases spontaneous germinal center (GC) B-cells without affecting B-cell development. (A–D) B-cell development in cIIAKO and floxed control mice. Cells from the bone marrow (A, B) and spleens (C, D) of floxed control and cIIAKO mice were labeled for surface markers of pre-pro- (A), pro- (B), early pre- (C), late pre- (D), immature (E) and re-circulating mature B-cells (F) in the bone marrow, and transitional 1 (T1), transitional 2 (T2), follicular (FO), marginal zone (MZ) and isotype switched (IS) B-cells in the spleen, and analyzed by flow cytometry. Shown are representative dot plots (A, C), the average percentages (± SD) of total cells extracted from bone marrow (B), and the average percentages (± SD) of total B220+ B-cells from the spleen (D). (E, F) GC B-cells. Splenocytes from unimmunized mice were stained for B220, followed by the GC B-cell markers CD95 and GL7 and analyzed by flow cytometry. Shown are representative dot plots (E) and quantification of the mean percentage (± SD) of GC B-cells among total B220 B-cells by flow cytometry (F). (G) Immunofluorescent staining of splenic sections from cIIAKO and floxed control mice (6-8 week old). Shown are representative follicles. Scale bar, 100 μm. (H) PNA MFI (± SD) in GCs per field of view (~5 images per 12 sections from each of 3 floxed control or cIIAKO mice). Data points represent individual mice (B, D, F, H). n=3~4. *p<0.05, ***p<0.001.
Figure 2
Figure 2
Activated NMIIA is recruited to the B-cell contact zone following BCR activation. B-cells isolated from GFP-NMIIA transgenic mice, WT mice, cIIAKO, SHIP1 KO, and floxed control mice were incubated with Fab’-PLB. (A) Representative time-lapse images of GFP-NMIIA B-cells acquired using TIRF. (B) The averages (± SD) of GFP-NMIIA MFI in the contact zone of individual B-cells were plotted versus time (>30 cells from 3 mice). (C) Activated WT B-cells were fixed at different times, stained for NMIIA, and analyzed using IRM and TIRF. Shown are representative images. (D) The averages (± SD) of NMIIA MFI in the B-cell contact zone of individual cells were plotted versus time (>30 cells from 3 mice for each time point). (E) The fluorescence intensity (FI) of NMIIA staining across the yellow line in the cell at 7 min in (C). (F) Activated floxed control and cIIAKO B-cells were fixed at indicated times and stained for pMLC and analyzed by TIRF. Shown are representative images. (G) The averages (± SD) of pMLC MFI in the contact zone of individual B-cells were plotted versus time (>50 cells from 3 mice for each time point). (H) Activated floxed control and SHIP1 KO (S-KO) B-cells were fixed at indicated times, stained for NMIIA, and analyzed by IRM and TIRF. Shown are representative images. (I) The averages (± SD) of NMIIA MFI in the contact zone of individual cells were plotted versus time. (J) The average percentages (± SD) of floxed control and S-KO B-cells exhibiting NMIIA ring-like structures at indicated times (>50 cells from 3 mice for each time point). Scale bar, 5 µm. ***p<0.001.
Figure 3
Figure 3
cIIAKO inhibits B-cell contraction and alters BCR clustering in the contact zone. B-cells isolated from floxed control and cIIAKO mice were incubated with Fab’-PLB, fixed at different times, and imaged using IRM and TIRF. Shown are representative IRM and TIRF images of the B-cell contact area and Fab’-engaged BCRs (A). The average contact area (± SD) of individual cells over time was measured using IRM Images (B). The averages (± SD) of Fab’-BCR TFI (C) and MFI (D) in the contact zone of individual cells over time were measured using TIRF images. >50 cells from 3 mice per time point. Scale bar, 5 µm. **p<0.01, ***p<0.001.
Figure 4
Figure 4
NMIIA inhibition enhances BCR signaling in the B-cell contact zone. (A–D) Floxed control and cIIAKO B-cells were incubated with Fab’-PLB for indicated times, fixed, permeabilized, stained for phosphorylated CD79a (pCD79a) (A, B) or phosphorylated SHIP1 (pSHIP1) (C, D), and analyzed by IRM and TIRF. Shown are representative IRM and TIRF images of B-cell contact area and pCD79a (A) and pSHIP1 staining (C) and the averages (± SD) of pCD79a (B) or pSHIP1 (D) MFI in the contact zone of individual cells measured using TIRF images over time. (E, F) WT B-cells untreated or treated with Bleb or Y27632 were incubated with Fab’-PLB, fixed, permeabilized, stained for phosphorylated tyrosine (pY), and analyzed by IRM and TIRF. Shown are representative images (E) and the averages (± SD) of pY MFI in the contact zone of individual cells measured using TIRF images over time (F). >50 cells from 3 mice per time point per condition. Scale bar, 5 µm. *p<0.05, **p<0.01, ***p<0.001.
Figure 5
Figure 5
BCR signaling and BCR capping are enhanced in cIIAKO B-cells in response to soluble stimulation. (A–C) B-cells from floxed control and cIIAKO mice were activated with F(ab’)2 goat anti-mouse IgG+M for indicated times, fixed, permeabilized, labeled for pY (A), pBLNK (B), and pErk (C), and analyzed by flow cytometry. Shown are the average MFI (± SD) of three independent experiments. (D) Representative histograms of Ca2+ flux in floxed control and cIIAKO B-cells activated with F(ab’)2 goat anti-mouse IgG+M by flow cytometry. (E, F) Representative confocal images of activated floxed control and cIIAKO B-cells showing BCR capping at 10 min (E) and the average percentages (± SD) of B-cells with BCR capping at indicated times (F). Scale bar, 10 µm. n=3. *p< 0.05, **p<0.01.
Figure 6
Figure 6
B-cell affinity maturation is impaired in cIIAKO mice. (A–D) 6~8 weeks old floxed control and cIIAKO mice (n=4) were immunized with NP-KLH in Sigma Adjuvant System on day 0 and boosted on day 28. NP-specific IgM (A), total IgM (B), NP-specific IgG (C), and total IgG (D) in the serum were determined by ELISA (mean µg/ml, ± SD). (E) Relative affinity of NP-specific IgG 7 and 35 days post NP-KLH immunization was assessed as ratios of IgG bound to NP4- versus NP30-BSA by ELISA (± SD, n=4~5). (F–H) Splenic cells from floxed control and cIIAKO mice 72 days post second immunization were stained for NP binding, B220, CD138, IgM, and IgD, or CD95 and GL-7, and analyzed by flow cytometry (F). Percentages of NP+/B220+/CD138-/IgM-/IgG- cells (G) and NP+/B220+/CD95+/GL-7+ B-cells (H) were quantified as Ag-specific isotype switched and GC B-cells, respectively. Data points represent individual mice. n=4. *p<0.05, **p<0.01, ***p<0.001.
Figure 7
Figure 7
Autoantibody production was elevated in cIIAKO mice compared to floxed control mice. Autoreactive IgG (A) and IgM (B) in the sera of unimmunized 12 months old floxed control and cIIAKO mice (n=3-4) were screened using autoantigen arrays. Autoantibodies were detected with fluorescent antibodies for either mouse IgG or IgM. The net fluorescent intensity (NFI) and signal-to-noise ratio (SNR) were calculated for each autoantigen. NFI and SNR were used to calculate Ab scores, then filtered antibody scores (whose percent of SNR>3 across all samples is less than 10) were used for analysis. Shown are heatmaps, where each row represents an autoantigen and each column represents a serum sample from a mouse. The red color represents the highest filtered Ab score, while the blue represents the lowest filtered Ab-scores. Filtered Ab scores were sorted from largest to smallest mean filtered Ab score. Only autoantibodies with statistically significant different filtered Ab-scores between cIIAKO and floxed control mice are shown. p ≤ 0.05.

Similar articles

Cited by

References

    1. Reth M, Wienands J. Initiation and Processing of Signals From the B Cell Antigen Receptor. Annu Rev Immunol (1997) 15:453–79. doi: 10.1146/annurev.immunol.15.1.453 - DOI - PubMed
    1. Dal Porto JM, Gauld SB, Merrell KT, Mills D, Pugh-Bernard AE, Cambier J. B Cell Antigen Receptor Signaling 101. Mol Immunol (2004) 41(6-7):599–613. doi: 10.1016/j.molimm.2004.04.008 - DOI - PubMed
    1. Kwak K, Akkaya M, Pierce SK. B Cell Signaling in Context. Nat Immunol (2019) 20(8):963–9. doi: 10.1038/s41590-019-0427-9 - DOI - PubMed
    1. Shlomchik MJ, Luo W, Weisel F. Linking Signaling and Selection in the Germinal Center. Immunol Rev (2019) 288(1):49–63. doi: 10.1111/imr.12744 - DOI - PMC - PubMed
    1. Kurosaki T, Shinohara H, Baba Y. B Cell Signaling and Fate Decision. Annu Rev Immunol (2010) 28:21–55. doi: 10.1146/annurev.immunol.021908.132541 - DOI - PubMed

Publication types

LinkOut - more resources