Review
. 2021 Oct 5;11(52):32750-32774.
doi: 10.1039/d1ra04890b. eCollection 2021 Oct 4.

Biomedical nanobubbles and opportunities for microfluidics

Affiliations
Review

Biomedical nanobubbles and opportunities for microfluidics

Ali A Paknahad et al. RSC Adv. .

Abstract

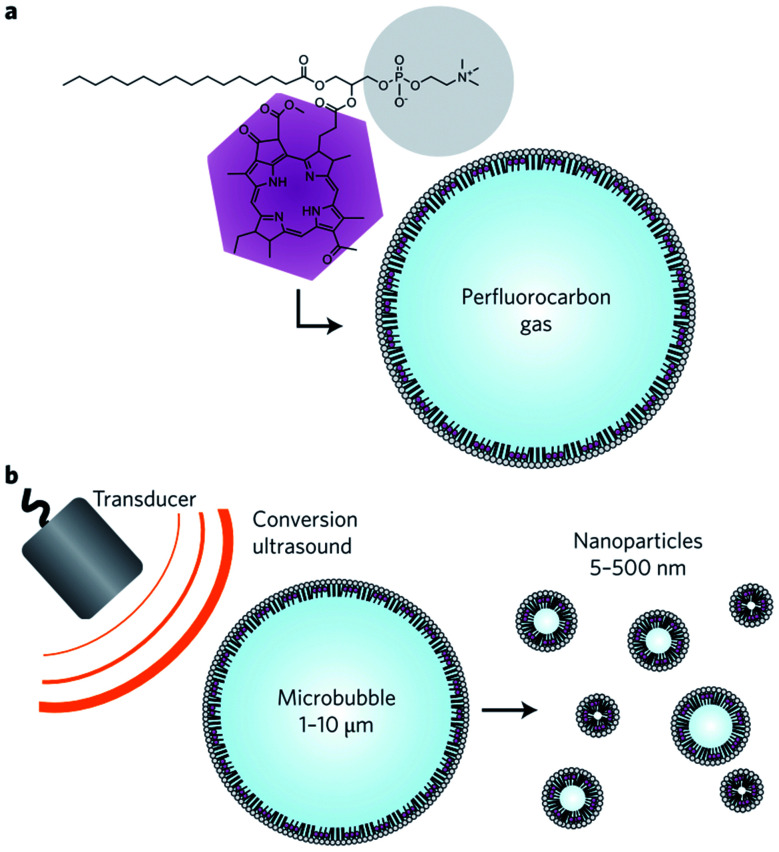
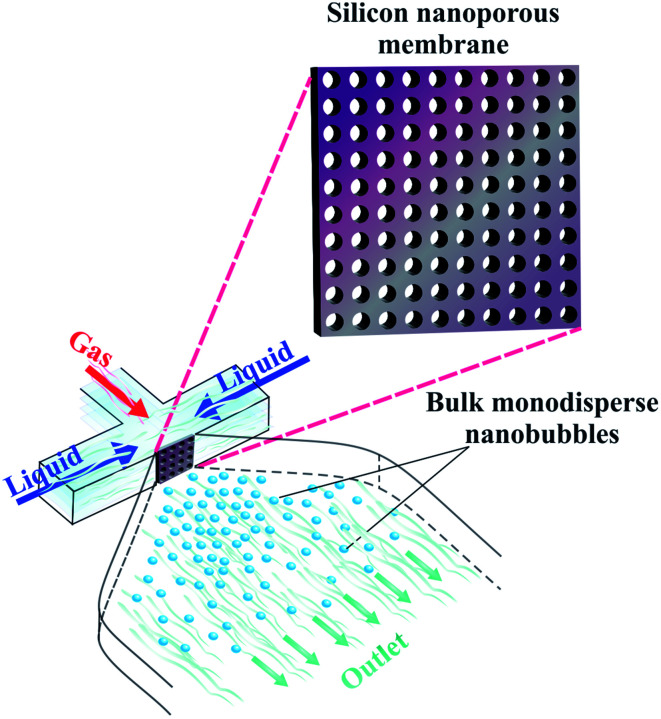
The use of bulk nanobubbles in biomedicine is increasing in recent years, which is attributable to the array of therapeutic and diagnostic tools promised by developing bulk nanobubble technologies. From cancer drug delivery and ultrasound contrast enhancement to malaria detection and the diagnosis of acute donor tissue rejection, the potential applications of bulk nanobubbles are broad and diverse. Developing these technologies to the point of clinical use may significantly impact the quality of patient care. This review compiles and summarizes a representative collection of the current applications, fabrication techniques, and characterization methods of bulk nanobubbles in biomedicine. Current state-of-the-art generation methods are not designed to create nanobubbles of high concentration and low polydispersity, both characteristics of which are important for several bulk nanobubble applications. To date, microfluidics has not been widely considered as a tool for generating nanobubbles, even though the small-scale precision and real-time control offered by microfluidics may overcome the challenges mentioned above. We suggest possible uses of microfluidics for improving the quality of bulk nanobubble populations and propose ways of leveraging existing microfluidic technologies, such as organ-on-a-chip platforms, to expand the experimental toolbox of researchers working to develop biomedical nanobubbles.


Conflict of interest statement

The authors declare no conflict of interest.

Figures

Fig. 1
Fig. 1. Lifetime of a bubble smaller than 1000 nm predicted by the theory of Epstein and Plesset. The graph depicts the calculated radius of a nitrogen-filled bubble in a nitrogen saturated solution versus time (T = 300 K, γ = 0.072 J m−2, D = 2.0 × 10⁻⁹ m2 s−1, Csat = 0.6379 mol m−3, ρ1 atm = 40.6921 mol m−3).
Fig. 2
Fig. 2. Ultrasound time–intensity curves (TIC) from myocardial contrast echocardiography of allografts and isografts imaged with functionalized and non-functionalized nanobubbles. (A, C, and E) show TIC for isografts at 2, 4, and 6 days post transplantation, respectively. (B, D, and F) show TIC for allografts at 2, 4, and 6 days post transplantation, respectively. Note the delayed intensity peak in for allografts imaged with functionalized nanobubbles.
Fig. 3
Fig. 3. Schematic diagram depicting the pore formation and delivery of fluids and macromolecules in the cell membrane. (a) Non-inertial cavitation causing pushing and pulling behaviour along the cell membrane due to the expansion and compression of bubbles. (b) Inertial cavitation collapsing the bubble, rupturing the cell membrane and creating a transient pore. (c) Transmembrane fluid and macromolecules, including plasmid DNA and oligonucleotides, transported by nano/microbubbles travelling into cells through a transient pore.
Fig. 4
Fig. 4. Preparation and use of nanobubble-GP3-rGO functionalized nanobubbles for NIR photothermal ablation of HCC.
Fig. 5
Fig. 5. Comparison of tumour cell viability from different treatment methods tested. The combined therapy with NIR laser + ultrasound + functionalized nanobubbles yielded the best results, with a 72 hour cell viability of 2.26%.
Fig. 6
Fig. 6. An embedded microchannel in a silicon microcantilever. The circled section highlights the tip of the microcantilever where the sensitivity is maximum.
Fig. 7
Fig. 7. Diagram illustrating the principle of NTA measurements using the Stokes–Einstein equation. Particles are illuminated by a laser light and movements of the particles are recorded through the scattered light via a CCD by a microscope. The software tracks the Brownian motion of each particle by determining the diffusion coefficient, and then calculates the size as the mean square of the particle path using the Stokes–Einstein equation.
Fig. 8
Fig. 8. Polydisperse nanobubbles functionalized with Cy3-labeled cell-penetrating peptide (CPP) and FITC-labeled epidermal growth factor receptor-targeted small interfering RNA (siEGFR), fabricated using the lipid film hydration agitation method for gene therapy of triple negative breast cancer. (A) Nanobubbles fluorescing red, indicating effective loading of the CPPs in the bubble shell. (B) The same nanobubbles fluorescing green, indicating effective loading of the siEGFR in the bubble shell.
Fig. 9
Fig. 9. Baffled high-intensity agitation (BHIA) cell used by Wu et al. to generate bulk nanobubbles. After introducing the solution into a baffled cell, the rotating impeller connected to a high-speed agitator creates hydrodynamic cavitation leading to the generation of bulk nanobubbles. Valves 1 and 2 are used to take samples for the characterization of the generated bulk nanobubbles. The thumbscrews are placed to tightly seal the cap cell to the cell body.
Fig. 10
Fig. 10. The generation of bulk nanobubbles in a semi-continuous system using a centrifugal multiphase pump (CMP). Atmospheric air is injected into the CMP (item 4 in the figure) and passed through the pump impellers. The impeller's shear forces cause a multiphasic (air/liquid) flow, which is then subjected to different operating pressures to saturate the air in the water. Then, the saturated water is forced through the needle valve (item 9) for bubble generation through hydrodynamic cavitation.
Fig. 11
Fig. 11. The experimental setup with the integration of a Y-type microfluidic cell used by Nirmalkar et al. for the generation of bulk nanobubbles.
Fig. 12
Fig. 12. Pressure vessel rig used for creation of surface electrostatics nanobubbles. (A) Cross section of the pressure vessel that include the gas supplier, distribution terminal the pressure cell and the temperature regulation jacket. (B) DC current supply set up via sheath covered wires in a 3 dimensional printed plastic.
Fig. 13
Fig. 13. The schematic illustration of four different steps for bulk nanobubbles creation through microvortices and graphene oxide sheets. In the first step (nucleation step), gas supersaturation nucleation caused by two miscible solvents with different gas solubility forms nanobubbles on a graphene sheet (growth step). Warm water and cold nitrogen saturated NaCl are the mentioned solvents. In the growth step, nanobubbles on the surface of the graphene sheet grow until reaching their critical size and detach from the surface (detachment step) and form bulk nanobubbles inside the solution (bulk and surface nanobubbles step).
Fig. 14
Fig. 14. Shirasu-porous-glass (SPG) membrane used to produce bulk nanobubbles. The process starts by pumping a solution consists of water and sodium dodecyl sulphate (SDS) from the water phase storage tank into the membrane module. Then, the compressed air is purged into the membrane through the membrane holes to form bulk nanobubbles inside the membrane. Then, the produced bulk nanobubbles are collected in the storage tank. A flowmeter, a pressure gauge, and a laser diffraction particle size analyzer are used to measure the flow of the water-SDS solution, air pressure, and size of the generated nanobubbles, respectively.
Fig. 15
Fig. 15. Ultrasonic irradiation apparatus that are used for generation of bulk nanobubbles. (a) Langevin transducer controlled by a signal generator attached to stainless-steel vibration plates. (b) Illustration of the generation of bulk nanobubbles.
Fig. 16
Fig. 16. Bulk nanobubbles generation via fragmentation of microbubbles. (a) A microbubble consists of bacteriochlorophyll–lipid and perfluorocarbon gas. (b) Production of bulk nanobubbles through applying low-frequency ultrasound to the bacteriochlorophyll–lipid shell microbubbles.
Fig. 17
Fig. 17. Production of bulk nanobubbles through the electrolysis technique. An electrolyte solution passes from a filter with 100 nm holes before being merged with gas (O2 or N2) in the tank. Then, the mixed solution with gas in the tank transports to the chamber where the electrodes are placed. The electric current passing from the electrode anode to the cathode electrode electrolyzes the water inside the chamber.
Fig. 18
Fig. 18. Schematic of the experimental setup to form bulk nanobubbles via plasma generation in a specific volume of water. The plasma forms between the electrode tip placed in the water and the grounded electrode after turning on the high-voltage power supply.
Fig. 19
Fig. 19. (a) Microscopic image of a microfluidic flow focusing geometry with a 3D expansion, illustrating the atomization-like production of microbubbles, and fine-spray production of nanoparticles. (b) Histogram depicting an optically counted concentration distribution of particles, reported by Peyman et al. The optical limit of 0.75 μm is reached within the green shaded region.
Fig. 20
Fig. 20. A microfluidic nanobubble generator that is recently reported by our group. (a) Top-view schematic diagram of the microfluidic chip, showing liquid (lipid solution), gas and reservoir inlets. The serpentine structure of the design facilitates the tracking of microbubble shrinkage into nanobubbles by a microscope. (b) The flow-focusing section of the microfluidic chip to generate monodisperse microbubbles. The width and length of the orifice are 20 μm and 100 μm, respectively. Following the generation of the microbubbles, the shrinkage process begins with the entry of the microbubbles into the serpentine microchannel. The width of this microchannel is 350 μm, and the height of all channels in the device is 50 μm. (c) The gradual outflow of nitrogen from the cores of microbubbles and dissolution into the aqueous phase leads to microbubble shrinkage. In contrast, C3F8 remains inside the bubble's core due to its low solubility. (d) Three different samples are taken from the reservoir inlet. Sample 1 is the control group consisting of lipid solution, and samples 2 and 3 contain bulk nanobubbles with mean diameters of 100 nm and 200 nm, respectively.
Fig. 21
Fig. 21. Top-view schematic diagram of a planar flow focusing design to produce bubbles.
Fig. 22
Fig. 22. Microbubble production by flow focusing. (a) A schematic drawing, and (b) microscopic image of flow focusing geometries. In (a), QD, QC, and Wup represent the gas flow rate, liquid flow rate, and distance between the device wall and the gas channel, respectively. In (b), the orifice width, the gas flow channel width, and the junction-to-orifice distance is shown by WOR, 2a, and ΔZ, respectively.
Fig. 23
Fig. 23. Generation of bulk microbubbles through (a) flow-focusing technique in a microfluidic device and (b) replacing the PDMS substrate with silicone and reducing the orifice width to achieve bulk nanobubbles.
Fig. 24
Fig. 24. Production of bulk monodisperse nanobubbles via an embedded silicone nanoporous membrane in a PDMS microfluidic chip.

References

    1. Johnson B. D. Cooke R. C. Generation of stabilized microbubbles in seawater. Science. 1981;213(4504):209–211. doi: 10.1126/science.213.4504.209. - DOI - PubMed
    1. Yin T. Wang P. Zheng R. Zheng B. Cheng D. Zhang X. et al., Nanobubbles for enhanced ultrasound imaging of tumors. Int. J. Nanomed. 2012;7:895–904. - PMC - PubMed
    1. Attard P. Moody M. P. Tyrrell J. W. G. Nanobubbles: The big picture. Phys. Stat. Mech. Appl. 2002;314(1–4):696–705. doi: 10.1016/S0378-4371(02)01191-3. - DOI
    1. Zhu J. An H. Alheshibri M. Liu L. Terpstra P. M. J. Liu G. et al., Cleaning with bulk nanobubbles. Langmuir. 2016;32(43):11203–11211. doi: 10.1021/acs.langmuir.6b01004. - DOI - PubMed
    1. Meegoda J. N. Aluthgun Hewage S. Batagoda J. H. Stability of nanobubbles. Environ. Eng. Sci. 2018;35(11):1216–1227. doi: 10.1089/ees.2018.0203. - DOI