. 2022 Jun 15:196:111258.
doi: 10.1016/j.measurement.2022.111258. Epub 2022 Apr 26.

Development of novel spectroscopic and machine learning methods for the measurement of periodic changes in COVID-19 antibody level

Affiliations

Development of novel spectroscopic and machine learning methods for the measurement of periodic changes in COVID-19 antibody level

Zozan Guleken et al. Measurement (Lond). .

Abstract

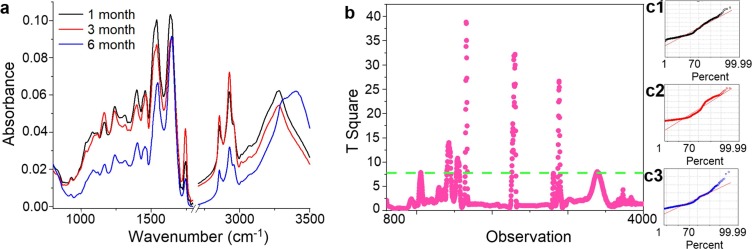
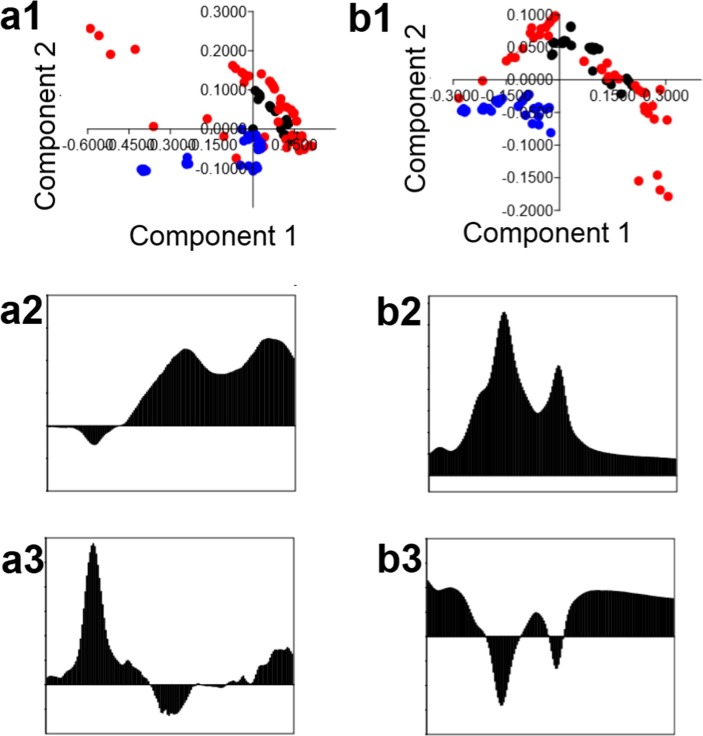
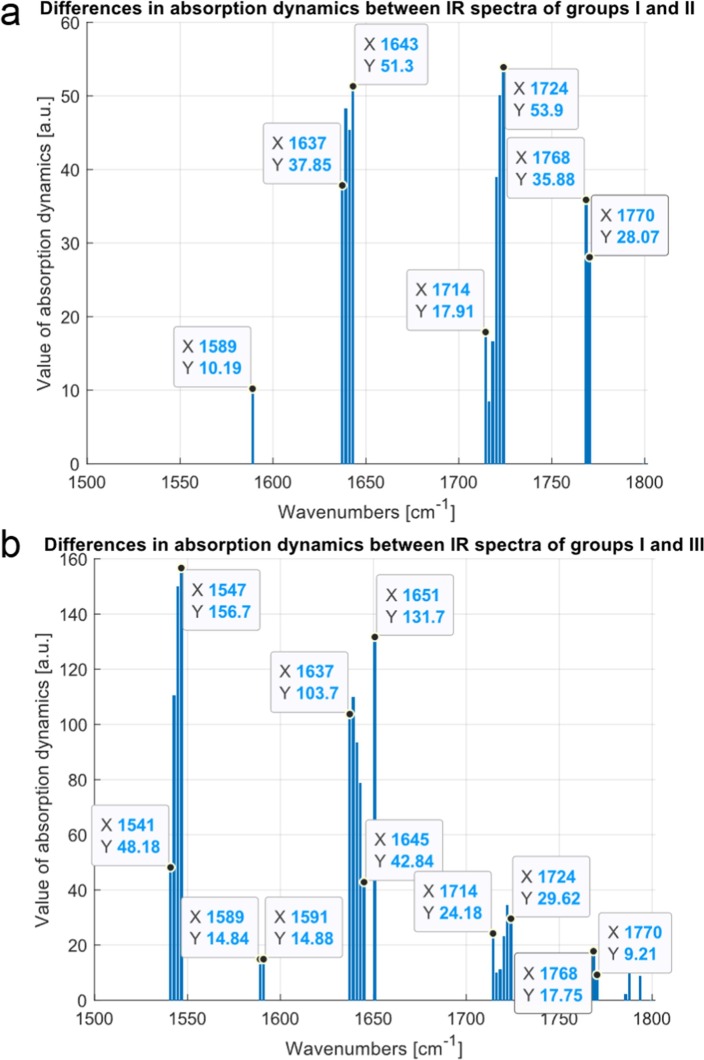
In this research, blood samples of 47 patients infected by COVID were analyzed. The samples were taken on the 1st, 3rd and 6th month after the detection of COVID infection. Total antibody levels were measured against the SARS-CoV-2 N antigen and surrogate virus neutralization by serological methods. To differentiate COVID patients with different antibody levels, Fourier Transform InfraRed (FTIR) and Raman spectroscopy methods were used. The spectroscopy data were analyzed by multivariate analysis, machine learning and neural network methods. It was shown, that analysis of serum using the above-mentioned spectroscopy methods allows to differentiate antibody levels between 1 and 6 months via spectral biomarkers of amides II and I. Moreover, multivariate analysis showed, that using Raman spectroscopy in the range between 1317 cm-1 and 1432 cm-1, 2840 cm-1 and 2956 cm-1 it is possible to distinguish patients after 1, 3, and 6 months from COVID with a sensitivity close to 100%.

Keywords: Anti-SARS-CoV-2 antibody levels; FTIR; Machine learning; Raman spectroscopy.


Conflict of interest statement

The authors declare that they have no known competing financial interests or personal relationships that could have appeared to influence the work reported in this paper.

Figures

Fig. 1
Fig. 1
Total protein values (mean ± SD) in 1th (7.30 ± 0.562), 3rd (7.12 ± 0.600) and in 6th (7.01 ± 0.427) months after COVID-19. Analyses were made by Wilcoxon rank, *noted as compared to the 1st month is p < 0.05. + noted as compared to the 3th month is p < 0.05.
Fig. 2
Fig. 2
Albumin levels (mean ± SD) in 1st (4.41 ± 0.282), 3rd (4.50 ± 0.289) and in 6th (4.47 ± 0.347) months after COVID-19. Analyses were made by Wilcoxon rank, *noted as compared to the 1st month + is noted as compared to 3rd month is p < 0.05. + noted as compared to the 3rd month is p < 0.05.
Fig. 3
Fig. 3
FTIR spectra of serum collected from patients 1, 3, and 6 months after COVID-19 (black, red, blue curves, respectively) (a); PLS analysis for IR range between 800 cm−1 and 4000 cm−1 (b); with diagnostic plots for groups I, II, III (c1, c2, c3, respectively).
Fig. 4
Fig. 4
PCA analysis of IR range between 1500 cm−1 and 1800 cm−1 (a1) and between 2700 cm−1 and 3000 cm−1 (b1) of serum collected from patients after 1 (black dot), 3 (red dot) and 6 (blue dot) months from COVID-19 with PC1 (a2, b2) and PC2 (a3, b3) loading.
Fig. 5
Fig. 5
HCA analysis of IR range between 1500 cm−1 and 1800 cm−1 (a) and between 2700 cm−1 and 3000 cm−1 (b) of serum collected from patients after 1 (black dot), 3 (red dot) and 6 (blue dot) months from COVID-19.
Fig. 6
Fig. 6
FT-Raman spectra od serum collected from patients 1, 3 and 6 months after COVID-19 (black, red, blue curves, respectively) (a); PLS analysis for Raman range between 500 cm−1 and 3700 cm−1 (b) with diagnostic plots for group I, II, III (c1, c2, c3, respectively).
Fig. 7
Fig. 7
PCA analysis of Raman range between 1317 cm−1 and 1432 cm−1 (a1) and between 2840 cm−1 and 2956 cm−1 (b1) of serum collected from patients after 1 (black dot), 3 (red dot) and 6 (blue dot) months from COVID-19 with PC1 (a2, b2) and PC2 (a3, b3) loading.
Fig. 8
Fig. 8
HCA analysis of Raman range between 1317 cm−1 and 1432 cm−1 (a) and between 2840 cm−1 and 2956 cm−1 (b) of serum collected from patients after 1 (black dot), 3 (red dot) and 6 (blue dot) months from COVID-19.
Fig. 9
Fig. 9
Differences in absorption dynamics between average FTIR spectra for patients 1 and 3 months (a) and 1 and 6 month (b) after COVID-19 in the range of wavenumbers from 1500 to 1800 cm−1. The value of absorption dynamics is normalized such that their values are between 0 and 100.
Fig. 10
Fig. 10
Differences in absorption dynamics between average FTIR spectra for patients 1 and 3 months (a) and 1 and 6 months (b) after COVID-19 in the range of wavenumbers from 2700 to 3000 cm−1.
Fig. 11
Fig. 11
Diagram of a decision tree built from a set of patients from groups I and III for range of wavenumbers 1500–1800 cm−1 (a) and 2700–3000 cm−1 (b).

References

    1. Ezhilan M., Suresh I., Nesakumar N. SARS-CoV, MERS-CoV and SARS-CoV-2: a diagnostic challenge. Measurment. 2021;168:108335. doi: 10.1016/j.measurement.2020.108335. - DOI - PMC - PubMed
    1. Loey M., Manogaran G., Taha M.H.N., Khalifa N.E.M. A hybrid deep transfer learning model with machine learning methods for face mask detection in the era of the COVID-19 pandemic. Measurment. 2021;167:108288. doi: 10.1016/j.measurement.2020.108288. - DOI - PMC - PubMed
    1. Zhou P., Yang X.-L., Wang X.-G., Hu B., Zhang L., Zhang W., Si H.-R., Zhu Y., Li B., Huang C.-L., Chen H.-D., Chen J., Luo Y., Guo H., Jiang R.-D., Liu M.-Q., Chen Y., Shen X.-R., Wang X.i., Zheng X.-S., Zhao K., Chen Q.-J., Deng F., Liu L.-L., Yan B., Zhan F.-X., Wang Y.-Y., Xiao G.-F., Shi Z.-L. A pneumonia outbreak associated with a new coronavirus of probable bat origin. Nature. 2020;579(7798):270–273. - PMC - PubMed
    1. Erensoy S. SARS-CoV-2 and microbiological diagnostic dynamics in COVID-19 pandemic. Mikrobiyol. Bul. 2021;54:497–509. doi: 10.5578/MB.69839. - DOI - PubMed
    1. National SARS-CoV-2 Serology Assay Evaluation Group. Performance characteristics of five immunoassays for SARS-CoV-2: a head-to-head benchmark comparison. Lancet Infect Dis. 12 (2020) 1390-1400. https://doi.org/10.1016/S1473-3099(20)30634-4. - PMC - PubMed

LinkOut - more resources