

Machine Learning Models for Diagnosis of Parkinson's Disease Using Multiple Structural Magnetic Resonance Imaging Features
- PMID: 35493923
- PMCID: PMC9043762
- DOI: 10.3389/fnagi.2022.808520
Machine Learning Models for Diagnosis of Parkinson's Disease Using Multiple Structural Magnetic Resonance Imaging Features
Abstract
Purpose: This study aimed to develop machine learning models for the diagnosis of Parkinson's disease (PD) using multiple structural magnetic resonance imaging (MRI) features and validate their performance.
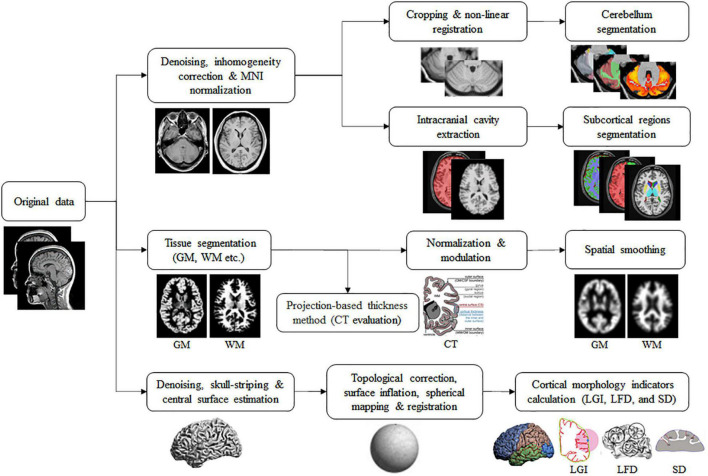
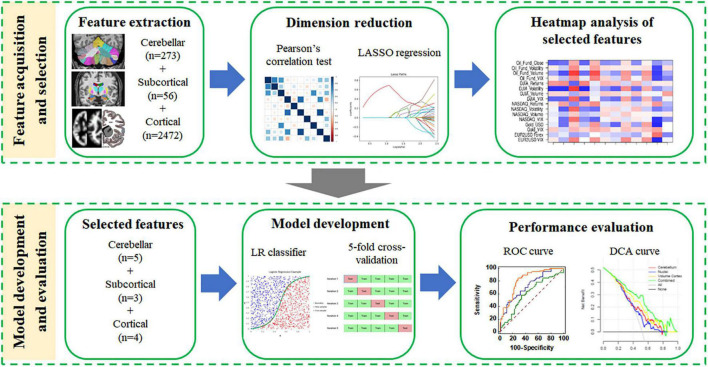
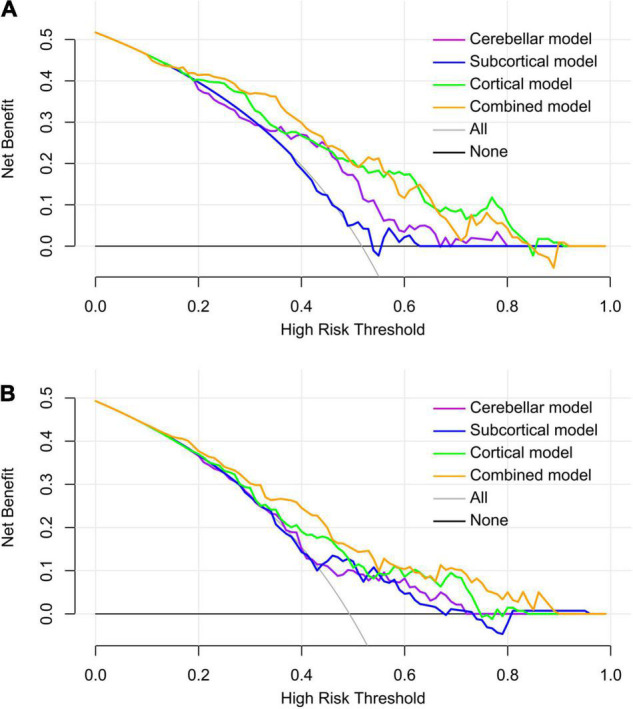
Methods: Brain structural MRI scans of 60 patients with PD and 56 normal controls (NCs) were enrolled as development dataset and 69 patients with PD and 71 NCs from Parkinson's Progression Markers Initiative (PPMI) dataset as independent test dataset. First, multiple structural MRI features were extracted from cerebellar, subcortical, and cortical regions of the brain. Then, the Pearson's correlation test and least absolute shrinkage and selection operator (LASSO) regression were used to select the most discriminating features. Finally, using logistic regression (LR) classifier with the 5-fold cross-validation scheme in the development dataset, the cerebellar, subcortical, cortical, and a combined model based on all features were constructed separately. The diagnostic performance and clinical net benefit of each model were evaluated with the receiver operating characteristic (ROC) analysis and the decision curve analysis (DCA) in both datasets.
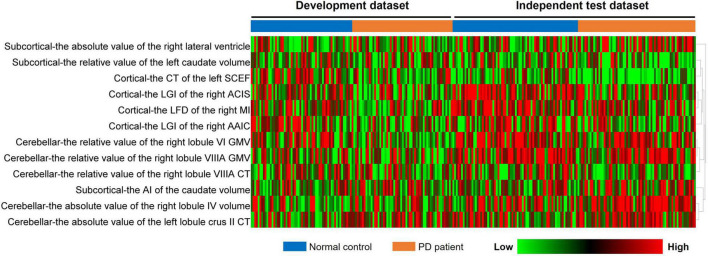
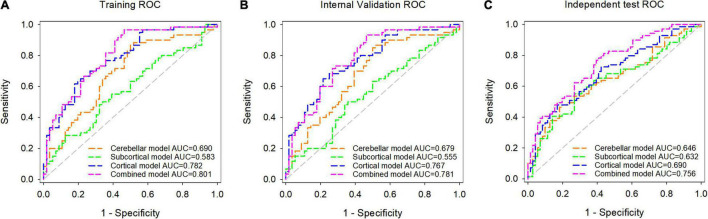
Results: After feature selection, 5 cerebellar (absolute value of left lobule crus II cortical thickness (CT) and right lobule IV volume, relative value of right lobule VIIIA CT and lobule VI/VIIIA gray matter volume), 3 subcortical (asymmetry index of caudate volume, relative value of left caudate volume, and absolute value of right lateral ventricle), and 4 cortical features (local gyrification index of right anterior circular insular sulcus and anterior agranular insula complex, local fractal dimension of right middle insular area, and CT of left supplementary and cingulate eye field) were selected as the most distinguishing features. The area under the curve (AUC) values of the cerebellar, subcortical, cortical, and combined models were 0.679, 0.555, 0.767, and 0.781, respectively, for the development dataset and 0.646, 0.632, 0.690, and 0.756, respectively, for the independent test dataset, respectively. The combined model showed higher performance than the other models (Delong's test, all p-values < 0.05). All models showed good calibration, and the DCA demonstrated that the combined model has a higher net benefit than other models.
Conclusion: The combined model showed favorable diagnostic performance and clinical net benefit and had the potential to be used as a non-invasive method for the diagnosis of PD.
Keywords: Parkinson’s disease; external validation; logistic regression; machine learning; structural magnetic resonance imaging.
Copyright © 2022 Ya, Ji, Jia, Zou, Jiang, Yin, Mao, Luo, Wang and Fan.
Conflict of interest statement
HY was employed by the Infervision Medical Technology Co., Ltd, Beijing, China. The remaining authors declare that the research was conducted in the absence of any commercial or financial relationships that could be construed as a potential conflict of interest.
Figures
Similar articles
-
Identification of Depression Subtypes in Parkinson's Disease Patients via Structural MRI Whole-Brain Radiomics: An Unsupervised Machine Learning Study.CNS Neurosci Ther. 2025 Feb;31(2):e70182. doi: 10.1111/cns.70182. CNS Neurosci Ther. 2025. PMID: 39915918 Free PMC article.
-
A more objective PD diagnostic model: integrating texture feature markers of cerebellar gray matter and white matter through machine learning.Front Aging Neurosci. 2024 Jun 7;16:1393841. doi: 10.3389/fnagi.2024.1393841. eCollection 2024. Front Aging Neurosci. 2024. PMID: 38912523 Free PMC article.
-
Radiomics-based Modelling Unveils Cerebellar Involvement in Parkinson's Disease.Cerebellum. 2025 Feb 18;24(2):48. doi: 10.1007/s12311-025-01797-z. Cerebellum. 2025. PMID: 39964592
-
Use of machine learning method on automatic classification of motor subtype of Parkinson's disease based on multilevel indices of rs-fMRI.Parkinsonism Relat Disord. 2021 Sep;90:65-72. doi: 10.1016/j.parkreldis.2021.08.003. Epub 2021 Aug 11. Parkinsonism Relat Disord. 2021. PMID: 34399160
-
Machine learning within the Parkinson's progression markers initiative: Review of the current state of affairs.Front Aging Neurosci. 2023 Feb 13;15:1076657. doi: 10.3389/fnagi.2023.1076657. eCollection 2023. Front Aging Neurosci. 2023. PMID: 36861121 Free PMC article. Review.
Cited by
-
Unlocking the potential: T1-weighed MRI as a powerful predictor of levodopa response in Parkinson's disease.Insights Imaging. 2024 Jun 9;15(1):141. doi: 10.1186/s13244-024-01690-z. Insights Imaging. 2024. PMID: 38853208 Free PMC article.
-
Combined brain network topological metrics with machine learning algorithms to identify essential tremor.Front Neurosci. 2022 Nov 2;16:1035153. doi: 10.3389/fnins.2022.1035153. eCollection 2022. Front Neurosci. 2022. PMID: 36408403 Free PMC article.
-
Sex-specific brain morphological and network differences in patients showing Parkinson's disease with and without possible rapid eye movement sleep behavior disorder.Front Neurol. 2025 Apr 22;16:1561555. doi: 10.3389/fneur.2025.1561555. eCollection 2025. Front Neurol. 2025. PMID: 40330249 Free PMC article.
-
Long-term cognitive decline prediction based on multi-modal data using Multimodal3DSiameseNet: transfer learning from Alzheimer's disease to Parkinson's disease.Int J Comput Assist Radiol Surg. 2023 May;18(5):809-818. doi: 10.1007/s11548-023-02866-6. Epub 2023 Mar 25. Int J Comput Assist Radiol Surg. 2023. PMID: 36964477 Free PMC article.
-
Machine learning models for diagnosing Alzheimer's disease using brain cortical complexity.Front Aging Neurosci. 2024 Oct 9;16:1434589. doi: 10.3389/fnagi.2024.1434589. eCollection 2024. Front Aging Neurosci. 2024. PMID: 39450051 Free PMC article.
References
-
- Babu G. S., Suresh S., Mahanand B. S. (2014). A novel PBL-McRBFN-RFE approach for identification of critical brain regions responsible for Parkinson’s disease. Expert Syst. Appl. 41 478–488. 10.1016/j.eswa.2013.07.073 - DOI
LinkOut - more resources
Full Text Sources