. 2022 Apr 14:14:844534.
doi: 10.3389/fnagi.2022.844534. eCollection 2022.

A Neuron, Microglia, and Astrocyte Triple Co-culture Model to Study Alzheimer's Disease

Affiliations

A Neuron, Microglia, and Astrocyte Triple Co-culture Model to Study Alzheimer's Disease

Celia Luchena et al. Front Aging Neurosci. .

Abstract

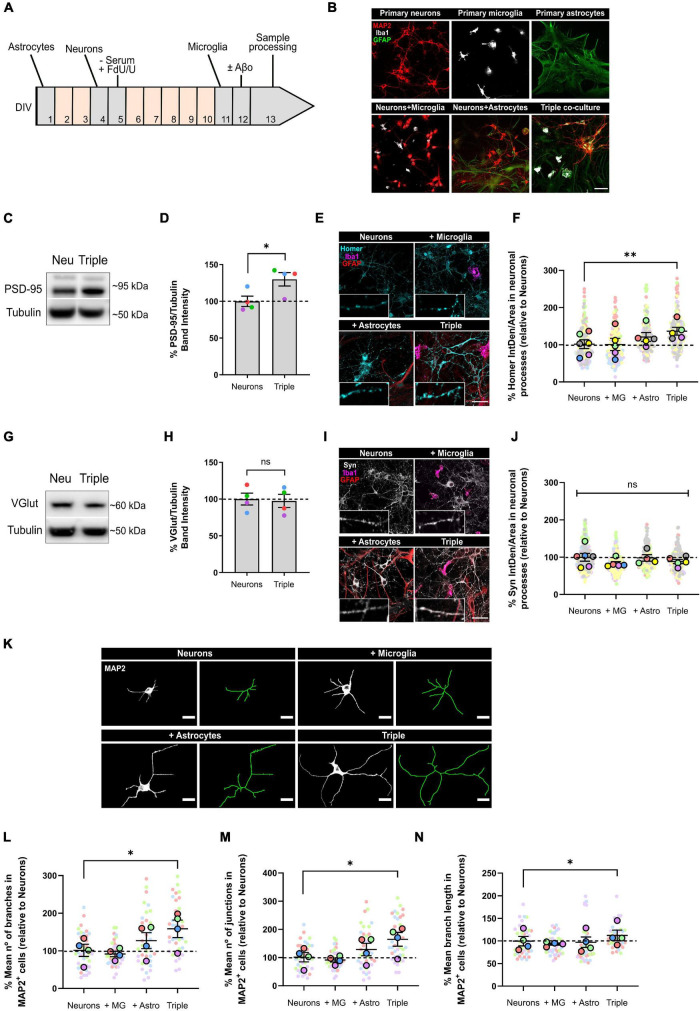
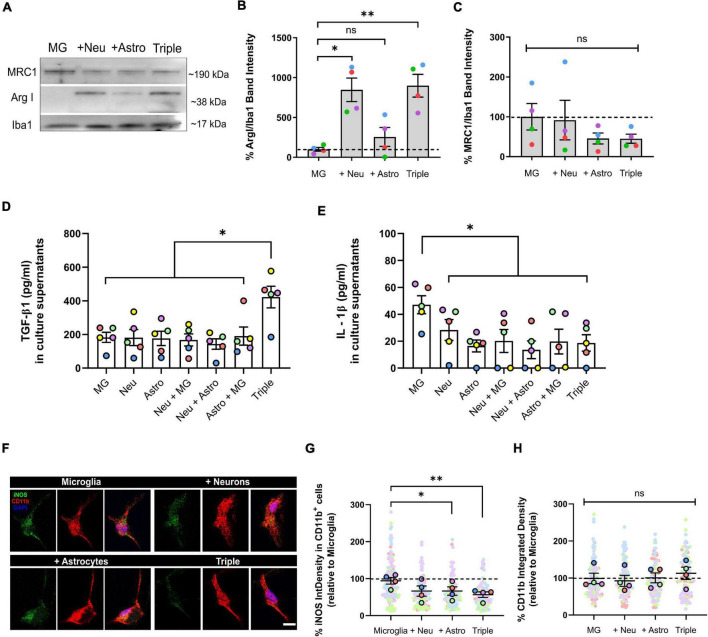
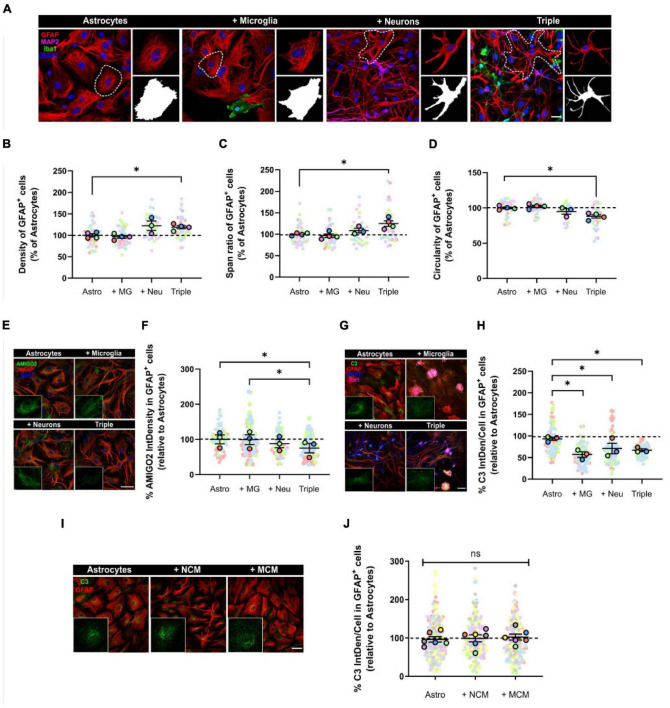
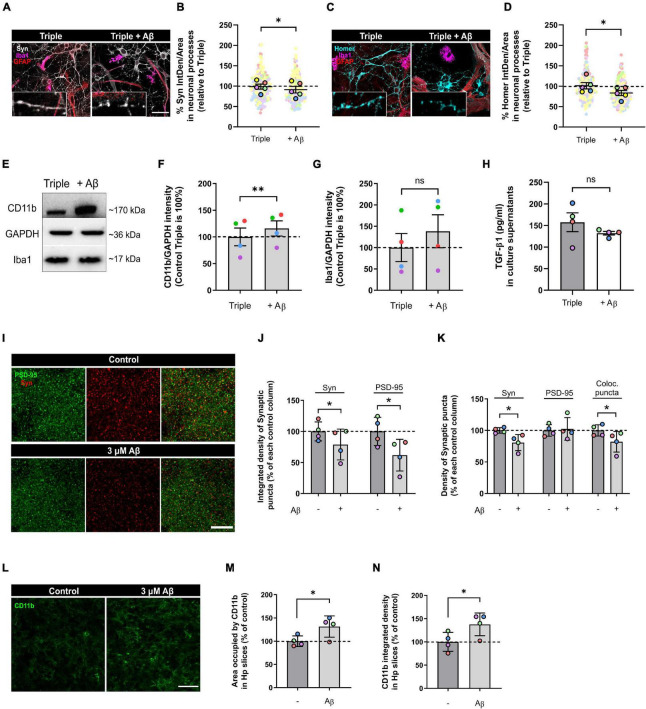
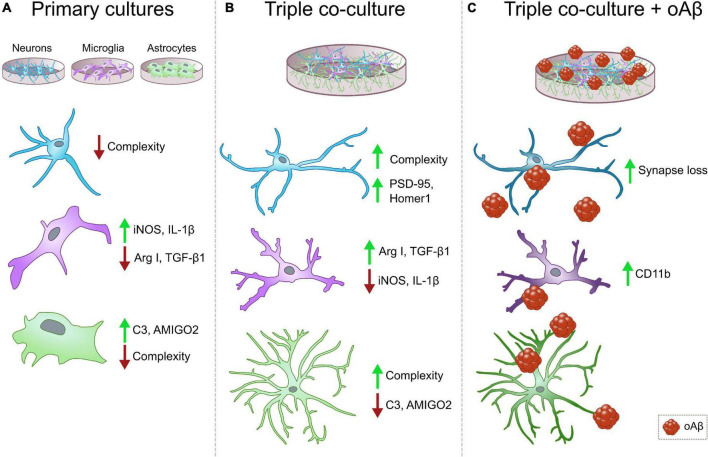
Glial cells are essential to understand Alzheimer's disease (AD) progression, given their role in neuroinflammation and neurodegeneration. There is a need for reliable and easy to manipulate models that allow studying the mechanisms behind neuron and glia communication. Currently available models such as co-cultures require complex methodologies and/or might not be affordable for all laboratories. With this in mind, we aimed to establish a straightforward in vitro setting with neurons and glial cells to study AD. We generated and optimized a 2D triple co-culture model with murine astrocytes, neurons and microglia, based on sequential seeding of each cell type. Immunofluorescence, western blot and ELISA techniques were used to characterize the effects of oligomeric Aβ (oAβ) in this model. We found that, in the triple co-culture, microglia increased the expression of anti-inflammatory marker Arginase I, and reduced pro-inflammatory iNOS and IL-1β, compared with microglia alone. Astrocytes reduced expression of pro-inflammatory A1 markers AMIGO2 and C3, and displayed a ramified morphology resembling physiological conditions. Anti-inflammatory marker TGF-β1 was also increased in the triple co-culture. Lastly, neurons increased post-synaptic markers, and developed more and longer branches than in individual primary cultures. Addition of oAβ in the triple co-culture reduced synaptic markers and increased CD11b in microglia, which are hallmarks of AD. Consequently, we developed a straightforward and reproducible triple co-cultured model, where cells resemble physiological conditions better than in individual primary cultures: microglia are less inflammatory, astrocytes are less reactive and neurons display a more mature morphology. Moreover, we are able to recapitulate Aβ-induced synaptic loss and CD11b increase. This model emerges as a powerful tool to study neurodegeneration and neuroinflammation in the context of AD and other neurodegenerative diseases.

Keywords: Alzheimer; astrocyte; co-culture; in vitro; inflammation; microglia; neuron; synapse.


Conflict of interest statement

The authors declare that the research was conducted in the absence of any commercial or financial relationships that could be construed as a potential conflict of interest.

Figures

FIGURE 1
FIGURE 1
Neurons increased the expression of post-synaptic markers PSD-95 and Homer1, and developed more and longer branches when co-cultured with microglia and astrocytes. (A) Protocol diagram for the in vitro triple co-culture model and (B) representative images. Cultures started with a monolayer of astrocytes. Neurons were plated 3 days later (ratio: five neurons to two astrocytes), and microglia were added 7 days after neurons (ratio: one microglia to five neurons). Cultures were maintained for 13 DIV in total. Scale bar = 50 μm. (C) Representative western blot image of post-synaptic marker PSD-95 in total lysates. (D) Quantification of PSD-95 in the triple co-culture compared with neurons alone. Raw data was normalized with α-tubulin (n = 4). (E) Representative images of post-synaptic marker Homer1 immunofluorescence in neuronal processes. Scale bar = 40 μm. (F) Quantification of Homer1 in the triple co-culture, compared with neurons alone (n = 6). (G) Representative western blot image of pre-synaptic marker VGlut1 in total lysates. (H) Quantification of VGlu1. Raw data was normalized with α-tubulin (n = 4). (I) Representative images of pre-synaptic marker Synaptophysin immunofluorescence in neuronal processes. Scale bar = 40 μm. (J) Quantification of Synaptophysin (n = 6). (K) Representative images of the cellular morphology analysis using the neuronal marker MAP2 and the function Skeletonize in Fiji software. Scale bar = 20 μm. (L) Quantification of the number of branches per MAP2+ cell (n = 4). (M) Quantification of the number of junctions per MAP2+ cell (n = 4). (N) Mean branch length of MAP2+ cells (n = 4). Each bar represents the mean ± SEM. *p < 0.05; **p < 0.01; ns, not significant. For quantification, 7–8 random fields per condition were used. DIV = days in vitro; Neu, neurons; MG, microglia; Astro, astrocytes; Syn, synaptophysin; IntDen, integrated density.
FIGURE 2
FIGURE 2
Microglia increased the expression of anti-inflammatory markers ArgI and TGF-β1, and decreased pro-inflammatory markers IL-1β and iNOS in the triple co-culture model. (A) Representative western blot image of microglial markers in total cell lysates. (B) Quantification of anti-inflammatory marker ArgI (n = 4). (C) Quantification of anti-inflammatory marker MRC1 (n = 4). Data was normalized using the marker Iba1 in order to selectively control for microglia. (D) ELISA quantification of anti-inflammatory cytokine TGF-β1 in culture supernatants (n = 5). (E) ELISA quantification of pro-inflammatory cytokine IL-1β in culture supernatants (n = 5). (F) Representative image microglial markers CD11b and iNOS in individual cells. Scale bar = 10 μm. (G) Quantification of the integrated density of iNOS inside CD11b+ cells (n = 4). (H) Quantification of the integrated density of CD11b (n = 4). Each bar represents the mean ± SEM. *p < 0.05; **p < 0.01; ns, not significant. For quantification, 5–6 random fields per condition were used. Neu, neurons; MG, microglia; Astro, astrocytes; ArgI, arginase I, IntDensity, integrated density.
FIGURE 3
FIGURE 3
Astrocytes displayed a less reactive morphology and reduced expression of A1 activation markers AMIGO2 and C3. (A) Representative images of the analysis of astrocytic morphology using GFAP and Fractal Analysis in Fiji Software. Black and white images represent the outline of individual cells selected in each condition. Scale bar = 20 μm. (B) Quantification of the density of GFAP+ astrocytes (n = 4). (C) Quantification of the span ratio of GFAP+ astrocytes (n = 4). (D) Quantification of the circularity of GFAP+ astrocytes (n = 4). (E) Representative image of A1 astrocytic marker AMIGO2. Scale bar = 40 μm. (F) Quantification of the expression of AMIGO2 inside GFAP+ cells (n = 3). (G) Representative image of A1 astrocytic marker C3. Scale bar = 40 μm. (H) Quantification of the integrated density of C3 inside GFAP+ cells (n = 3). (I) Representative image of C3 in GFAP+ astrocytes after conditioned media treatment. Scale bar = 40 μm. (J) Quantification of the integrated density of C3 (n = 6). Each bar represents the mean ± SEM. *p < 0.05; ns, not significant. For quantification, 5–6 random fields per condition were used. Neu, neurons; MG, microglia; Astro, astrocytes; NCM, neuron conditioned media; MCM, microglia conditioned media; IntDen, Integrated density.
FIGURE 4
FIGURE 4
Oligomeric Aβ reduced pre- and post-synaptic puncta and increased microglial expression of CD11b in the triple co-culture and in hippocampal organotypic slices. (A) Representative image of Synaptophysin in neuronal processes. Scale bar = 40 μm. (B) Quantification of Synaptophysin in the triple co-culture after oAβ treatment (n = 5). (C) Representative image of Homer1 in neuronal processes. Scale bar = 40 μm. (D) Quantification of Homer1 in the triple co-culture with oAβ (n = 5). (E) Western blot image of microglial markers in total lysates. (F) Quantification of CD11b in the triple co-culture (n = 4). (G) Quantification of Iba1 expression (n = 4). Raw data was normalized with GAPDH. (H) ELISA quantification of TGF-β1 in culture supernatants (n = 4). (I) Representative images of synaptic markers puncta in hippocampal organotypic slices. Scale bar = 10 μm. (J) Integrated density of Synaptophysin and PSD-95 in organotypic cultures after oAβ treatment (n = 4). (K) Quantification of the puncta density of Synaptophysin, PSD-95 and the colocalization of both markers (n = 4). (L) Representative image of CD11b staining in hippocampal organotypic slices. Scale bar = 40 μm. (M) Area occupied by CD11b staining after oAβ treatment (n = 4). (N) Integrated density of CD11b (n = 4). Each bar represents the mean ± SEM. *p < 0.05; **p < 0.01; ns, not significant. For quantification, 5–6 random fields and 4 random fields per condition were quantified in triple co-cultures and organotypic cultures, respectively. Syn, synaptophysin.
FIGURE 5
FIGURE 5
Summary diagrams of individual vs. triple co-cultures and in the context of AD. (A) Classical individual primary cultures often exhibit significant alterations in comparison with cells in physiological conditions. Neurons and microglia display low morphological complexity, and both microglia and astrocytes increase the expression of pro-inflammatory markers iNOS, IL1β and C3, and AMIGO2, respectively. (B) In our triple co-culture, neurons develop more complex morphologies and increased post-synaptic markers PSD-95 and Homer1. Microglia lower their expression of pro-inflammatory markers such as iNOS and IL-1β, and increase anti-inflammatory markers Arg I and TGF-β1. Lastly, astrocytes reduce the expression of pro-inflammatory markers C3 and AMIGO2, while they develop ramifications that resemble physiological conditions. (C) In the triple co-culture, Aβ1-42 oligomers are able to induce synaptic loss and increase microglial marker CD11b, which makes this triple co-culture a suitable model to study amyloid pathology associated changes in vitro. Neurons, blue cells, microglia, purple cells, astrocytes, green cells, oAβ, oligomeric Aβ.

References

    1. Aebersold M. J., Thompson-Steckel G., Joutang A., Schneider M., Burchert C., Forró C., et al. (2018). Simple and Inexpensive Paper-Based Astrocyte Co-culture to Improve Survival of Low-Density Neuronal Networks. Front. Neurosci. 12:94. 10.3389/fnins.2018.00094 - DOI - PMC - PubMed
    1. Akiyama H., McGeer P. L. (1990). Brain microglia constitutively express β-2 integrins. J. Neuroimmunol. 30 81–93. 10.1016/0165-5728(90)90055-r - DOI - PubMed
    1. Alberdi E., Sánchez-Gómez M. V., Ruiz A., Cavaliere F., Ortiz-Sanz C., Quintela-López T., et al. (2018). Mangiferin and morin attenuate oxidative stress, mitochondrial dysfunction, and neurocytotoxicity, induced by Amyloid Beta Oligomers. Oxid. Med. Cell. Longev. 2018:2856063. 10.1155/2018/2856063 - DOI - PMC - PubMed
    1. Alberdi E., Wyssenbach A., Alberdi M., Sánchez-Gómez M. V., Cavaliere F., Rodríguez J. J., et al. (2013). Ca 2+ -dependent endoplasmic reticulum stress correlates with astrogliosis in oligomeric amyloid β-treated astrocytes and in a model of Alzheimer’s disease. Aging Cell 12 292–302. 10.1111/acel.12054 - DOI - PubMed
    1. Bohlen C. J., Bennett F. C., Tucker A. F., Collins H. Y., Mulinyawe S. B., Barres B. A. (2017). Diverse Requirements for Microglial Survival, Specification, and Function Revealed by Defined-Medium Cultures. Neuron 94 759.e–773.e. 10.1016/j.neuron.2017.04.043 - DOI - PMC - PubMed