. 2022 Apr 12;25(5):104240.
doi: 10.1016/j.isci.2022.104240. eCollection 2022 May 20.

Toward snowpack runoff decision support

Affiliations

Toward snowpack runoff decision support

Anne Heggli et al. iScience. .

Abstract

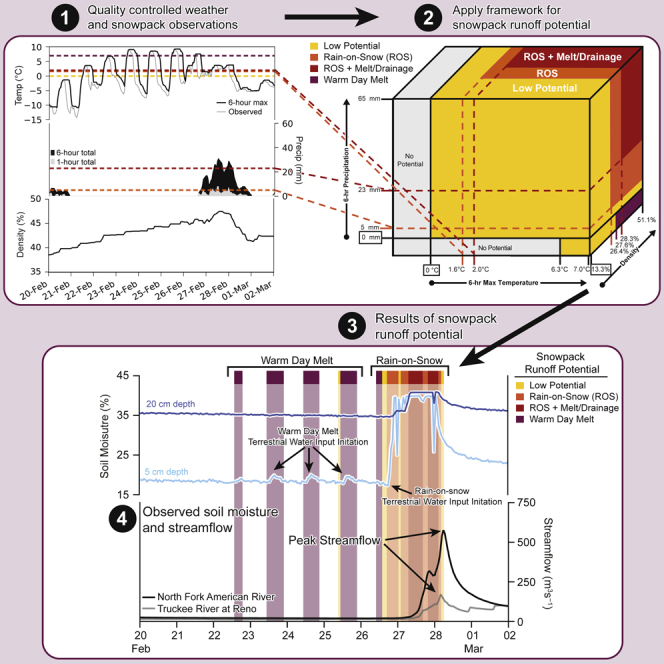
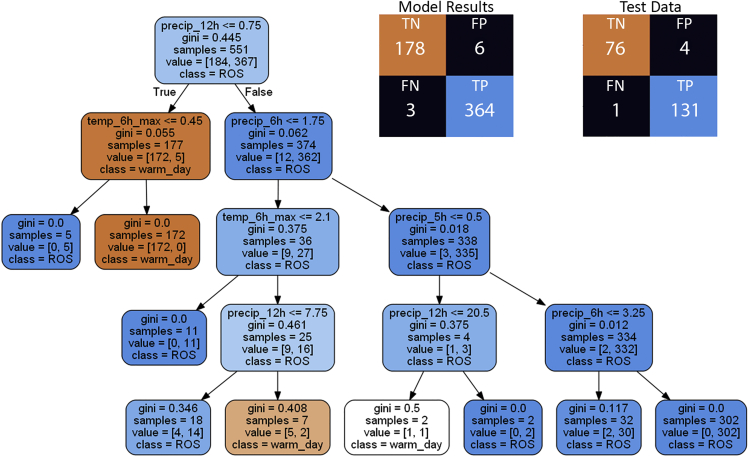
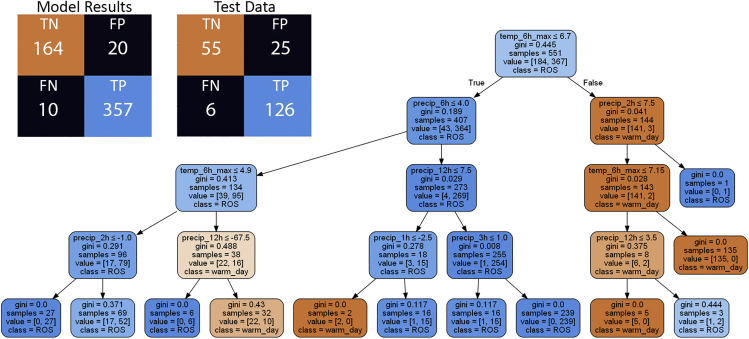
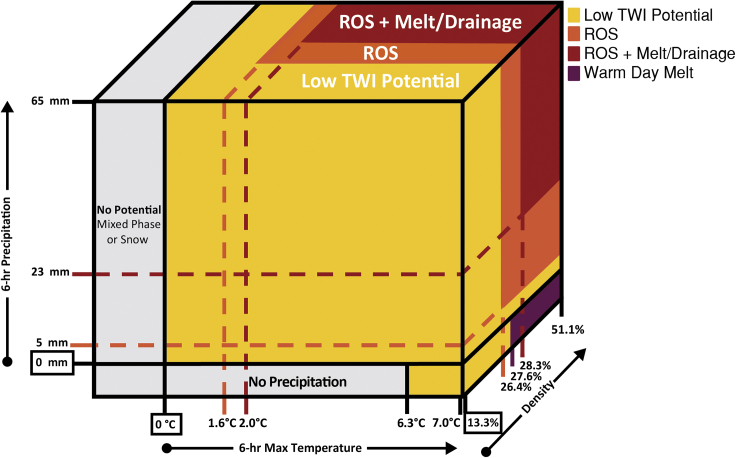
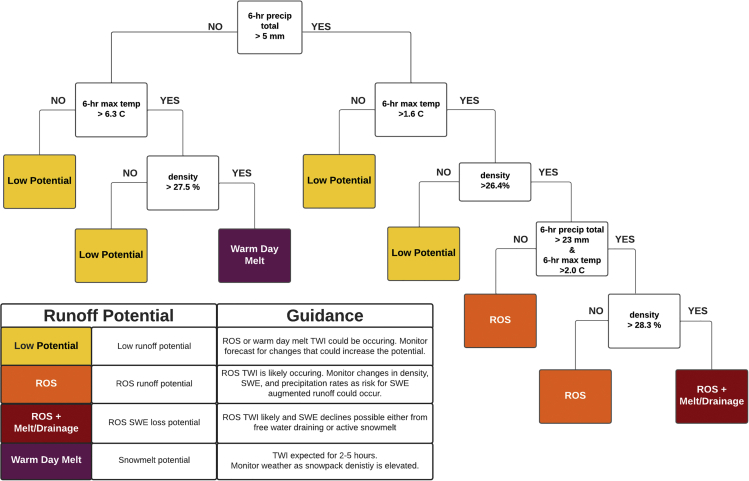
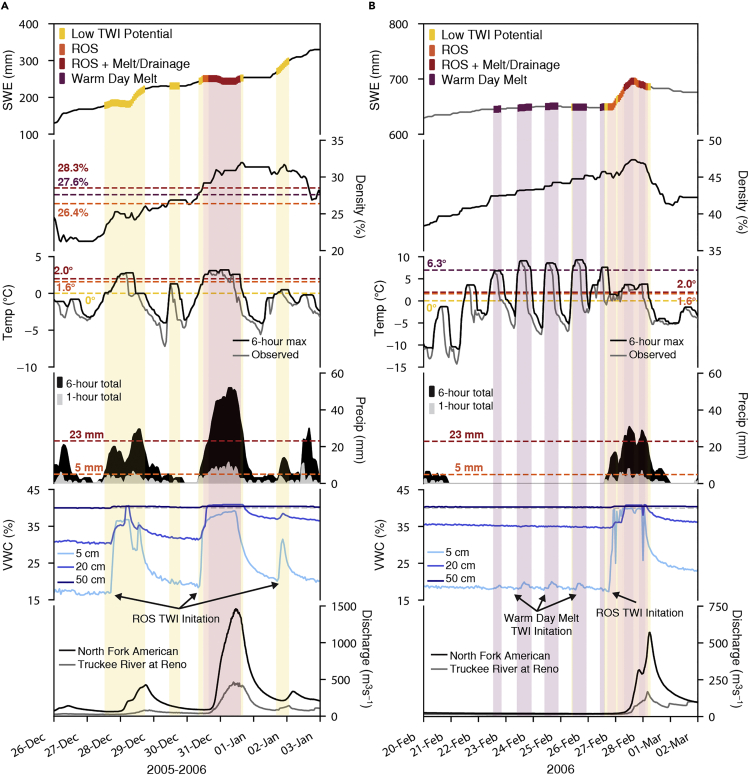
Rain-on-snow (ROS) events are commonly linked to large historic floods in the United States. Projected increases in the frequency and magnitude of ROS multiply existing uncertainties and risks in operational decision making. Here, we introduce a framework for quality-controlling hourly snow water content, snow depth, precipitation, and temperature data to guide the development of an empirically based snowpack runoff decision support framework at the Central Sierra Snow Laboratory for water years 2006-2019. This framework considers the potential for terrestrial water input from the snowpack through decision tree classification of rain-on-snow and warm day melt events to aid in pattern recognition of prominent weather and antecedent snowpack conditions capable of producing snowpack runoff. Our work demonstrates how (1) present weather and (2) antecedent snowpack risk can be "learned" from hourly data to support eventual development of basin-specific snowpack runoff decision support systems aimed at providing real-time guidance for water resource management.

Keywords: earth sciences; environmental event; environmental management; environmental monitoring; water resources engineering.


Conflict of interest statement

The authors declare no conflicts of interest.

Figures

None
Graphical abstract
Figure 1
Figure 1
Correspondence between soil moisture change and streamflow response in nearby watersheds during four ROS events (1–4). Hourly soil moisture data (VWC %) at the Central Sierra Snow Laboratory for water year (WY) 2017 at 5 cm (light blue), 20 cm (medium blue), and 50 cm (dark blue) corresponds with stream flow response at three US Geological Survey gages: (A) Truckee River at Reno, (B) Ward Creek, and (C) North Fork of the American River at North Fork Dam.
Figure 2
Figure 2
Study area location and climatological characteristics (A) Map of the Central Sierra Snow Lab. (B) Climograph based on water years 1988 through 2019 showing average (dark) and all-time (light) maximum (red) and minimum temperature (blue) on the left y axis. The right y axis shows the distribution of monthly accumulated precipitation (green) and snow water equivalent (grey).
Figure 3
Figure 3
Decision tree classification of ROS and warm day melt events from the cleaned data Decision tree classification model (STAR MethodsDecision tree classification) for the cleaned data and confusion matrix for the results of the model and test data illustrating the number of true positives (TP), true negatives (TN), false positives (FP), and false negatives (FN) of the predicted values against the actual values with true identifying ROS and false identifying warm day melt TWI. See STAR MethodsDecision tree classification and Decision tree classifier criteria for further detail.
Figure 4
Figure 4
Decision tree classification of ROS and warm day melt events from the raw data Decision tree classification model (STAR MethodsDecision tree classification) for the raw data and confusion matrix for the results of the model and test data illustrating the number to true positives (TP), true negatives (TN), false positives (FP), and false negatives (FN) of the predicted values against the actual values with true identifying ROS and false identifying warm day melt TWI. See STAR MethodsDecision tree classification and Decision tree classifier criteria for further detail.
Figure 5
Figure 5
Distributions of present weather and snowpack conditions for rain-on-snow (ROS), rain-on-snow plus snow water equivalent loss (ROS + melt/drainage), and warm day melt (A) Histogram showing the distribution of 6-h maximum temperature (°C) for ROS (orange), ROS + melt/drainage (red), and warm day melt (purple) events. (B) Box-percentile plots showing the distribution of ROS, ROS + melt/drainage, and warm day melt events for varying temperatures. Dashed lines represent first quartile, median, and third quartile values with first quartile in bold to draw the connection to the development of the framework in Snowpack runoff decision support framework section. (C and D) As in panels (A) and (B), but for density (%). (E) and (F) As in panels (A) and (B), but for 6-h precipitation (mm).
Figure 6
Figure 6
Change in SWE from one to 24 h during ROS (A) 1-h, 3-h, 6-h, 12-h, and 24-h total change in SWE (mm) during ROS events. (B) 24-h change in SWE (mm) versus 24-h precipitation totals (mm) with the black 1:1 line indicating periods when the snowpack accumulated all of the precipitation and a gray line when SWE was lost over 24 h.
Figure 7
Figure 7
Duration of TWI as a function of total daily precipitation and percent rain Daily total precipitation and precipitation phase as percent (%) rain from manual observations from the Central Sierra Snow Laboratory and SNOTEL-derived cumulative hours of TWI per day and total precipitation.
Figure 8
Figure 8
Conceptual snowpack runoff decision support framework Snowpack runoff decision support conceptual framework developed through the application of first-quartile 6-h precipitation, 6-h maximum temperature, and density 1-h earlier as indicators of low, ROS, ROS + melt/drainage, or warm day melt TWI potential.
Figure 9
Figure 9
Decision tree visualization of the snowpack runoff decision support framework developed at the Central Sierra Snow Laboratory with color scale indicating TWI potential
Figure 10
Figure 10
Example applications of the preliminary snowpack runoff decision support framework The decision tree TWI potential thresholds applied to (a) December 26, 2005 through January 3, 2006 and (b) February 20–March 2, 2006. The first subpanel of each plot shows SWE (mm) colored by TWI potential as low potential (yellow), ROS (orange), ROS + melt/drainage (red), and warm day melt (purple). The second subpanel shows the snowpack density (%) with corresponding TWI potential thresholds with representative colors. The third subpanel shows observed (gray) and 6-h maximum (black) air temperatures (°C) with corresponding thresholds and the fourth panel shows 1-h (filled gray) and 6-h (filled black) precipitations totals (mm) with the 6-h precipitation corresponding TWI potential thresholds. The fifth subpanel shows volumetric water content (%) from the soil moisture sensors at 5 cm (light blue), 20 cm (medium blue), and 50 cm (dark blue) depths. The sixth subpanel shows streamflow (m3s−1) at two US Geological Survey gages: North Fork of the American River at North Fork Dam (black) and Truckee River at Reno (gray).
Figure 11
Figure 11
Composite synoptic conditions for events with at least six hours of TWI from ROS Composite synoptic conditions from the North American Regional Reanalysis (Mesinger et al., 2006) for 17 unique events that produced at least six hours of TWI. (A) Composite precipitable water (mm) and 500 hPa geopotential heights (m; contours). (B) Integrated vapor transport (IVT; kg m −1 s −1; relative vectors); IVT anomalies (colored); and regions indicating atmospheric river conditions (> 250 kg m−1 s −1) or elevated moisture transport (> 400 kg m−1 s −1). (C) 700 hPa air temperatures (contours) and 700 hPa air temperature anomalies (°C; filled contours) with IVT vectors overlaid (kg m−1 s −1). (D) 250 hPa winds (vectors; m s −1); 250 hPa wind anomalies (m s −1; filled contours); 250 hPa winds exceeding 40 m s −1 (purple contours); sea level pressure (hPa; black contours).

References

    1. Agency E.P. 40 cfr part 58 air quality index reporting; final rule. Fed. Regist. 1999;64 https://www.airnow.gov/sites/default/files/2018-06/air-quality-index-rep...
    1. Anderson E. Snow accumulation and ablation model-SNOW-17. Tech. Rep. 2006 https://www.nrcs.usda.gov/wps/PA_NRCSConsumption/download?cid=nrcseprd18... National Weather Service.
    1. Anderson J., Wirt J. Ultrasonic snow depth sensor accuracy, reliability, and performance, Hood River, OR. 2008. sites/westernsnowconference.org/PDFs/2008Anderson.pdf
    1. Arienzo M.M., Collins M., Jennings K.S. Enhancing engagement of citizen scientists to monitor precipitation phase. Front. Earth Sci. 2021;9:68. doi: 10.3389/feart.2021.617594. - DOI
    1. Avanzi F., Michele C.D., Ghezzi A., Jommi C., Pepe M. A processing–modeling routine to use SNOTEL hourly data in snowpack dynamic models. Adv. Water Resour. 2014;73:16–29. doi: 10.1016/j.advwatres.2014.06.011. - DOI

Associated data

LinkOut - more resources