. 2022 Apr 12;25(5):104241.
doi: 10.1016/j.isci.2022.104241. eCollection 2022 May 20.

Microbiota-mediated skewing of tryptophan catabolism modulates CD4+ T cells in lupus-prone mice

Affiliations

Microbiota-mediated skewing of tryptophan catabolism modulates CD4+ T cells in lupus-prone mice

Josephine Brown et al. iScience. .

Abstract

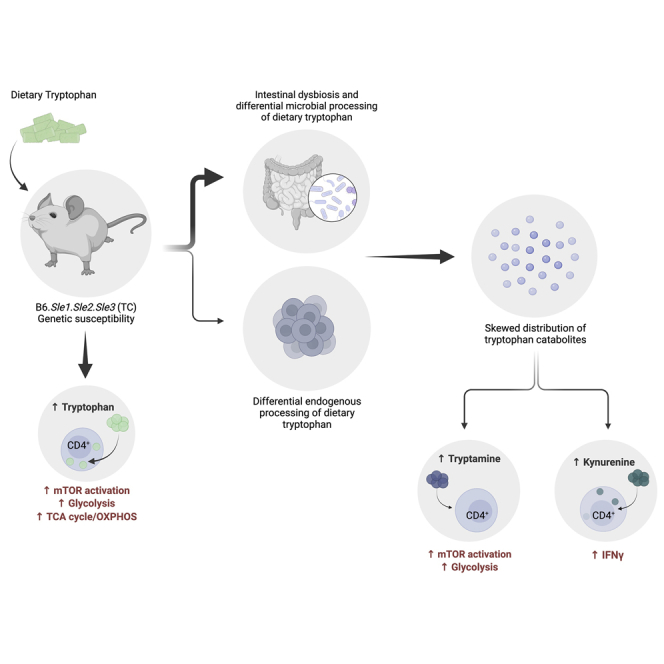
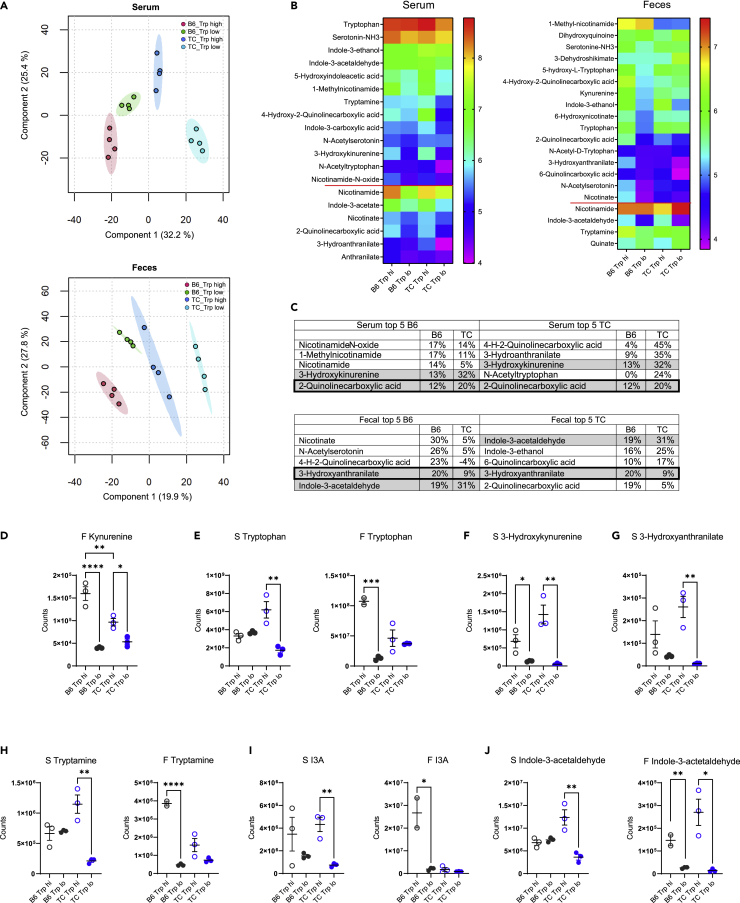
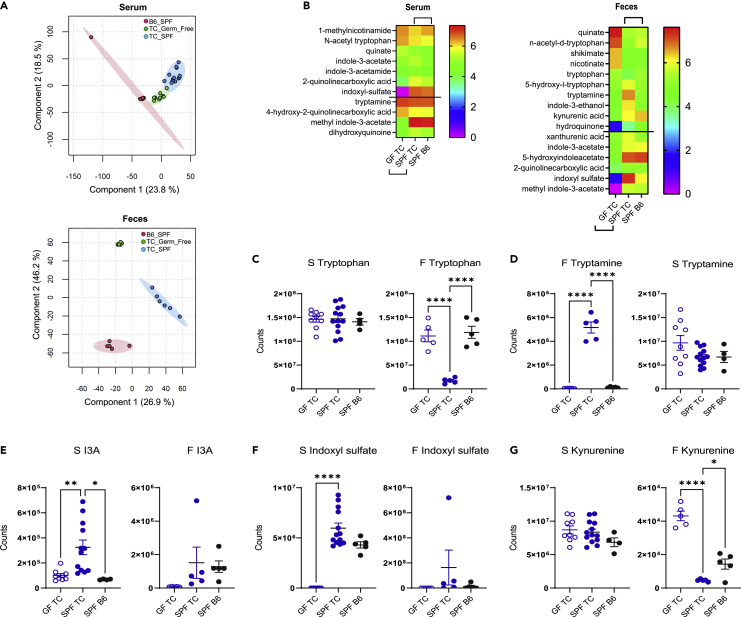
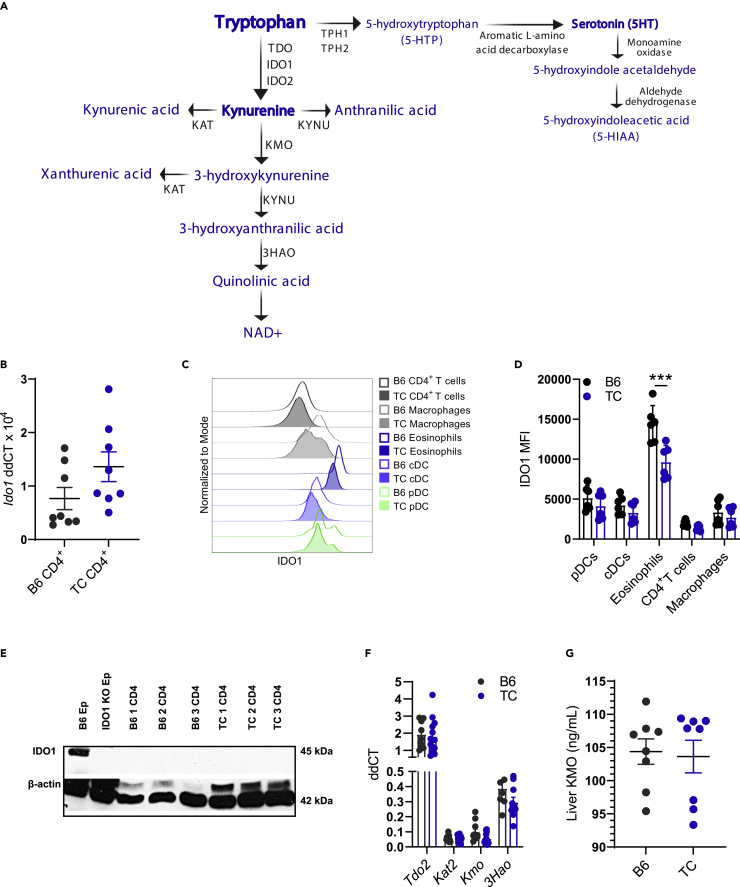
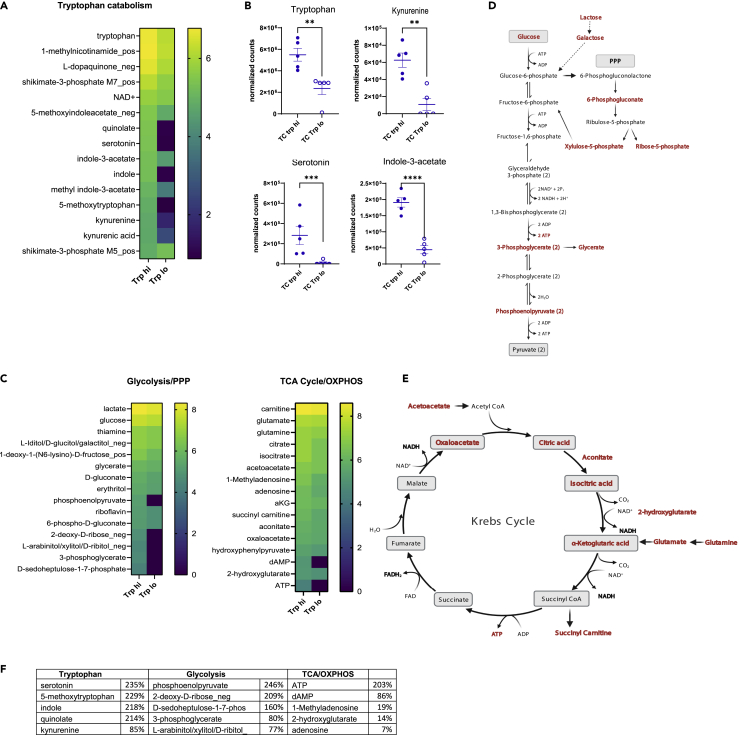
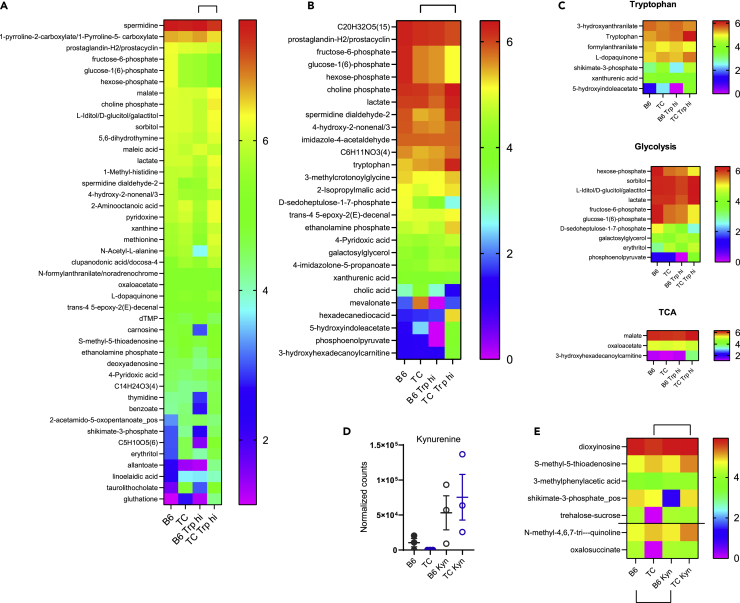
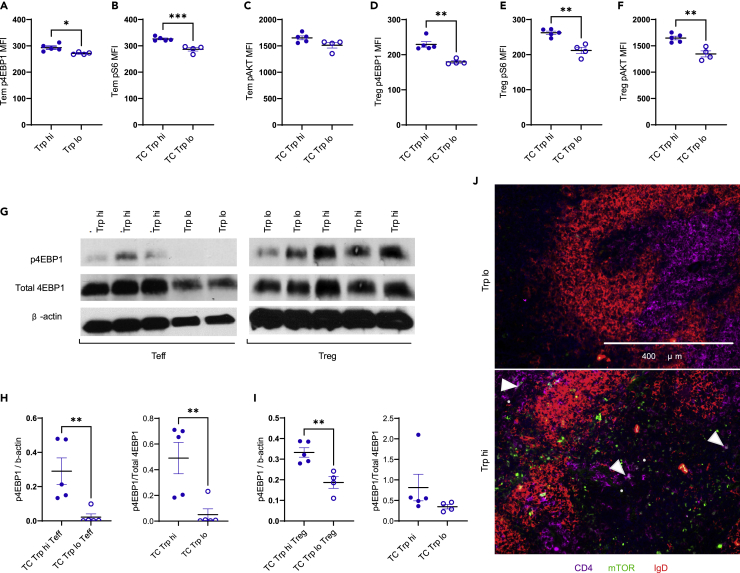
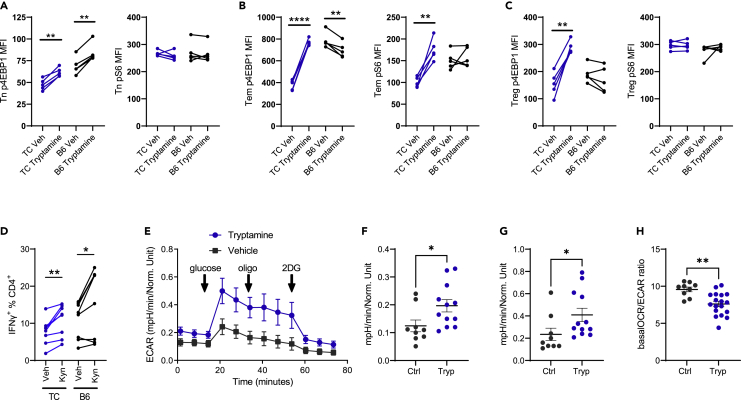
A skewed tryptophan metabolism has been reported in patients with lupus. Here, we investigated the mechanisms by which it occurs in lupus-susceptible mice, and how tryptophan metabolites exacerbate T cell activation. Metabolomic analyses demonstrated that tryptophan is differentially catabolized in lupus mice compared to controls and that the microbiota played a role in this skewing. There was no evidence for differential expression of tryptophan catabolic enzymes in lupus mice, further supporting a major contribution of the microbiota to skewing. However, isolated lupus T cells processed tryptophan differently, suggesting a contribution of T cell intrinsic factors. Functionally, tryptophan and its microbial product tryptamine increased T cell metabolism and mTOR activation, while kynurenine promoted interferon gamma production, all of which have been associated with lupus. These results showed that a combination of microbial and T cell intrinsic factors promotes the production of tryptophan metabolites that enhance inflammatory phenotypes in lupus T cells.

Keywords: Biological sciences; Cell biology; Human metabolism; Immunology.


Conflict of interest statement

The authors declare that they have no conflict of interest.

Figures

None
Graphical abstract
Figure 1
Figure 1
Dietary tryptophan is processed differently in lupus-prone and control mice (A) PLS-DA plots of serum and fecal metabolites from B6 and TC mice fed high or low tryptophan for 1 month (N = 4 per group). For simplicity, only the positive mode is shown. (B) Heatmaps of tryptophan metabolites differently represented in serum and feces among the 4 groups (p < 0.05 analyzed by ANOVA). Data are shown as Log10 transformed mean for each group ordered from the highest to lowest in the B6 Trp low group. Metabolites below the red horizontal lines were changed by dietary tryptophan to a similar extent in both strains. Metabolites above the red lines were affected differently by tryptophan between the two strains, i.e. there was a significant difference between the Trp high groups with no difference between Trp low groups, or there was a difference between Trp low and high in only one of the strains. (C) Top 5 serum and fecal tryptophan metabolites ranked separately for B6 and TC as the most changed by high dietary tryptophan. The values show the difference between high and low tryptophan as a percentage of the low tryptophan value, all Log10-transformed, as shown in the heatmaps. (D–G) Values for tryptophan and endogenous metabolites. (H–J) Values for microbial metabolites. C–J: Graphs show individual mice with mean ± SEM t tests, ∗p < 0.05, ∗∗p < 0.01.
Figure 2
Figure 2
Microbial contribution to serum and feces metabolites in TC mice (A) PLS-DA plots of serum and fecal metabolite profiles in GF TC, SPF TC, and SPF B6 mice. For simplicity, only the positive mode is shown. (B) Tryptophan metabolites in the serum and feces of GF and SPF TC as well as SPF B6 mice. All metabolites represented were significantly different between GF and SPF TC samples (microbiome effect shown by the lower brackets). Above the horizontal lines, samples were also different between SPF TC and SPF B6 samples (strain effect shown by the upper brackets). Data show Log10 transformed means for each group ordered from the highest to lowest in GF TC group (serum: N = 9 GF TC, 13 SPF TC, and 5 SPF B6; feces: N = 5 per group). (C–G) Serum and fecal values in GF TC, SPF TC, and SPF B6 mice for tryptophan (C), tryptamine (D), indole-3-acetate (I3A) (E), indoxyl sulfate (F), and kynurenine (G). B–G: Graphs show individual mice with mean ± SEM 1-way ANOVA with T3 Dunnett’s multiple comparisons tests. ∗p < 0.05, ∗∗p < 0.01, ∗∗∗p < 0.001, ∗∗∗∗p < 0.0001.
Figure 3
Figure 3
Endogenous enzymes are not responsible for elevated kynurenine in TC mice (A) Depiction of the endogenous enzymes and metabolites (blue) in the kynurenine and serotonin pathways. (B) Ido1 gene expression in B6 and TC CD4+ T cells. (C) Representative flow cytometry histogram overlays of IDO1 mean fluorescence intensity (MFI) in immune cell subsets from B6 and TC mice. (D) Quantitation of (C), N = 6. (E) Western blot analysis of B6 and TC CD4+ T cells (N = 3) for IDO1 and β-actin. Epididymis (Ep) from B6 and B6.Ido1−/− mice were used as positive and negative controls, respectively. (F) Expression of KP genes in B6 and TC livers relative to Ppia, N = 8–13. (G) Concentration of KMO protein in B6 and TC liver, N = 8. B, D–G: C–J: Graphs show individual mice with mean ± SEM t tests, ∗∗∗p < 0.001.
Figure 4
Figure 4
Dietary tryptophan alters the metabolism of TC CD4+ T cells (A) Heatmap of tryptophan metabolites in CD4+ T cells from TC mice fed with high or low tryptophan for 1 month (N = 5 per group). (B) Values from (A) shown for selected metabolites. Graphs show individual mice with mean ± SEM t tests, ∗∗p < 0.01, ∗∗p < 0.001, ∗∗∗p < 0.0001. (C) Heatmaps of metabolites in the glycolysis/PPP and TCA cycle/OXPHOS pathways showing Log10 transformed means for each group ordered from the highest to lowest in the Trp high group (N = 5). (D) Representation of the glycolysis/PPP pathway. (E) Representation of the TCA cycle. In (D) and (E), the metabolites present in the heatmaps in (C) are shown in red. (F) Top 5 CD4+ T cells most changed by high dietary tryptophan in TC mice for the tryptophan, glycolysis, and TC/OXPHOS pathways. The values show the difference between high and low tryptophan as a percentage of the low tryptophan value, all Log10-transformed, as shown in the heatmaps.
Figure 5
Figure 5
Exogenous tryptophan enhanced glycolysis and TCA cycle activity in TC CD4+ T cells in vitro (A) Heatmaps of metabolites differentially represented between B6 and TC CD4+ T cells after 24 h activation with the addition of 50 uM tryptophan (Trp hi). Metabolites that differed between strains only at basal level of tryptophan were excluded. (B) Heatmaps of metabolites differently represented between TC CD4+ T cells at baseline and with 50 uM tryptophan. (C) Subsets of metabolites from A and B in the tryptophan, glycolysis, and TCA pathways. (D) Kynurenine levels in B6 and TC CD4+ T cells after 24 h activation without or with the addition 50 uM kynurenine. Graphs show individual mice with mean ± SEM. (E) Heatmap showing metabolites differently represented in TC and B6 T cells above and below the horizontal line respectively, with the addition of kynurenine. Data show Log10 transformed means for each group ordered from the highest to lowest in the B6 control group (N = 3 per group).
Figure 6
Figure 6
High dietary tryptophan promotes mTOR activation in CD4+ T cells (A–F) MFI of p4EBP1, pS6, and pAKTSer473 in Tem (A–C) and Treg (D–F) cells from TC mice fed low or high tryptophan for 1 month, N = 4. (G) Representative Western blot analysis of TC Teff and Treg cells for p4EBP1 and β-actin. For Teff samples, high tryptophan group is on the left. For Treg samples, high tryptophan group is on the right. (H–I) Quantification of Western blot results for p4EBP1 relative to β-actin, N = 5. (J) Representative immunofluorescence staining for CD4, mTOR, and IgD in spleen sections from TC mice fed high or low tryptophan for 2 months. Arrow heads indicate mTOR+ CD4+ T cells. Graphs show individual mice with mean ± SEM t tests, ∗p < 0.05, ∗∗p < 0.01, ∗∗∗p < 0.001.
Figure 7
Figure 7
Tryptamine promotes mTOR activation in vitro and glycolysis in vivo in TC CD4+ T cells (A–C) p4EBP1 and pS6 expression (MFI) in Tn (A), Tem (B), and Treg (C) cells gated from TC and B6 total CD4+ T cells incubated for 24 h with and without tryptamine. (D) Frequency of IFNγ-producing CD4+ T cells after 96 h activation with and without kynurenine. (E–H) Glycolysis stress assay on total CD4+ T cells from vehicle or tryptamine-treated TC mice. (E) Complete assay with indications of the glucose, oligomycin, and 2DG injections. (F) Basal ECAR before glucose injection. (F) Glycolysis: mean 3 values after glucose minus before glucose injections. (H) Ratio of basal OCR and ECAR. (A–D) Graphs show paired t-tests between treated and control cells for each strain and subset (n = 5 for A-C, n = 8 for D). (F–H) t tests (n = 9–12 from 2 cohorts). Graphs show individual mice with mean ± SEM ∗p < 0.05, ∗∗p < 0.01, ∗∗∗∗p < 0.0001.

References

    1. Agus A., Planchais J., Sokol H. Gut microbiota regulation of tryptophan metabolism in health and disease. Cell Host Microbe. 2018;23:716–724. doi: 10.1016/j.chom.2018.05.003. - DOI - PubMed
    1. Åkesson K., Pettersson S., Ståhl S., Surowiec I., Hedenström M., Eketjäll S., Trygg J., Jakobsson P.J., Gunnarsson I., Svenungsson E., Idborg H. Kynurenine pathway is altered in patients with SLE and associated with severe fatigue. Lupus Sci. Med. 2018;5:e000254. doi: 10.1136/lupus-2017-000254. - DOI - PMC - PubMed
    1. Azzouz D., Omarbekova A., Heguy A., Schwudke D., Gisch N., Rovin B.H., Caricchio R., Buyon J.P., Alekseyenko A.V., Silverman G.J. Lupus nephritis is linked to disease-activity associated expansions and immunity to a gut commensal. Ann. Rheum. Dis. 2019;78:947–956. doi: 10.1136/annrheumdis-2018-214856. - DOI - PMC - PubMed
    1. Bailis W., Shyer J.A., Zhao J., Canaveras J.C.G., Al Khazal F.J., Qu R., Steach H.R., Bielecki P., Khan O., Jackson R., et al. Distinct modes of mitochondrial metabolism uncouple T cell differentiation and function. Nature. 2019;571:403–407. doi: 10.1038/s41586-019-1311-3. - DOI - PMC - PubMed
    1. Belkaid Y., Harrison O.J. Homeostatic immunity and the microbiota. Immunity. 2017;46:562–576. doi: 10.1016/j.immuni.2017.04.008. - DOI - PMC - PubMed