. 2022 Apr 9;25(5):104228.
doi: 10.1016/j.isci.2022.104228. eCollection 2022 May 20.

Deep neural network modeling identifies biomarkers of response to immune-checkpoint therapy

Affiliations

Deep neural network modeling identifies biomarkers of response to immune-checkpoint therapy

Yuqi Kang et al. iScience. .

Abstract

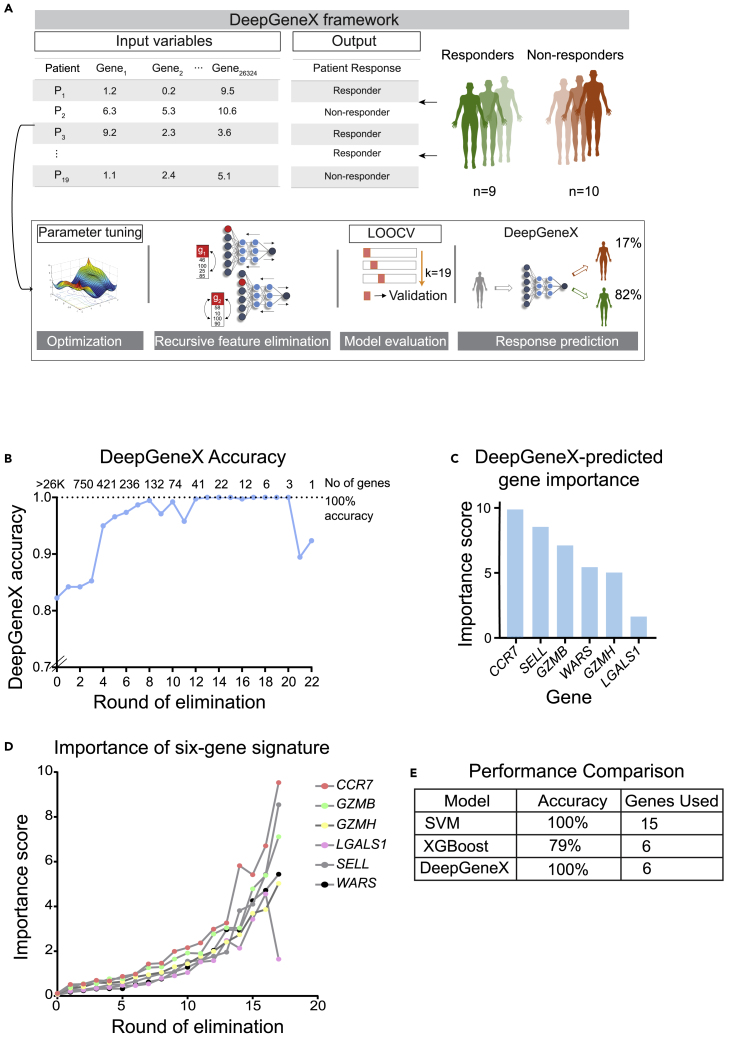
Immunotherapy has shown significant promise as a treatment for cancer, such as lung cancer and melanoma. However, only 10%-30% of the patients respond to treatment with immune checkpoint blockers (ICBs), underscoring the need for biomarkers to predict response to immunotherapy. Here, we developed DeepGeneX, a computational framework that uses advanced deep neural network modeling and feature elimination to reduce single-cell RNA-seq data on ∼26,000 genes to six of the most important genes (CCR7, SELL, GZMB, WARS, GZMH, and LGALS1), that accurately predict response to immunotherapy. We also discovered that the high LGALS1 and WARS-expressing macrophage population represent a biomarker for ICB therapy nonresponders, suggesting that these macrophages may be a target for improving ICB response. Taken together, DeepGeneX enables biomarker discovery and provides an understanding of the molecular basis for the model's predictions.

Keywords: Artificial intelligence; Cancer; Gene network; Immune response; Neural networks.


Conflict of interest statement

TSG and SV have filed for patent protection on the DeepGeneX approach. No other authors have any competing interests. TSG serves on the editorial board of iScience.

Figures

None
Graphical abstract
Figure 1
Figure 1
Modeling single-cell RNA seq data from melanoma patients for immunotherapy response (A) The UMAP (Uniform Manifold Approximation and Projection) and bar plot (B) showing the immune cell distribution between nonresponders and responders of the checkpoint immunotherapy. (C) The performance of SVM (support vector machine)-based model (left) and that of XGBoost model (right) using all immune cells. (D) The marker genes and corresponding coefficient or feature importance scores from the optimal SVM and XGBoost models.
Figure 2
Figure 2
DeepGeneX identifies genesets that can predict patient response to immunotherapy (A) A schematic illustration of DeepGeneX framework. (B) A plot showing the LOOCV accuracy of DeepGeneX after each round of feature elimination. The number of genes used to build the model in each round is also indicated. (C) The importance score of the top six genes predicted by DeepGeneX. (D) A plot showing the importance score of the top six genes predicted by DeepGeneX in each round of recursive gene elimination. (E) A table comparing the performance of three predictive models.
Figure 3
Figure 3
Expression and distribution of DeepGeneX-predicted marker genes in responders and nonresponders population (A) Violin plots comparing the overall expression distribution across all immune cells between responders and nonresponders. ∗∗∗p < 0.0005, Mann Whitney U test. (B) The UMAPs comparing the difference in the expression of the six marker genes: SELL, CCR7, GZMB, GZMH, LGALS1, and WARS in different immune cell populations.
Figure 4
Figure 4
Validation of DeepGeneX-identified marker genes in other cancers (A) Violin plots showing the difference in expression of six marker genes between responders and nonresponders in patients with basal cell carcinoma. ∗p < 0.05, ∗∗p < 0.005, ∗∗∗p < 0.0005, Mann Whitney U test. (B) Log rank test results comparing the overall survival difference between patients with the favorable expression pattern of marker genes (high SELL/CCR7 and low LGALS1/WARS) and patients with unfavorable expression patterns across all cancer types in the TCGA database. (C) Kaplan-Meier survival curve comparing patients with favorable/unfavorable marker genes' expression pattern within TCGA-SKCM (melanoma) dataset, p-val < 0.005, log rank test.
Figure 5
Figure 5
Pathway enrichment and cell-cell interactions of Mφ LW-high macrophages (A) GO pathways enriched in Mφ LW-high from nonresponders compared with macrophages from responders' population. NES; normalized enrichment score. (B) A dot plot showing the expression and distribution of ligands predominantly secreted by macrophages (in red) that could contribute to the CD8 T cell difference between responders and nonresponders. (C) A heatmap showing the potential targeted genes in CD8 T cells in response to ligands expressed in nonresponders' macrophages. Ligands with bold italic font are differentially expressed in Mφ LW-high only.

References

    1. Abebayehu D., Spence A., Boyan B.D., Schwartz Z., Ryan J.J., McClure M.J. Galectin-1 promotes an M2 macrophage response to polydioxanone scaffolds. J. Biomed. Mater. Res. A. 2017;105:2562–2571. - PMC - PubMed
    1. Bai R., Lv Z., Xu D., Cui J. Predictive biomarkers for cancer immunotherapy with immune checkpoint inhibitors. Biomark. Res. 2020;8:1–17. - PMC - PubMed
    1. Binnewies M., Roberts E.W., Kersten K., Chan V., Fearon D.F., Merad M., Coussens L.M., Gabrilovich D.I., Ostrand-Rosenberg S., Hedrick C.C. Understanding the tumor immune microenvironment (TIME) for effective therapy. Nat. Med. 2018;24:541–550. - PMC - PubMed
    1. Browaeys R., Saelens W., Saeys Y. NicheNet: modeling intercellular communication by linking ligands to target genes. Nat. Methods. 2020;17:159–162. - PubMed
    1. Brown J., Wallet M.A., Krastins B., Sarracino D., Goodenow M.M. Proteome bioprofiles distinguish between M1 priming and activation states in human macrophages. J. Leukoc. Biol. 2010;87:655–662. - PMC - PubMed