

Computational Metrics Can Provide Quantitative Values to Characterize Arthroscopic Field of View
- PMID: 35494292
- PMCID: PMC9042744
- DOI: 10.1016/j.asmr.2021.10.017
Computational Metrics Can Provide Quantitative Values to Characterize Arthroscopic Field of View
Abstract
Purpose: The purpose of this study was to determine the inter-rater reliability of arthroscopic video quality, determine correlation between surgeon rating and computational image metrics, and facilitate a quantitative methodology for assessing video quality.
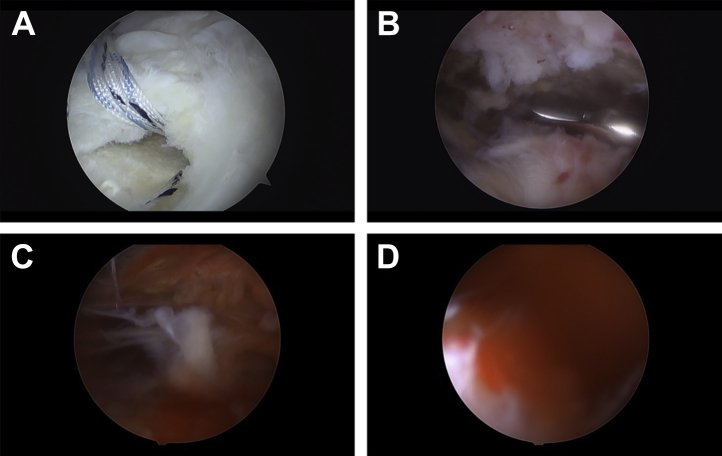
Methods: Five orthopaedic surgeons reviewed 60 clips from deidentified arthroscopic shoulder videos and rated each on a four-point Likert scale from poor to excellent view. The videos were randomized, and the process was completed a total of three times. Each user rating was averaged to provide a user rating per clip. Each video frame was processed to calculate brightness, local contrast, redness (used to represent bleeding), and image entropy. Each metric was then averaged over each frame per video clip, providing four image quality metrics per clip.
Results: Inter-rater reliability for grading video quality had an intraclass correlation of .974. Improved image quality rating was positively correlated with increased entropy (.8142; P < .001), contrast (.8013; P < .001), and brightness (.6120; P < .001), and negatively correlated with redness (-.8626; P < .001). A multiple linear regression model was calculated with the image metrics used as predictors for the image quality ranking, with an R-squared value of .775 and root mean square error of .42.
Conclusions: Our study demonstrates strong inter-rater reliability between surgeons when describing image quality and strong correlations between image quality and the computed image metrics. A model based on these metrics enables automatic quantification of image quality.
Clinical relevance: Video quality during arthroscopic cases can impact the ease and duration of the case which could contribute to swelling and complication risk. This pilot study provides a quantitative method to assess video quality. Future works can objectively determine factors that affect visualization during arthroscopy and identify options for improvement.
© 2021 The Authors.
Figures


References
-
- Kim S., Bosque J., Meehan J.P., Jamali A., Marder R. Increase in outpatient knee arthroscopy in the United States: A comparison of National Surveys of Ambulatory Surgery, 1996 and 2006. J Bone Joint Surg. 2011;93:35–41. - PubMed
-
- Paxton E.S., Backus J., Keener J., Brophy R.H. Shoulder arthroscopy: Basic principles of positioning, anesthesia, and portal anatomy. J Am Acad Orthopaed Surg. 2013;21:332–342. - PubMed
-
- Randelli P.S., Cucchi D. In: Arthroscopy basic to advanced. Randelli P., Dejour D., van Dijk C.N., Denti M., Seil R., editors. Springer; New York: 2016. Surgery set-up, instrumentations and electronic equipment; pp. 13–19.
-
- Van Montfoort D.O., van Kampen P.M., Huijsmans P.E. Improvement of clarity of visual field and shortening of total operation time. A randomized controlled trial. Arthroscopy. 2016;32:436–444. - PubMed
-
- Avery D.M., III, Gibson B.W., Carolan G.F. Surgeon-rated visualization in shoulder arthroscopy: A randomized blinded controlled trial comparing irrigation fluid with and without epinephrine. Arthroscopy. 2015;31:12–18. - PubMed
LinkOut - more resources
Full Text Sources
