. 2019 Sep;2(9):1900088.
doi: 10.1002/adtp.201900088. Epub 2019 Jul 26.

Indocyanine Green-Coated Gold Nanoclusters for Photoacoustic Imaging and Photothermal Therapy

Affiliations

Indocyanine Green-Coated Gold Nanoclusters for Photoacoustic Imaging and Photothermal Therapy

Elizabeth Higbee-Dempsey et al. Adv Ther (Weinh). 2019 Sep.

Abstract

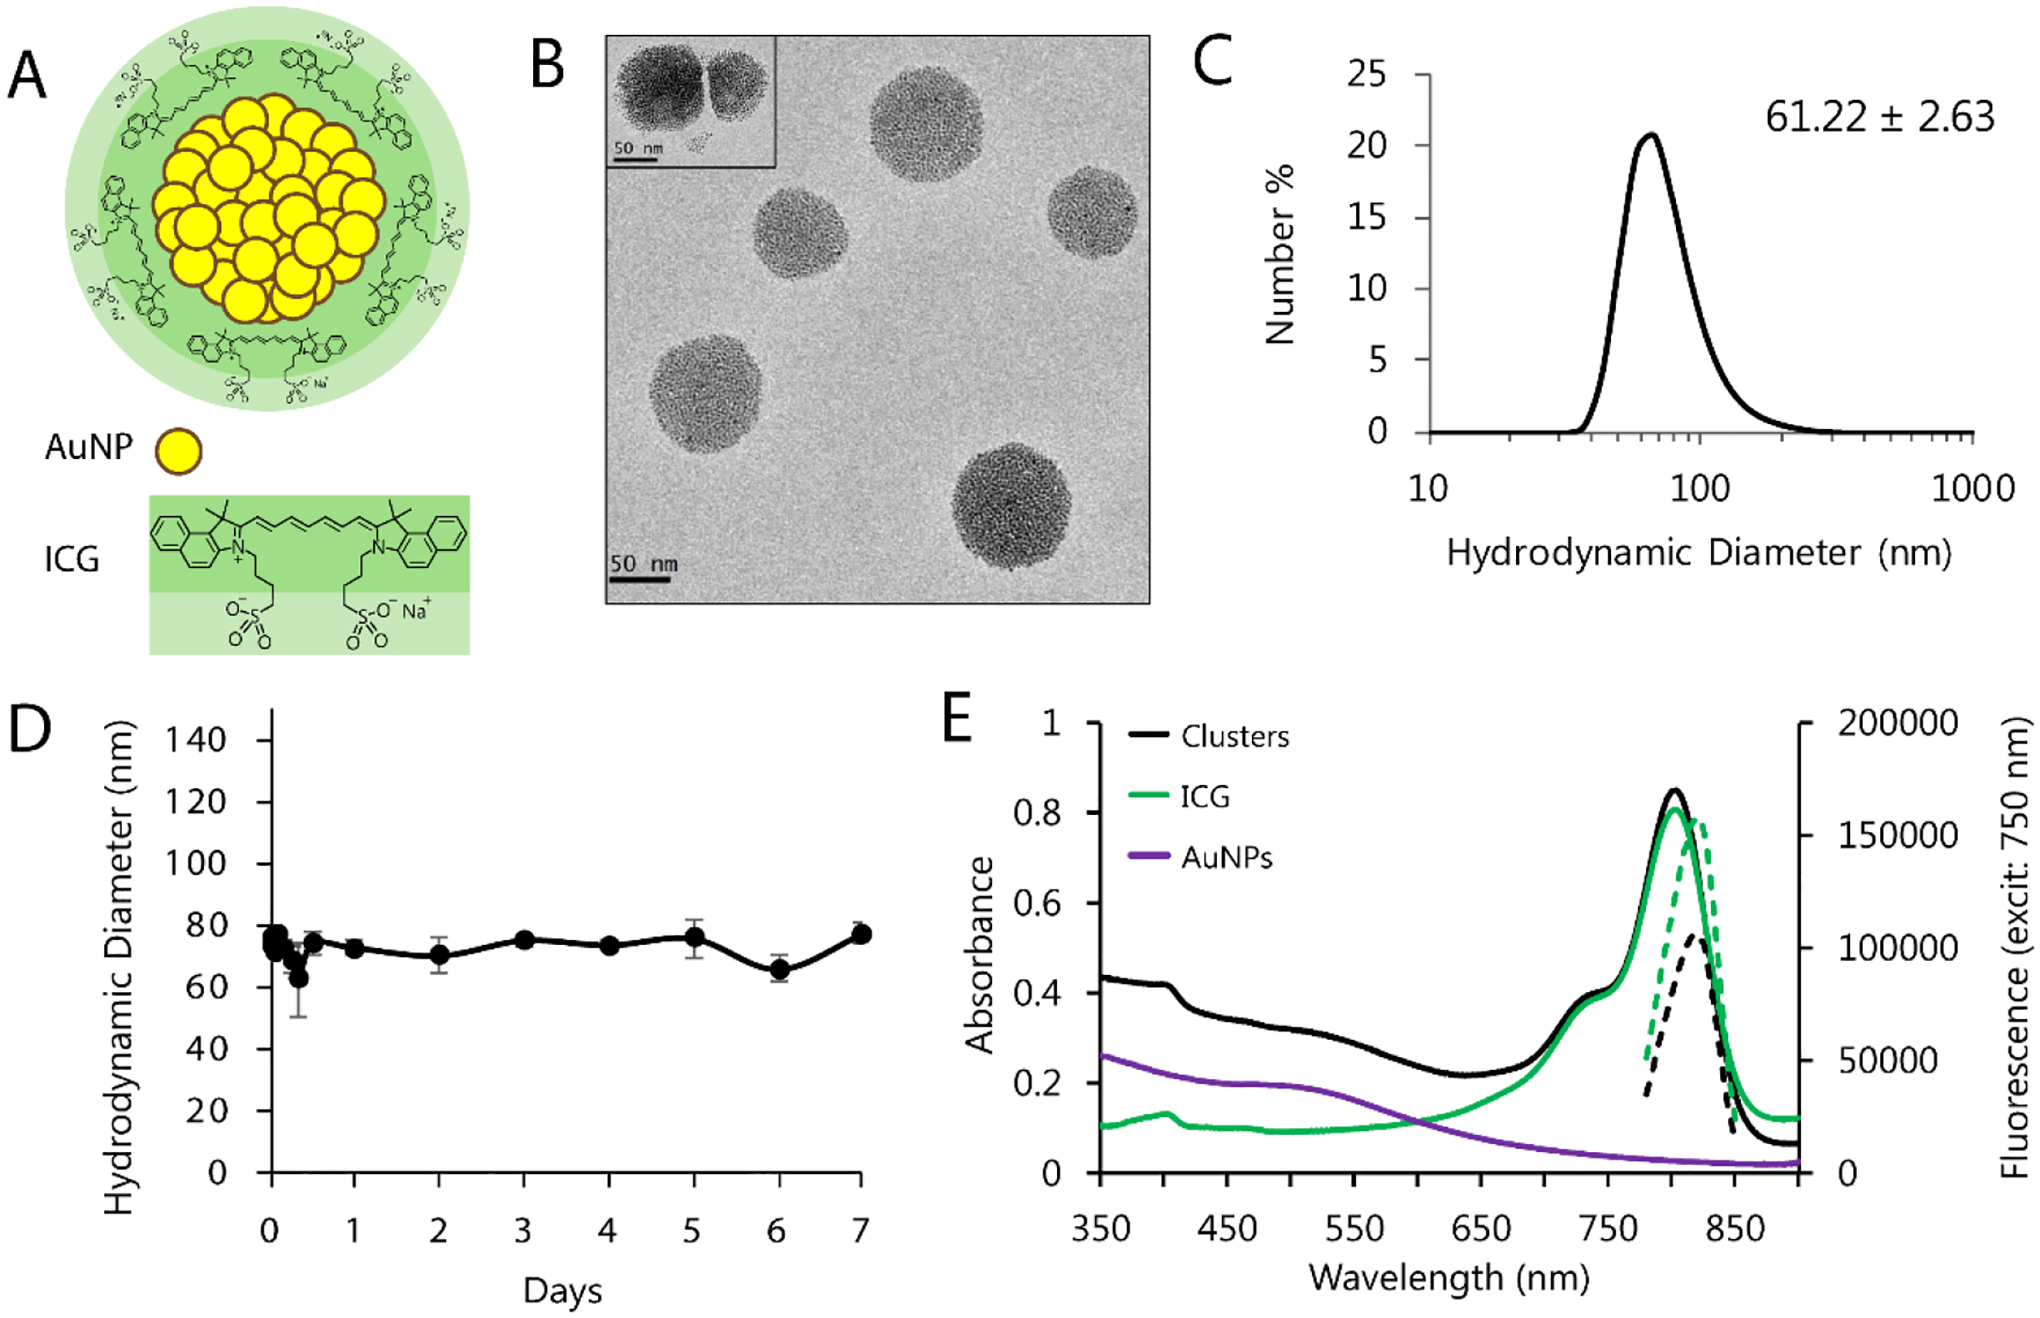
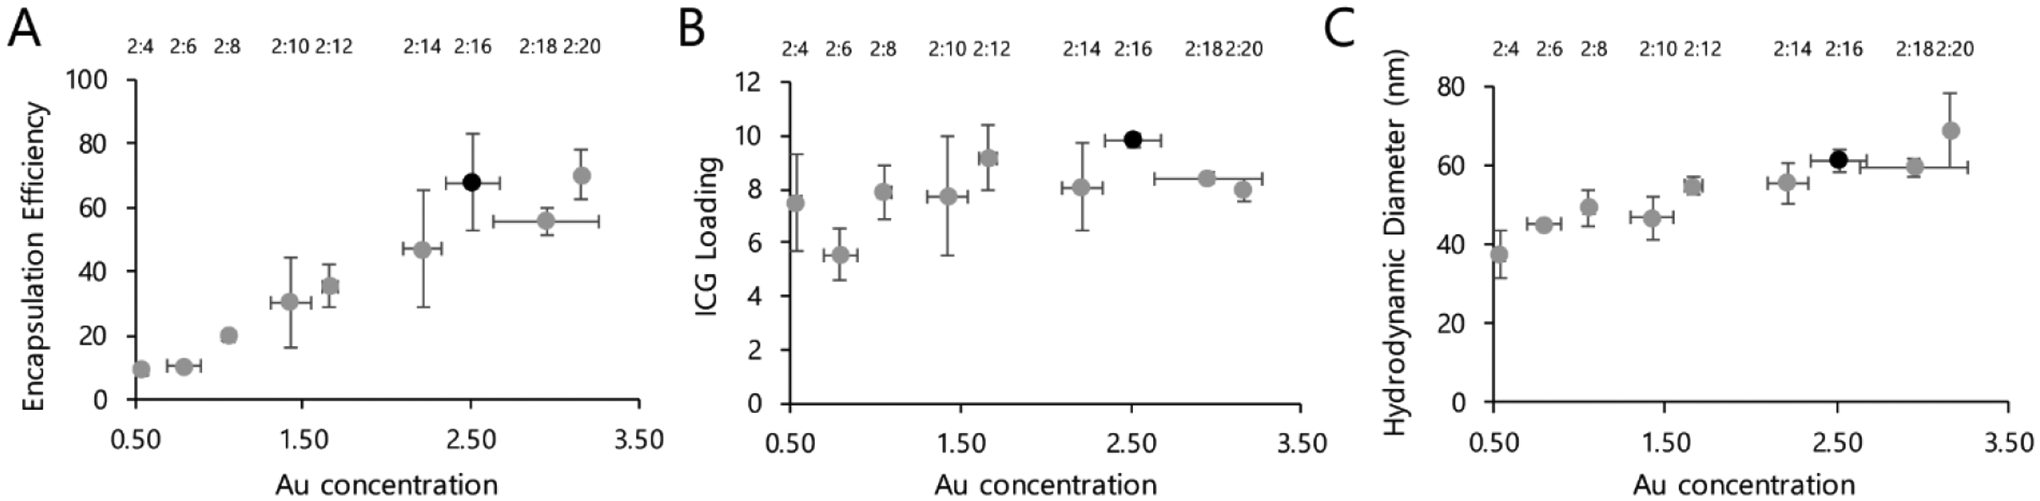
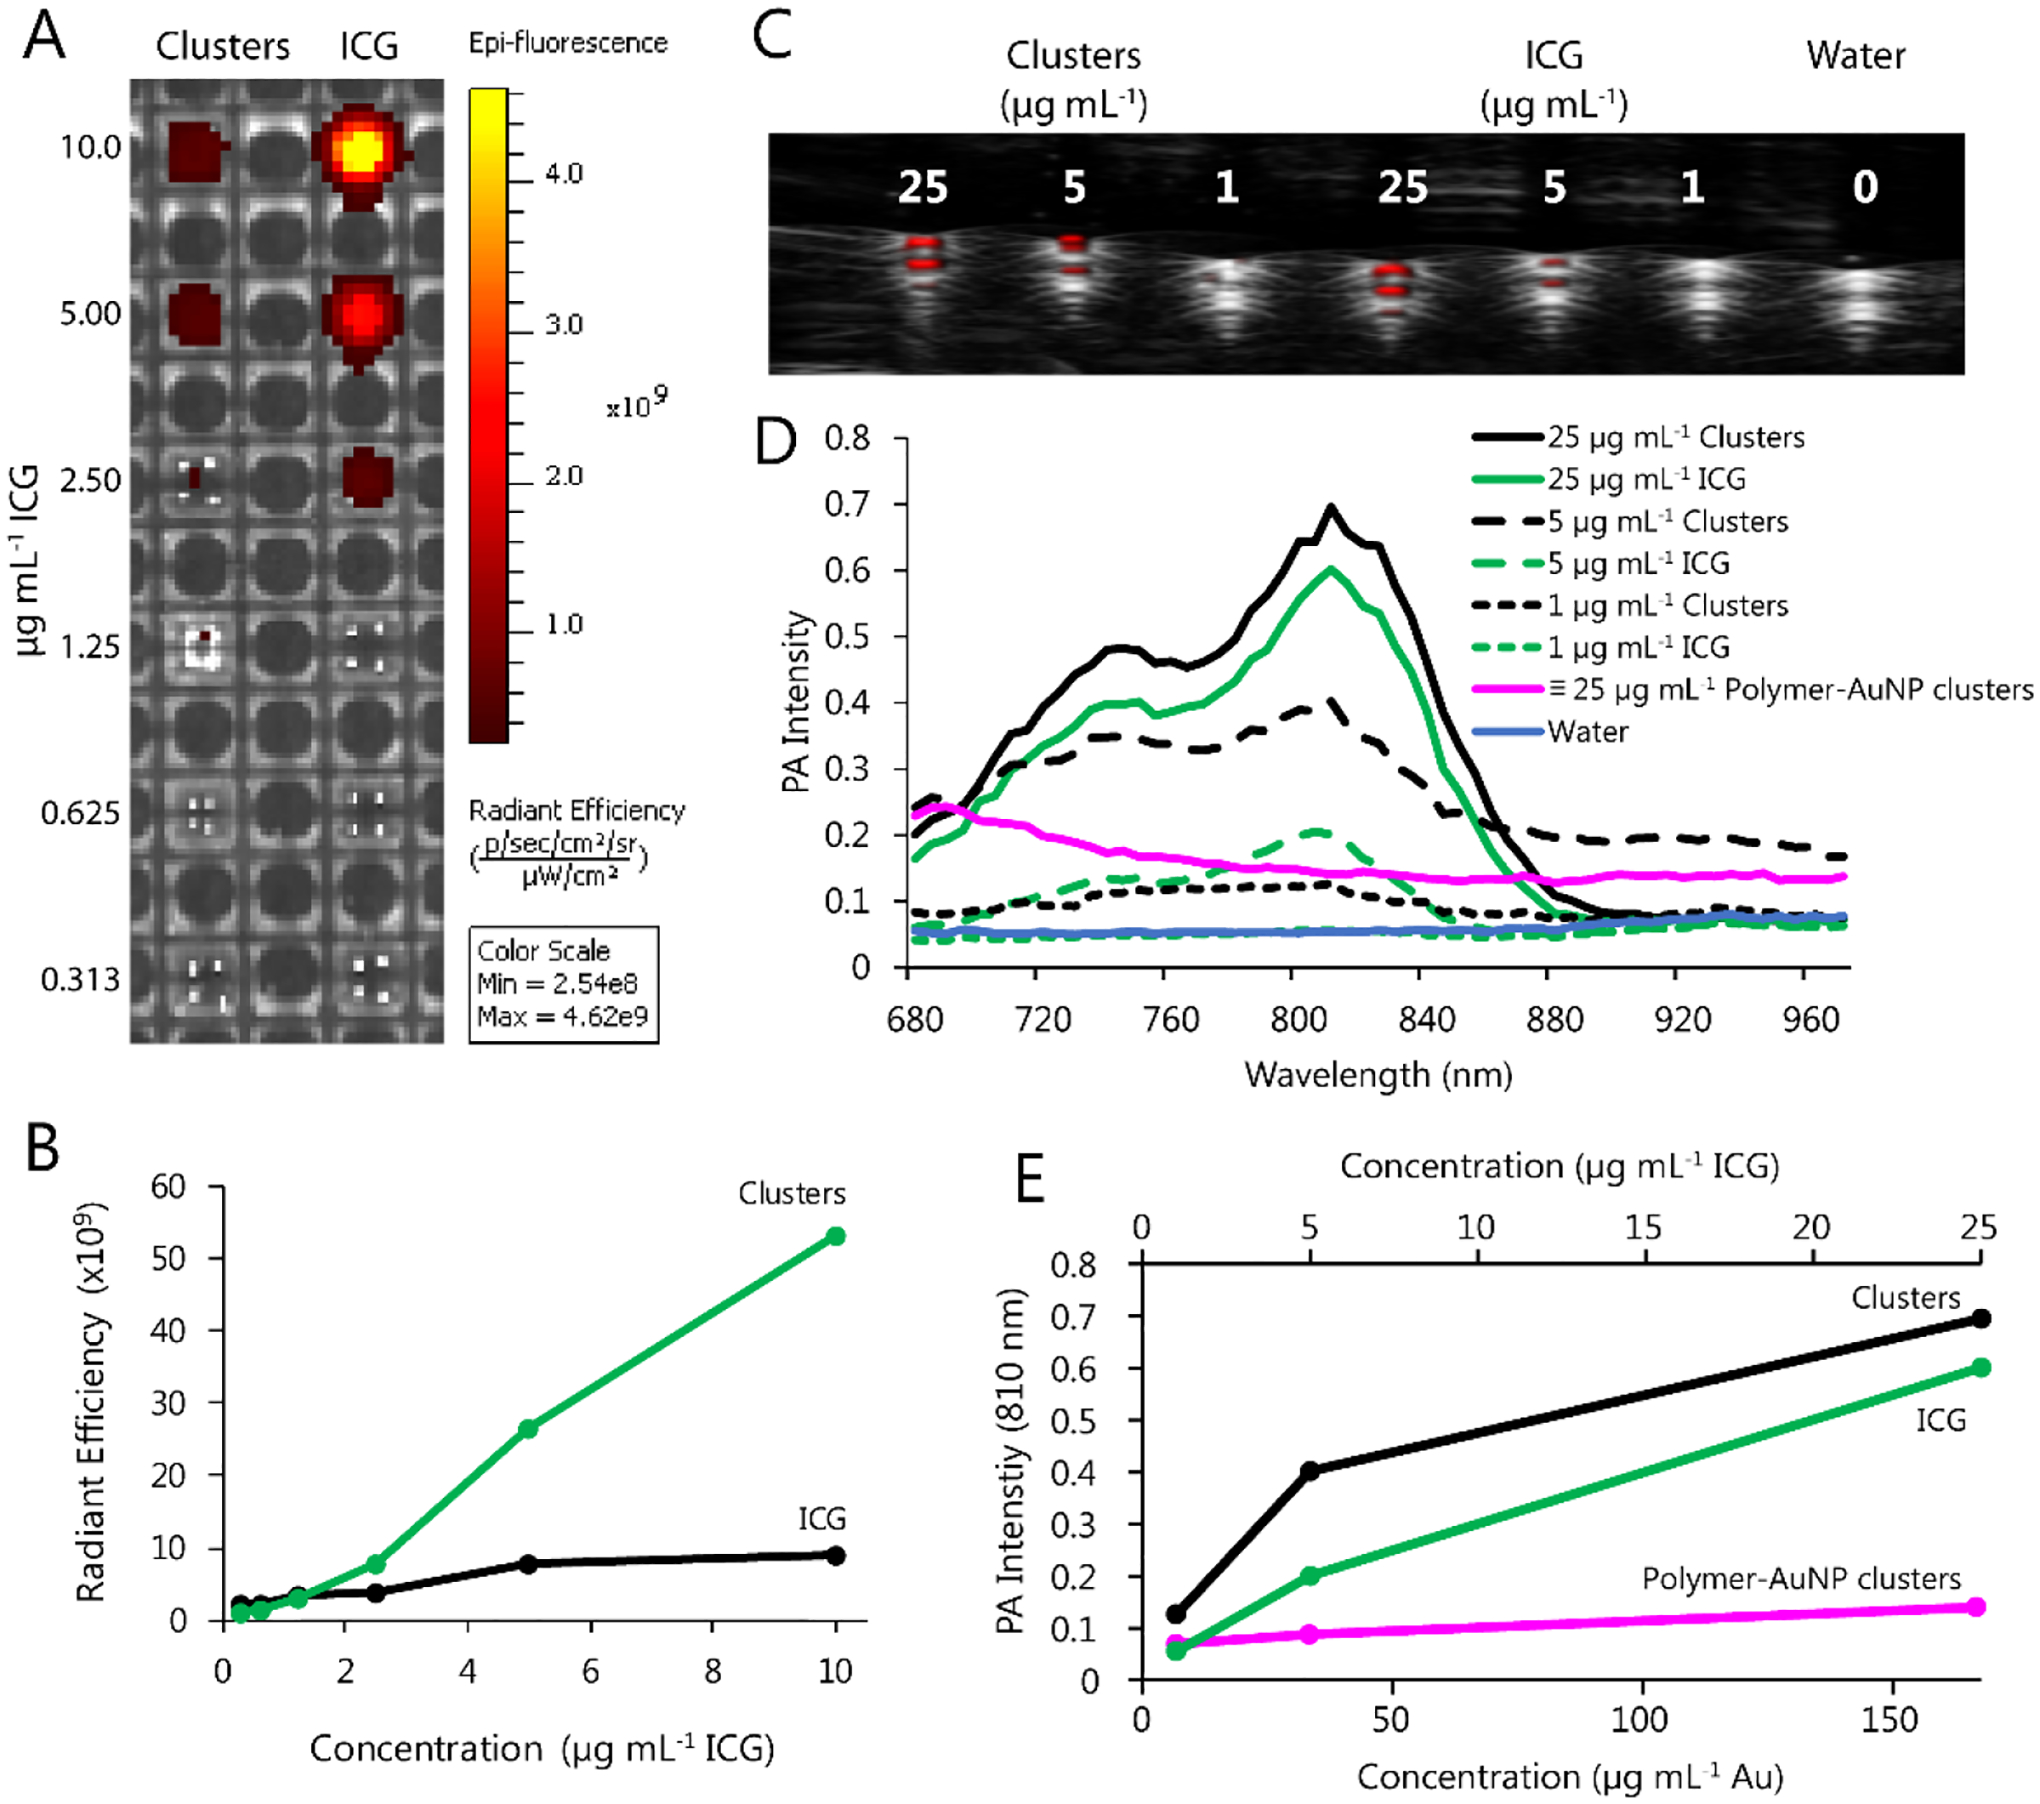
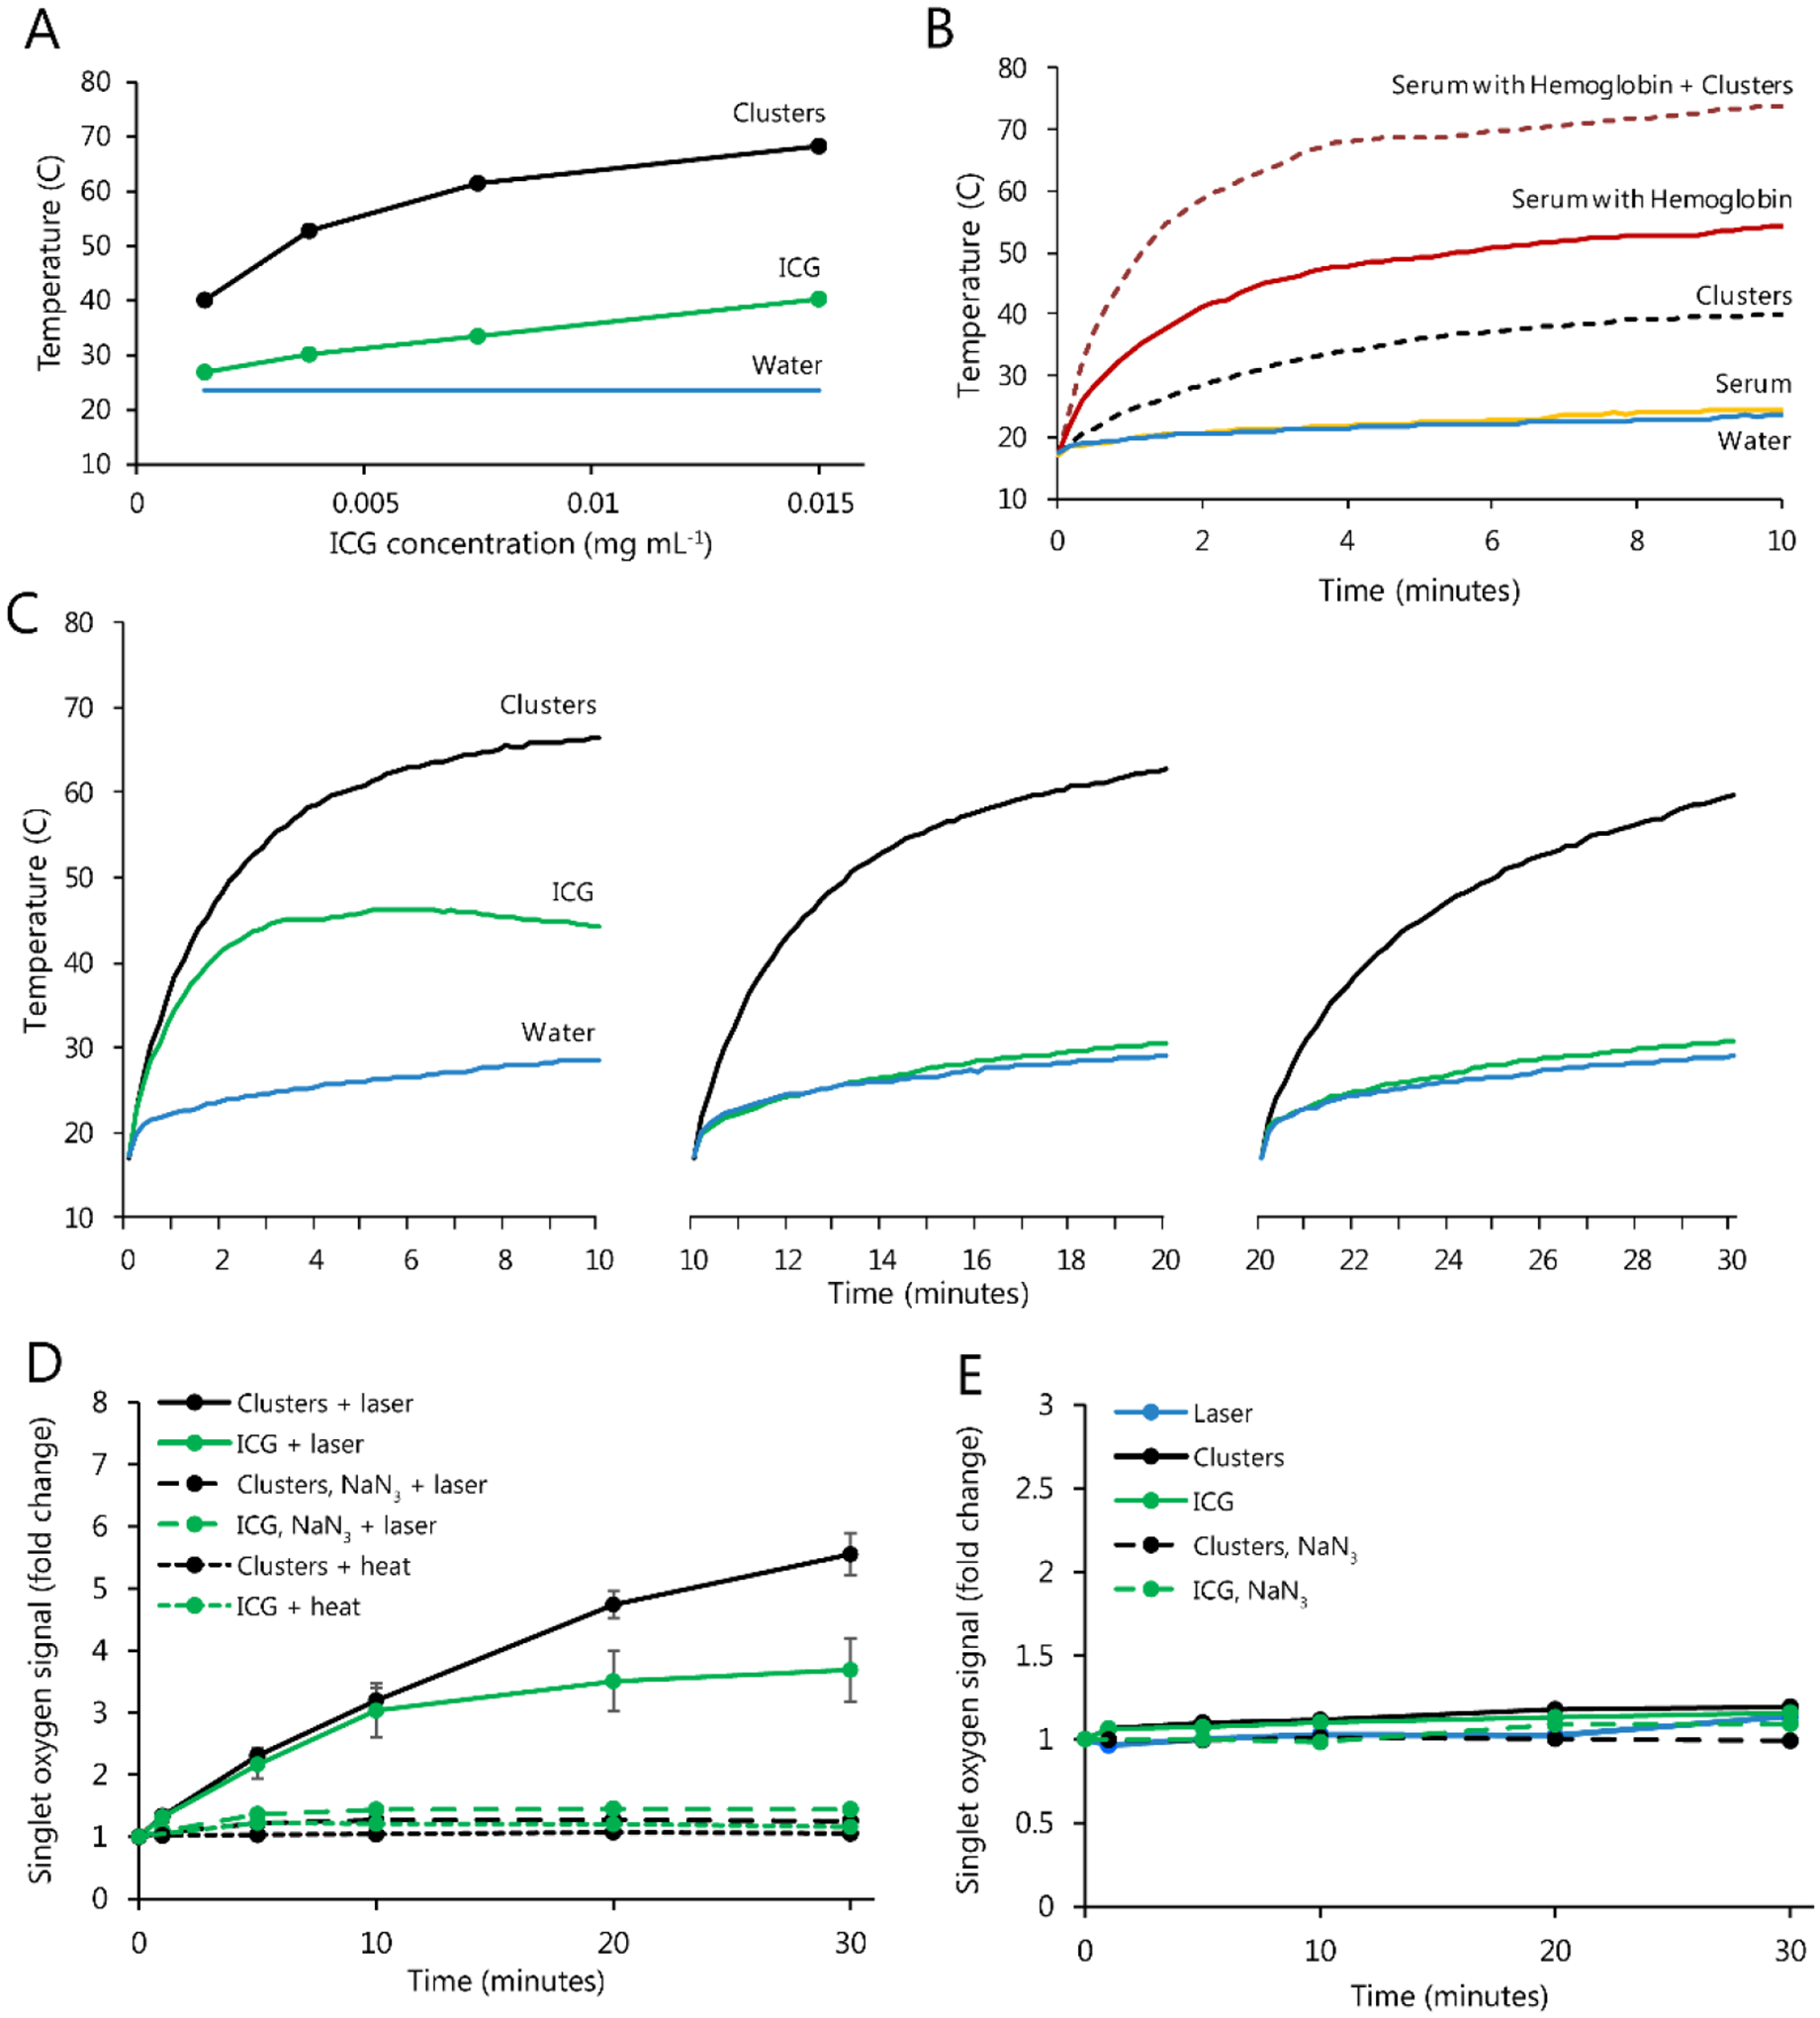
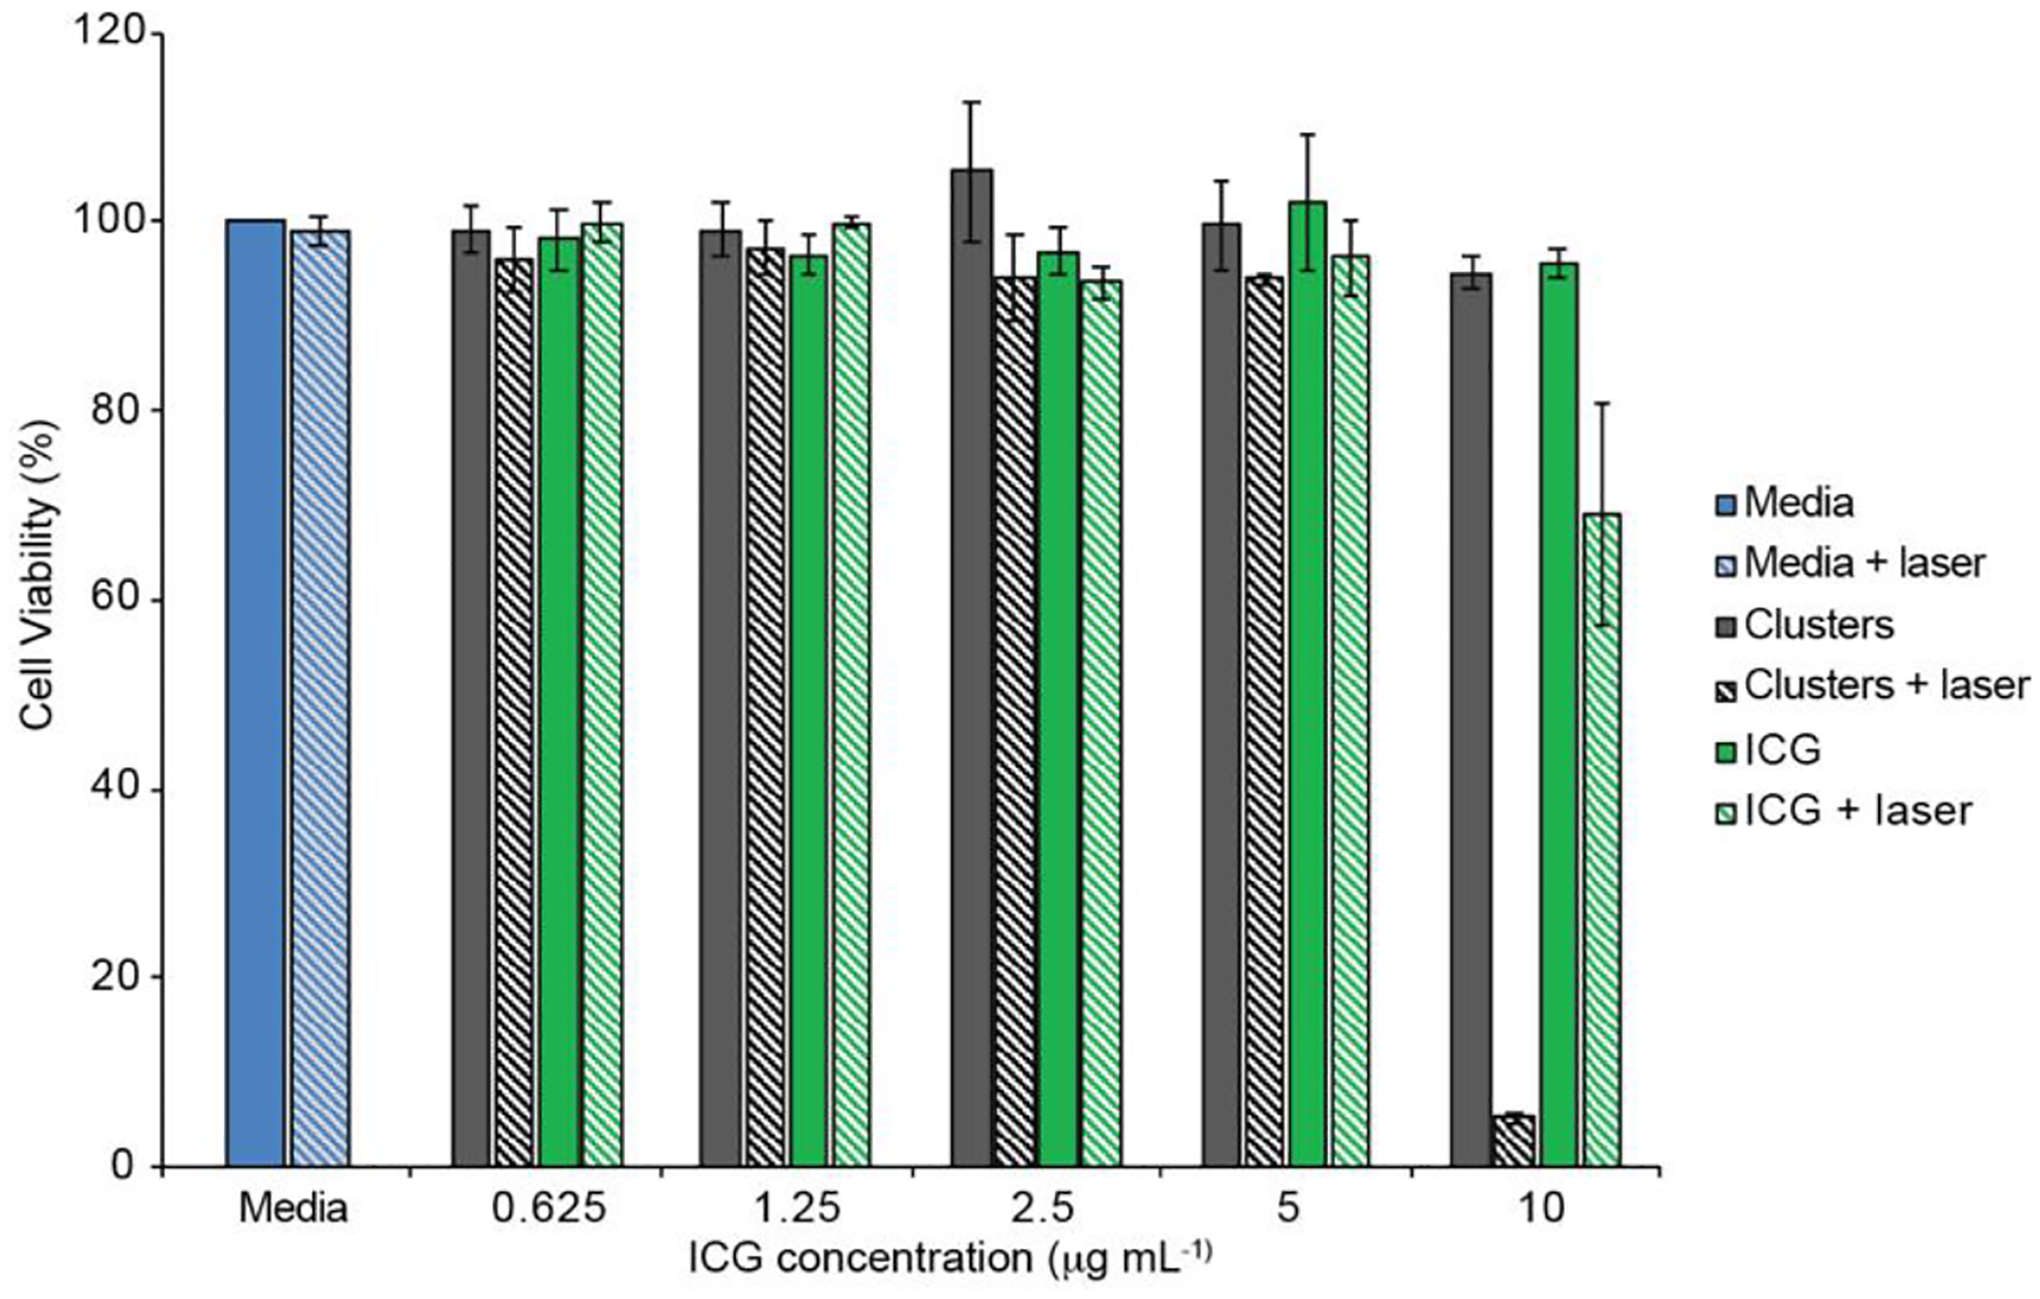
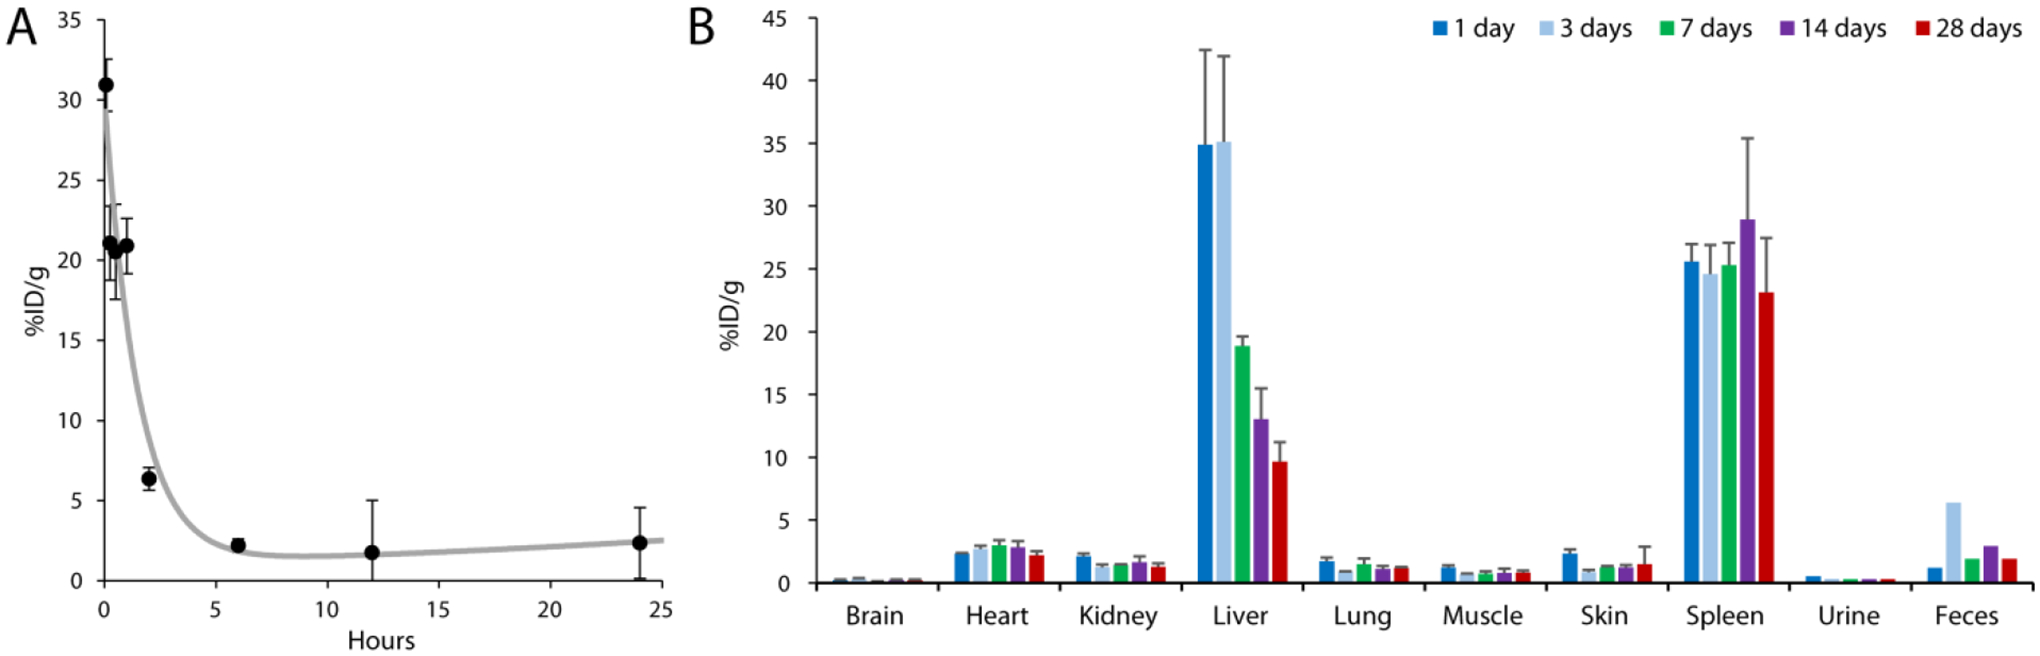
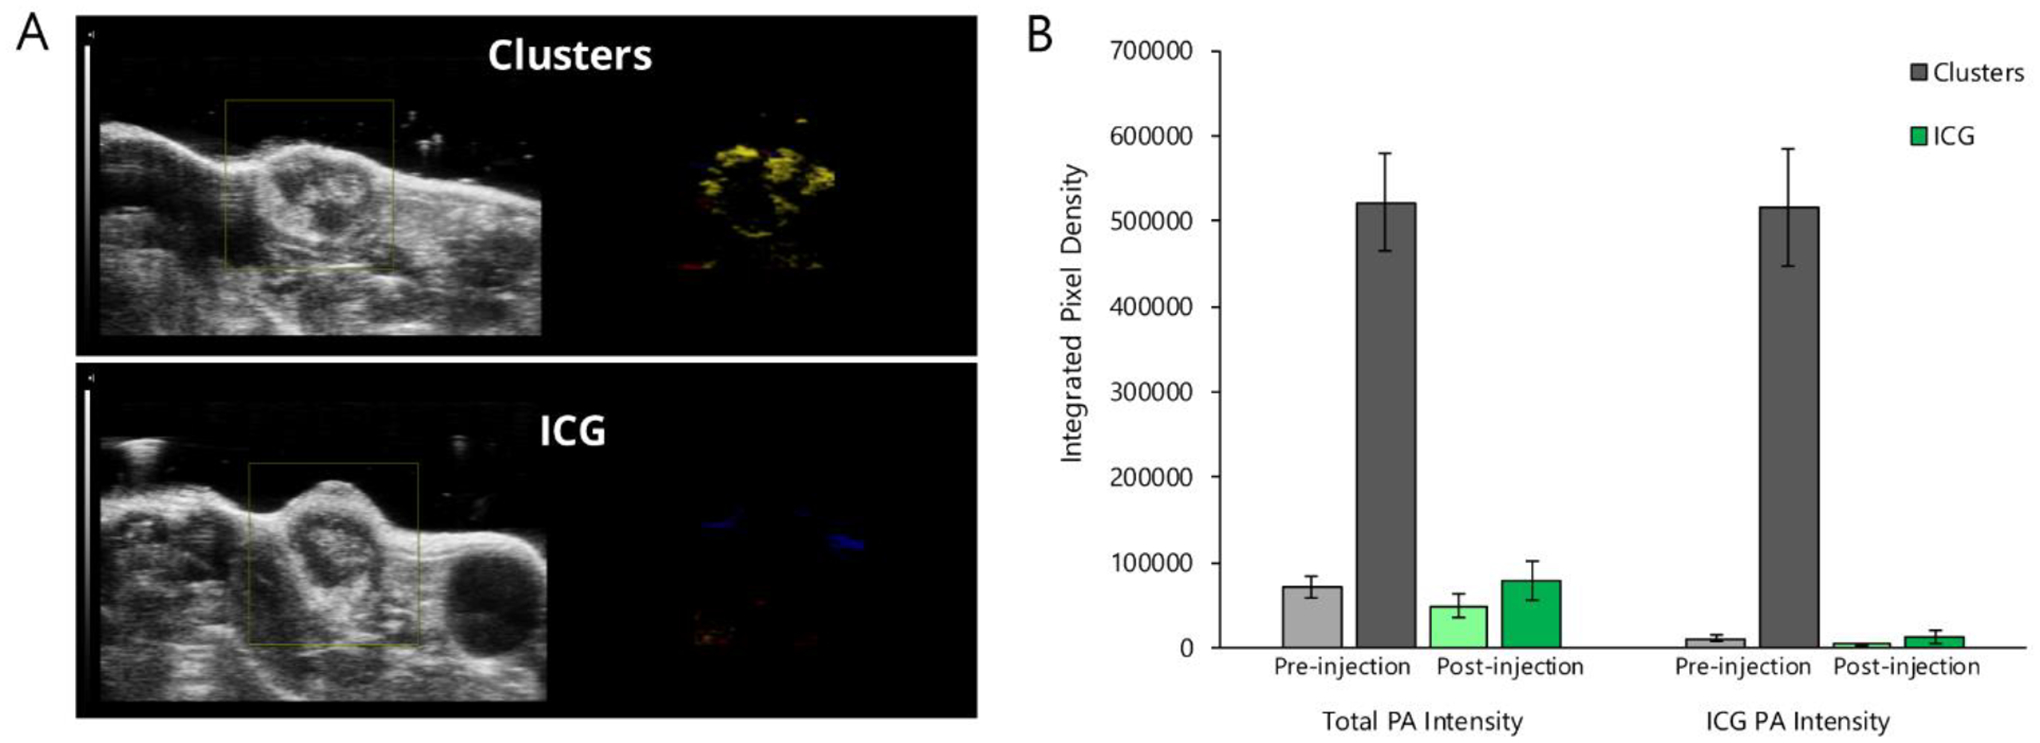
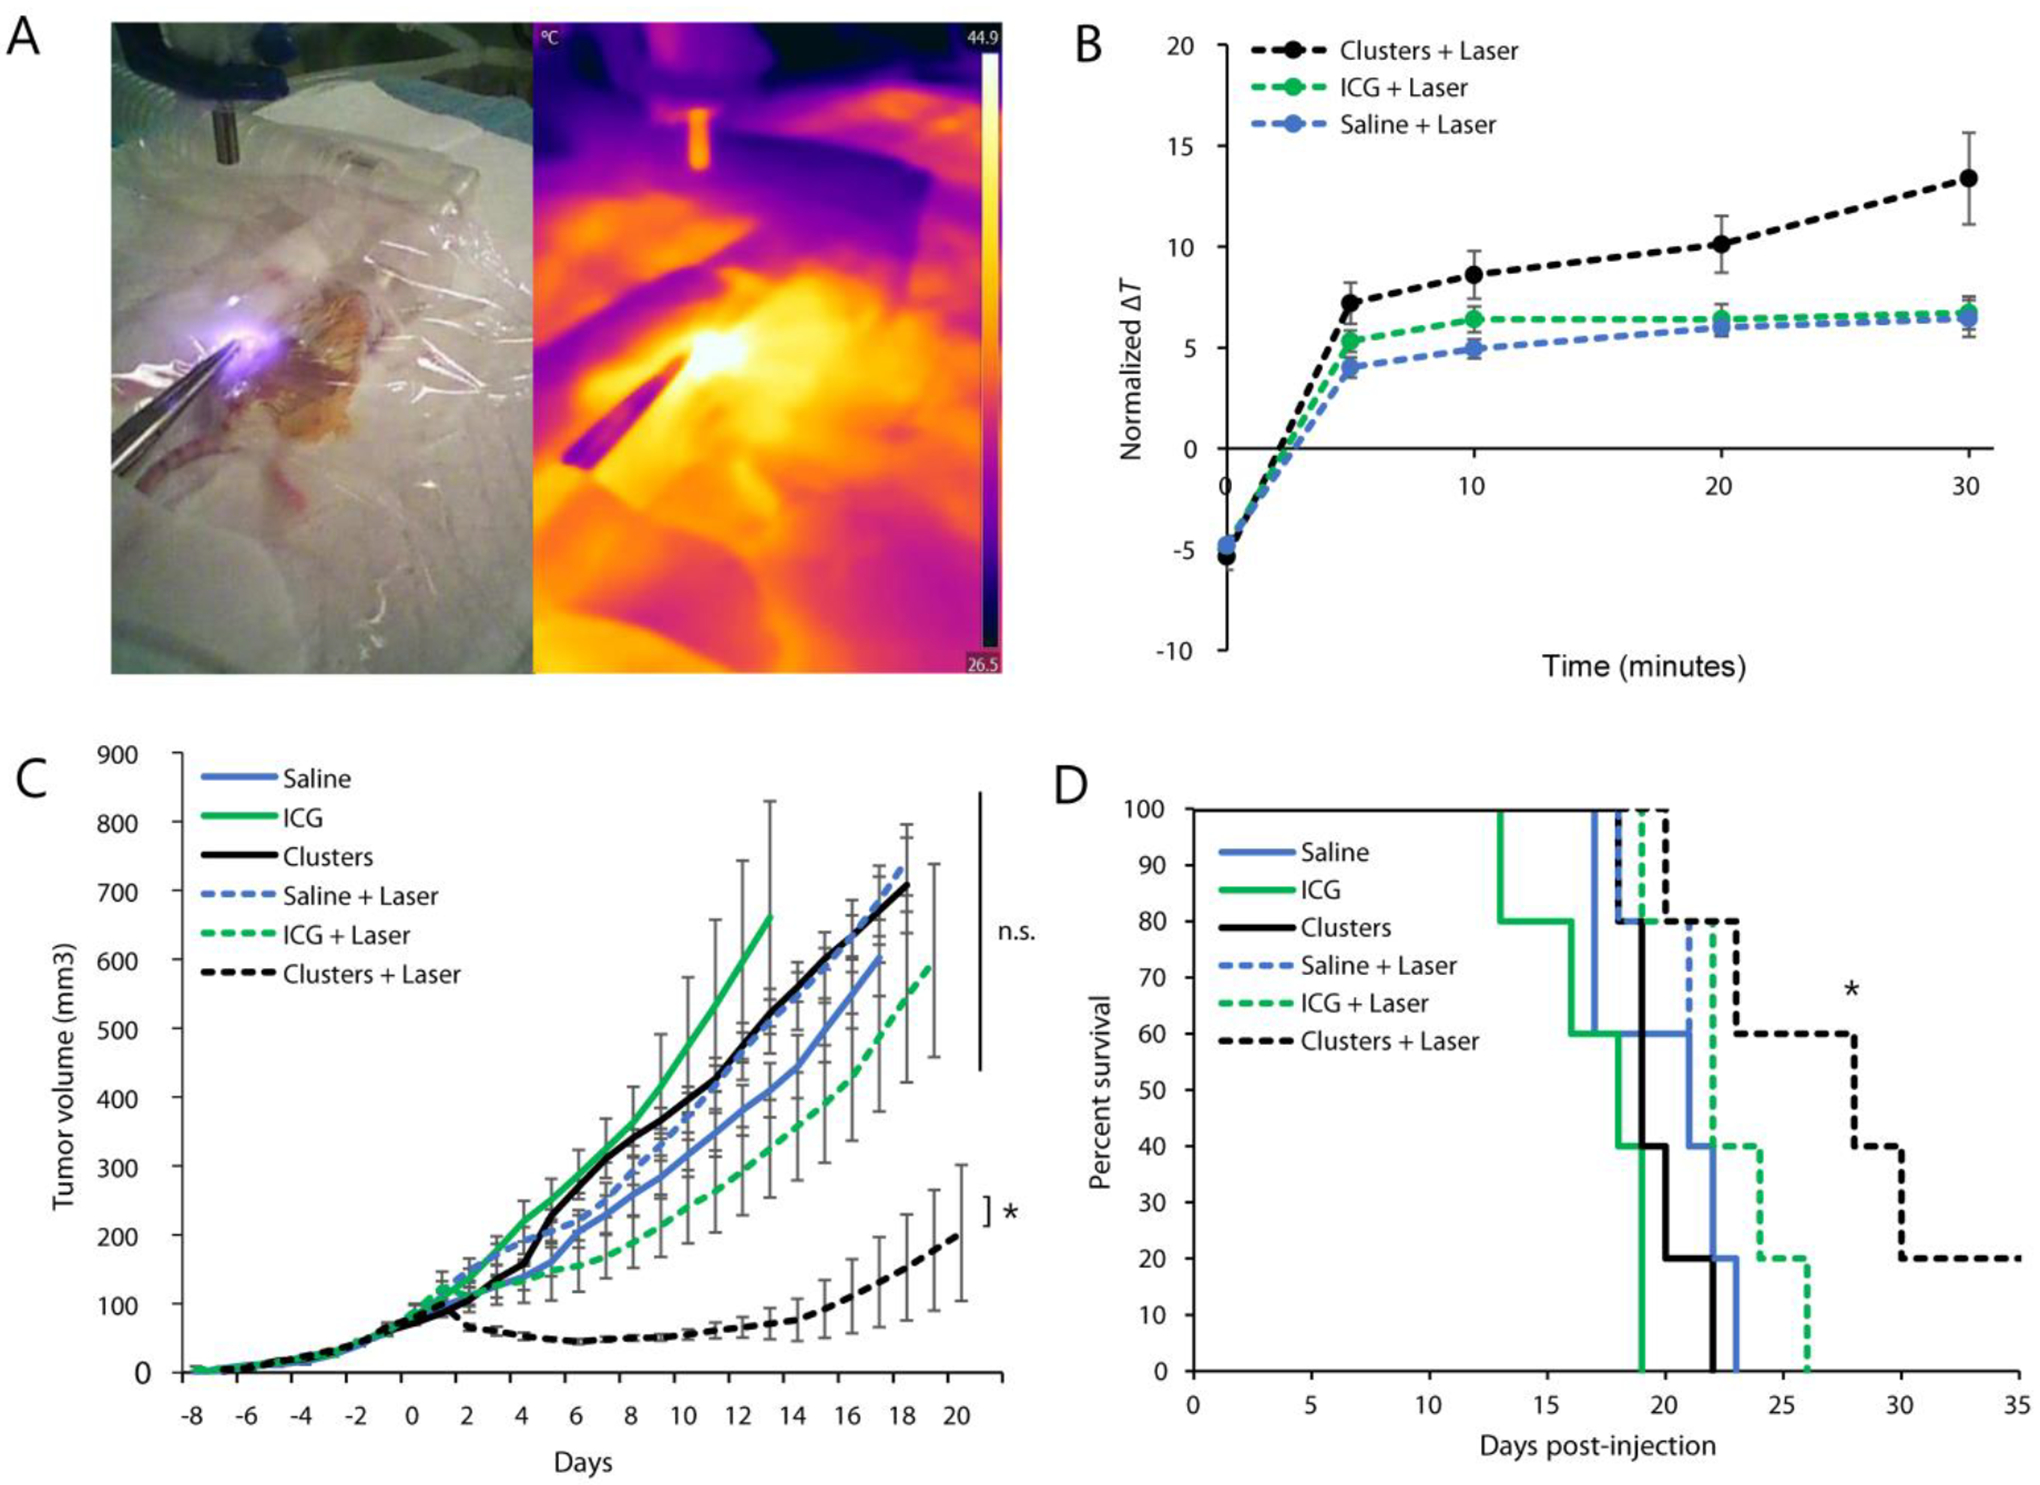
Traditional oncology treatment modalities are often associated with a poor therapeutic index. This has driven the development of new targeted treatment modalities, including several based on the conversion of optical light into heat energy (photothermal therapy, PTT) and sound waves (photoacoustic imaging, PA) that can be applied locally. These approaches are especially effective when combined with photoactive nanoparticles that preferentially accumulate in tissues of interest and thereby further increase spatiotemporal resolution. In this study, two clinically-used materials that have proven effective in both PTT and PA - indocyanine green and gold nanoparticles - were combined into a single nanoformulation. These particles, "ICG-AuNP clusters", incorporated high concentrations of both moieties without the need for additional stabilizing or solubilizing reagents. The clusters demonstrated high theranostic efficacy both in vitro and in vivo, compared with ICG alone. Specifically, in an orthotopic mouse model of triple-negative breast cancer, ICG-AuNP clusters could be injected intravenously, imaged in the tumor by PA, and then combined with near-infrared laser irradiation to successfully thermally ablate tumors and prolong animal survival. Altogether, this novel nanomaterial demonstrates excellent therapeutic potential for integrated treatment and imaging.

Keywords: gold nanoparticles; indocyanine green; photoacoustic imaging; photothermal therapy; theranostic.


Figures

Figure 1.
Figure 1.
A) Schematic of ICG-AuNP clusters, consisting of 2-nm dodecanethiol-coated gold nanoparticles (AuNP) packed within the core and coated with a dense outer layer of indocyanine green (ICG). B) TEM images of clusters. C) DLS of clusters in water showing hydrodynamic diameter; the average hydrodynamic diameter was 61.22 ± 2.63 nm (standard deviation, n = 2 particle batches). D) Peak hydrodynamic diameter of clusters in solution (water, 4°C, dark) over the course of one week. n = 3 measurements, ± SEM. E) Absorbance (solid lines) and fluorescence (dashed lines) of clusters dissolved in serum vs. equivalent concentrations of free ICG (3 μg mL−1 ICG) or dodecanethiol AuNPs (20 μg mL−1 Au). Cluster absorbance maximum = 803 nm; fluorescence maximum = 820 nm.
Figure 2.
Figure 2.
Multiple cluster formulations were synthesized by varying the ratio of ICG to AuNPs. ICG concentration was determined by absorbance, following dissolution in organic solvent; Au concentration was determined by ICP-OES. Black marker indicates the formulation selected for all other experiments. A) Encapsulation efficiency of ICG into particles, which was calculated by dividing the ICG:Au ratios of the reaction solutions after vs. before column purification (expressed as percentage). B) Loading efficiency of ICG within the purified particles, as calculated by the ICG concentration divided by Au concentration (expressed as percentage). C) Hydrodynamic diameter of the particles. n = 2 particle batches, ± SEM.
Figure 3.
Figure 3.
Phantom imaging of ICG-AuNP clusters in water vs. equivalent concentrations of free ICG and polymer-AuNP clusters. A) Fluorescence imaging (ex = 745, em = 820). B) Quantification of fluorescence signal intensity (radiant efficiency) as a function of ICG concentration. C) Photoacoustic imaging (PA gain 30–40 dB, priority 95%, distance 12 mm from the transducer; transducer axial resolution, 75 μm; broadband frequency, 13–24 MHz). D) Complete PA spectra at varying concentrations. ICG-AuNP clusters and free ICG are expressed as μg mL−1 ICG; polymer-AuNP clusters are shown at a gold dosage equivalent to that of the 25 μg mL−1 ICG-Au clusters (167 μg mL−1 Au). E) Quantification of PA signal intensity (810 nm) as a function of equivalent ICG-AuNP cluster, ICG, and polymer-AuNP cluster concentrations.
Figure 4.
Figure 4.
Solutions of ICG-AuNP clusters, free ICG, and various controls were prepared at room temperature and then irradiated at 808nm (1.2 W power, 0.1 cm2 area) continuously for 10–30 minutes. A) Solutions in water; final solution temperature is plotted. B) The temperature of water; fetal bovine serum; clusters (0.0015 mg mL−1 ICG) in water; hemoglobin (155 mg mL−1) in fetal bovine serum; and clusters and hemoglobin dissolved in serum at noted concentrations and heated for the indicated times. C) Solutions in water (0.015 mg mL−1 ICG), heated in multiple 10-minute increments and allowed to cool to room temperature between successive rounds. D) Clusters and free ICG (0.015 mg mL−1) were irradiated in the presence of Singlet Oxygen Sensor Green, which detects formation of reactive oxygen species. Controls included the following: samples containing sodium azide (10 mM), a known scavenger of singlet oxygen; and non-irradiated samples heated to equivalent temperatures by external heat application. E) Analogous studies were performed with laser irradiation alone and without irradiation.
Figure 5.
Figure 5.
MTT assay of 4T1 cells incubated with ICG-AuNP clusters, free ICG, or standard media for 24 hours. A subset of cells was irradiated at 808 nm (0.2 W cm−2) for the first 7 minutes. n = 3 wells, ± SEM.
Figure 6.
Figure 6.
ICG-AuNP clusters (30 mg kg−1 Au, 4.5 mg kg−1 ICG, I.V.) were administered to naïve C57BL/6 mice and biodistribution was determined in key tissue compartments by ICP-OES analysis of gold. Results expressed as percent injected dose per gram tissue. A) Blood pharmacokinetics for the first 24 hours post-injection. B) Tissue biodistribution for the first 28 days post-injection. n = 3 mice per timepoint, ± SEM; urine and feces represent one sample each, pooled from three mice.
Figure 7.
Figure 7.
Photoacoustic imaging of 4T1 orthotopic mammary tumors in mice receiving either free ICG or ICG-AuNP clusters (20 mg kg−1 ICG, 133 mg kg−1 Au, I.V.). A) Representative images of mouse tumors at 18 hours post-injection. Left, ultrasound image; right, spectrally unmixed photoacoustic (color) image of ICG/cluster distribution (yellow) as well as oxygenated (red) and deoxygenated (blue) hemoglobin signal. B) Quantification of PA signal intensity before injection and 18 hours after injection; left bars show total PA intensity, right bars show intensity associated with spectrally unmixed ICG/cluster signal. n = 3 mice per group, ± SEM.
Figure 8.
Figure 8.
Mice bearing 4T1 orthotopic breast tumors were injected with saline, free ICG, or ICG-AuNP clusters (20 mg kg−1 ICG, 133 mg kg−1 Au, I.V.); eighteen hours later, a subset of mice also received subcutaneous laser irradiation (0.7 W cm−2, 1.13 cm2 laser area, 30 minutes). n = 5 mice per group, for a total of six groups. A) Representative thermographic image during treatment. B) Quantification of thermal imaging data over time, expressed as the difference between tumor temperature and animal body temperatures (average temperatures in fixed-size regions of interest). C) Tumor growth curves, averaged among groups; day −1 = injection, day 0 = laser treatment or no treatment. D) Kaplan-Meier curve demonstrating animal survival. Data shown ± SEM; * = p < 0.05; n.s. = no statistical significance.

References

    1. Baskar R, Lee KA, Yeo R, Yeoh K-W, Int J Med Sci 2012, 9, 193–199. - PMC - PubMed
    1. Chen HHW, Kuo MT, Oncotarget 2017, 8, 62742–62758. - PMC - PubMed
    1. Wang H, Mu X, He H, Zhang X-D, Trends in Pharmacological Sciences 2018, 39, 24–48. - PubMed
    1. Power SP, Moloney F, Twomey M, James K, O’Connor OJ, Maher MM, World J Radiol 2016, 8, 902–915. - PMC - PubMed
    1. Pekkanen AM, DeWitt MR, Rylander MN, J Biomed Nanotechnol 2014, 10, 1677–1712. - PubMed

LinkOut - more resources