

The Causal Relationship Between Blood Lipids and Systemic Lupus Erythematosus Risk: A Bidirectional Two-Sample Mendelian Randomization Study
- PMID: 35495122
- PMCID: PMC9043646
- DOI: 10.3389/fgene.2022.858653
The Causal Relationship Between Blood Lipids and Systemic Lupus Erythematosus Risk: A Bidirectional Two-Sample Mendelian Randomization Study
Abstract
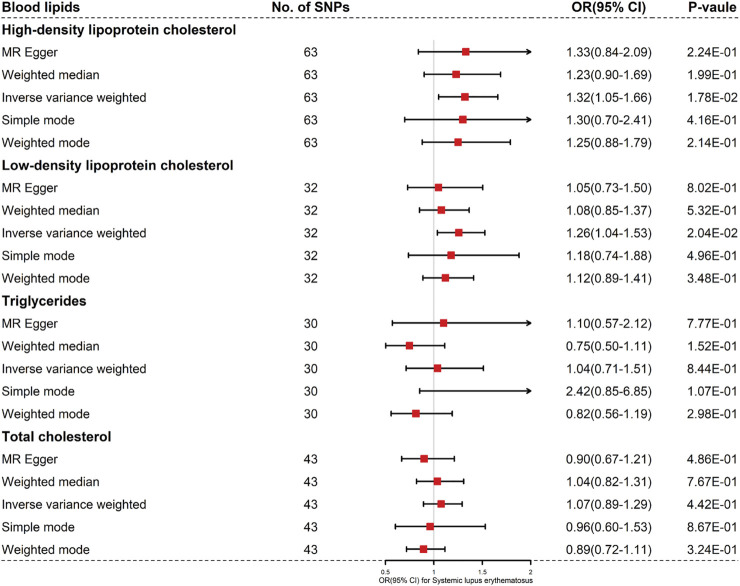
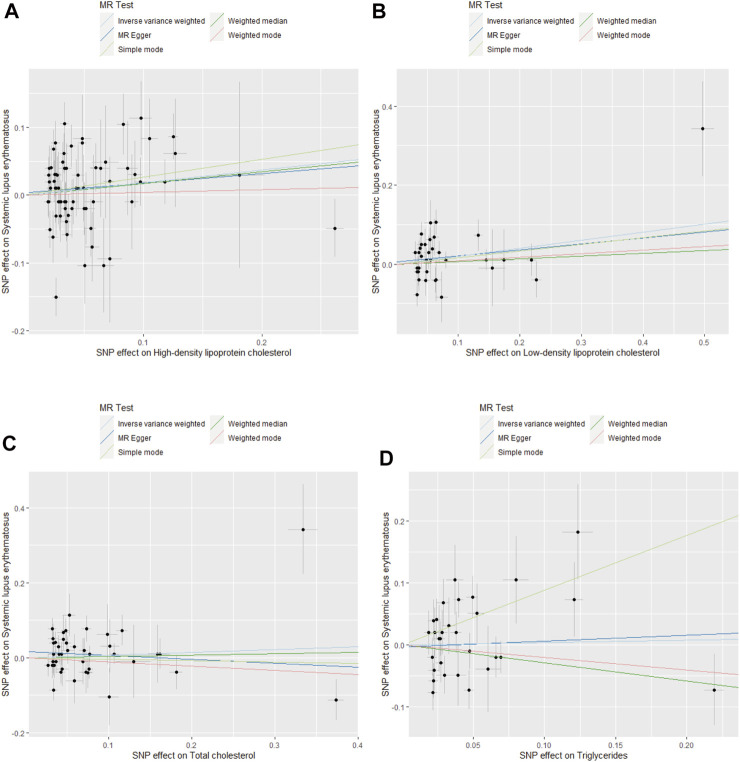
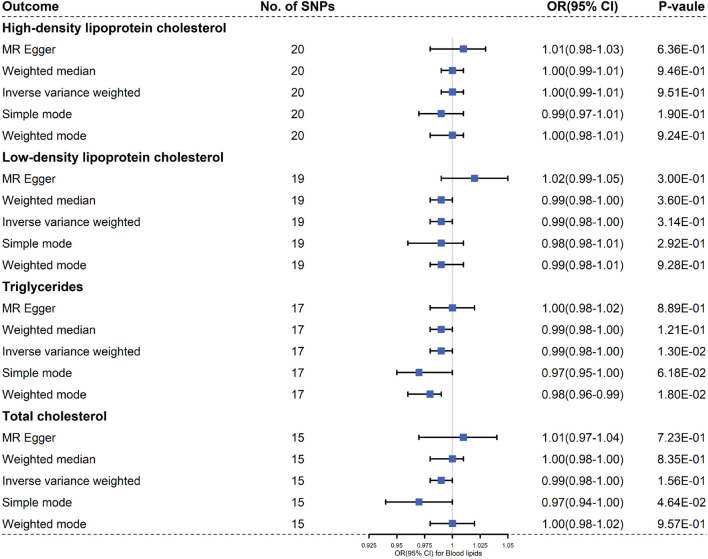
Background: Although observational studies have demonstrated that blood lipids were associated with systemic lupus erythematosus (SLE), the causality of this association remains elusive as traditional observational studies were prone to confounding and reverse causality biases. Here, this study attempted to reveal the potential causal link between SLE and the levels of four blood lipids (HDL cholesterol, LDL cholesterol, TG, and TC). Methods: Bidirectional two-sample Mendelian randomization (MR) was employed to explore the unconfounded causal associations between the four blood lipids and SLE. In addition, regression-based Multivariate MR (MVMR) to quantify the possible mediation effects of blood lipids on SLE. After a rigorous evaluation of the quality of studies, the single-nucleotide polymorphisms (SNPs) associated with the four blood lipids were selected from the Global Lipids Genetic Consortium (GLGC) consisted of 188,577 individuals of European ancestry, and the SNPs related to SLE were selected from a large-scale genome-wide association study (GWAS) database named IEU GWAS. Subsequently, MR analyses were conducted with inverse-variance weighted (IVW), weighted median, weighted mode, simple mode, and MR-Egger regression. Sensitivity analyses were performed to verify whether heterogeneity and pleiotropy led to bias in the MR results. Results: Bidirectional two-sample MR results demonstrated that there was no significant causal association between SLE and the four blood lipids (When setting SLE as outcome, HDL cholesterol and SLE, IVW OR: 1.32, 95% CI: 1.05∼1.66, p = 1.78E-02; LDL cholesterol and SLE, IVW OR: 1.26, 95% CI: 1.04∼1.53, p = 2.04E-02; TG and SLE, IVW OR: 1.04, 95% CI: 0.71∼1.51, p = 8.44E-01; TC and SLE, IVW OR: 1.07, 95% CI: 0.89∼1.29, p = 4.42E-01; When setting SLE as exposure, SLE and HDL cholesterol, IVW OR: 1.00, 95% CI: 0.99∼1.01, p = 9.51E-01; SLE and LDL cholesterol, IVW OR: 0.99, 95% CI: 0.98∼1.00, p = 3.14E-01; SLE and TG, IVW OR: 0.99, 95% CI: 0.98∼1.00, p = 1.30E-02; SLE and TC, IVW OR: 0.99, 95% CI: 0.98∼1.00, p = 1.56E-01). Our MVMR analysis also provided little evidence that genetically determined lipid traits were significantly associated with the risk of SLE (HDL cholesterol and SLE, p = 9.63E-02; LDL cholesterol and SLE, p = 9.63E-02; TG and SLE, p = 8.44E-01; TC and SLE, p = 4.42E-01). Conclusion: In conclusion, these data provide evidence that genetic changes in lipid traits are not significantly associated with SLE risk in the European population.
Keywords: blood lipids; high density lipoprotein; low density lipoprotein; mendelian randomization; systemic lupus erythematosus; total cholesterol; triglycerides.
Copyright © 2022 Wang, Huang, Lin, Wen, He and Huang.
Conflict of interest statement
The authors declare that the research was conducted in the absence of any commercial or financial relationships that could be construed as a potential conflict of interest.
Figures
Similar articles
-
The Association between Circulating Lipids and Female Infertility Risk: A Univariable and Multivariable Mendelian Randomization Analysis.Nutrients. 2023 Jul 13;15(14):3130. doi: 10.3390/nu15143130. Nutrients. 2023. PMID: 37513548 Free PMC article.
-
No evidence of genetic causal association between sex hormone-related traits and systemic lupus erythematosus: A two-sample Mendelian randomization study.Clin Rheumatol. 2023 Dec;42(12):3237-3249. doi: 10.1007/s10067-023-06700-x. Epub 2023 Jul 26. Clin Rheumatol. 2023. PMID: 37495778
-
Plasma lipids, alcohol intake frequency and risk of Osteoarthritis: a Mendelian randomization study.BMC Public Health. 2023 Jul 11;23(1):1327. doi: 10.1186/s12889-023-16250-1. BMC Public Health. 2023. PMID: 37434151 Free PMC article.
-
Phenome-wide Mendelian randomization study evaluating the association of circulating vitamin D with complex diseases.Front Nutr. 2023 Mar 29;10:1108477. doi: 10.3389/fnut.2023.1108477. eCollection 2023. Front Nutr. 2023. PMID: 37063319 Free PMC article. Review.
-
A causal association between obesity and constipation: a two-sample bidirectional Mendelian randomization study and meta-analysis.Front Nutr. 2024 Nov 11;11:1430280. doi: 10.3389/fnut.2024.1430280. eCollection 2024. Front Nutr. 2024. PMID: 39588045 Free PMC article. Review.
Cited by
-
Causal relationship between PCSK9 inhibitor and autoimmune diseases: a drug target Mendelian randomization study.Arthritis Res Ther. 2023 Aug 14;25(1):148. doi: 10.1186/s13075-023-03122-7. Arthritis Res Ther. 2023. PMID: 37580807 Free PMC article.
-
Network pharmacology combined with Mendelian randomization analysis to identify the key targets of renin-angiotensin-aldosterone system inhibitors in the treatment of diabetic nephropathy.Front Endocrinol (Lausanne). 2024 Jan 25;15:1354950. doi: 10.3389/fendo.2024.1354950. eCollection 2024. Front Endocrinol (Lausanne). 2024. PMID: 38332893 Free PMC article.
-
Autoimmune diseases and atherosclerotic cardiovascular disease.Nat Rev Cardiol. 2024 Nov;21(11):780-807. doi: 10.1038/s41569-024-01045-7. Epub 2024 Jun 27. Nat Rev Cardiol. 2024. PMID: 38937626 Review.
-
Exploration and Validation of Key Genes and Immune Infiltration in Alcoholic Hepatitis.J Inflamm Res. 2025 Jun 24;18:8243-8262. doi: 10.2147/JIR.S514515. eCollection 2025. J Inflamm Res. 2025. PMID: 40589609 Free PMC article.
References
-
- Ajeganova S., Gustafsson T., Lindberg L., Hafström I., Frostegård J. (2020). Similar Progression of Carotid Intima-media Thickness in 7-year Surveillance of Patients with Mild SLE and Controls, but This Progression Is Still Promoted by Dyslipidaemia, Lower HDL Levels, Hypertension, History of Lupus Nephritis and a Higher Prednisolone Usage in Patients. Lupus Sci. Med. 7 (1), e000362. 10.1136/lupus-2019-000362 - DOI - PMC - PubMed
LinkOut - more resources
Full Text Sources
Miscellaneous