. 2022 Apr 13:13:849020.
doi: 10.3389/fmicb.2022.849020. eCollection 2022.

LncRNA NEAT1 Potentiates SREBP2 Activity to Promote Inflammatory Macrophage Activation and Limit Hantaan Virus Propagation

Affiliations

LncRNA NEAT1 Potentiates SREBP2 Activity to Promote Inflammatory Macrophage Activation and Limit Hantaan Virus Propagation

Yongheng Yang et al. Front Microbiol. .

Abstract

As the global prototypical zoonotic hantavirus, Hantaan virus (HTNV) is prevalent in Asia and is the leading causative agent of severe hemorrhagic fever with renal syndrome (HFRS), which has profound morbidity and mortality. Macrophages are crucial components of the host innate immune system and serve as the first line of defense against HTNV infection. Previous studies indicated that the viral replication efficiency in macrophages determines hantavirus pathogenicity, but it remains unknown which factor manipulates the macrophage activation pattern and the virus-host interaction process. Here, we performed the transcriptomic analysis of HTNV-infected mouse bone marrow-derived macrophages and identified the long noncoding RNA (lncRNA) nuclear enriched abundant transcript 1 (NEAT1), especially the isoform NEAT1-2, as one of the lncRNAs that is differentially expressed at the early phase. Based on coculture experiments, we revealed that silencing NEAT1-2 hinders inflammatory macrophage activation and facilitates HTNV propagation, while enhancing NEAT1-2 transcription effectively restrains viral replication. Furthermore, sterol response element binding factor-2 (SREBP2), which controls the cholesterol metabolism process, was found to stimulate macrophages by promoting the production of multiple inflammatory cytokines upon HTNV infection. NEAT1-2 could potentiate SREBP2 activity by upregulating Srebf1 expression and interacting with SREBP2, thus stimulating inflammatory macrophages and limiting HTNV propagation. More importantly, we demonstrated that the NEAT1-2 expression level in patient monocytes was negatively correlated with viral load and HFRS disease progression. Our results identified a function and mechanism of action for the lncRNA NEAT1 in heightening SREBP2-mediated macrophage activation to restrain hantaviral propagation and revealed the association of NEAT1 with HFRS severity.

Keywords: HFRS; Hantaan virus; NEAT1; SREBP2; hantavirus; inflammatory macrophage; lncRNA.


Conflict of interest statement

The authors declare that the research was conducted in the absence of any commercial or financial relationships that could be construed as a potential conflict of interest.

Figures

Figure 1
Figure 1
RNA-seq analysis of HTNV-infected macrophages and lncRNA identification. (A) (i) Experimental design for RNA-seq. (ii) PCA of different groups. (iii) Analysis of differentially expressed genes between groups. (B) The KEGG pathway annotations (upper) and GO analysis (bottom) of RNA-seq data from A. (C) (i) List FIGURE 1 | of time-sequenced gene expression profiles ordered based on the number of genes assigned. (ii) List of time-sequenced gene expression profiles ordered based on the significance (value of p) of the number of genes assigned vs. expected. (iii) The number of genes and related values of p from profile 0 to 19. (iv) The differentially expressed genes in profile 17. (D) Heatmap of differentially expressed lncRNAs from 0 to 36 hpi. (E) (i) The target positions of primers or siRNAs designed for qRT-PCR or RNA interference (RNAi). (ii) qRT-PCR analysis of NEAT1 in primary human monocytes (hMo), hMo-derived macrophages (hMDMs), mouse monocytes (mMo), and mouse bone marrow-derived macrophages (mBMDMs) from 0 to 48 hpi with an MOI of 5. (ii) qRT-PCR analysis of NEAT1-2 from (i) (n = 5 in each group). (F) qRT-PCR analysis of MALAT1 from E-(i). (G) The viral load calculated by qRT-PCR from E-(i). Data are shown as the mean ± SEM and are representative of three independent experiments.
Figure 2
Figure 2
Enhanced M1 Polarization by NEAT1-2 to Constrain HTNV Propagation. (A) (i) Schematic diagram of the coculture system. (ii) RNAi efficiency of NEAT1-2 silencing in hMDMs confirmed by qRT-PCR. (iii) RNAi efficiency of NEAT1-2 in hMDMs confirmed by RNAScope. NC, negative control with scrambled RNAs. (B) (i) qRT-PCR analysis of M1-related genes in hMDMs from the coculture system shown in 2A-(i). (ii) qRT-PCR analysis of M2-related genes in hMDMs from FIGURE 2 | the coculture system. (C) Immunoblot analysis of HTNV NPs in hMDMs from the coculture system. (D) qRT-PCR analysis of HTNV S segment hMDMs from the coculture system. (E) Enzyme-linked immunosorbent assay (ELISA) detection of IL-8 and CCL5 concentrations in the bottom medium in the coculture system. (F) Immunoblot analysis of the indicated proteins in HUVECs in the coculture system. (G) Viral titers of HUVECs assessed by the improved enzyme-linked focus formation assays. (H) (i) Representative flow cytometry data for TNFα and IL-10 production in NEAT1- or NEAT1-2-overexpressing hMDMs at 12 hpi (MOI = 5). (ii) Statistical analysis of data from (i). (I) (i) Representative flow cytometry data for HTNV NP expression in NEAT1- or NEAT1-2-overexpressing hMDMs at 36 hpi (MOI = 5). (ii) Statistical analysis of data from (i). (J) ROS measurement of hMDMs from I-(i). Data are shown as the mean ± SEM and are representative of three independent experiments. Each point represents a single sample (n = 4 in each group). Analysis was performed using the unpaired Student’s t-test (A–G) or one-way ANOVA (H–J). *p < 0.05, **p < 0.01, and ***p < 0.001.
Figure 3
Figure 3
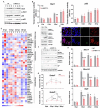
Regulation of the SREBP2 Pathway by NEAT1-2 after HTNV Infection. (A) Immunoblot analysis of total and phosphorylated Stat1/p65 in hMDMs treated with RNAi (MOI = 5). (B) Detection of the transcriptional activity of Stat1 and p65 in hMDMs from (A). (C) Heatmap of genes involved in cholesterol metabolism of mBMDMs from Figure 1A. (D) Immunoblot analysis of the indicated proteins in hMDMs at 12 hpi with an MOI of 5. (E) Immunofluorescence assays for SREBP2 and HTNV NP in hMDMs at 12 hpi with an MOI of 5. (F) Immunoblot analysis of the indicated proteins in hMDMs treated with RNAi (MOI = 5). (G) qRT-PCR analysis of Srebf1 and Srebf2 in hMDMs from (F). (H) qRT-PCR analysis of the indicated genes associated with cholesterol synthesis from (F). Data are shown as the mean ± SEM and are representative of three independent experiments. Each point represents a single sample (n = 4 in each group). Analysis was performed using the unpaired Student’s t-test. *p < 0.05, **p < 0.01, and ***p < 0.001.
Figure 4
Figure 4
Promotion of Inflammatory Macrophage Phenotype by SREBP2 after HTNV Infection. (A) RNAi efficiency of silencing Srebf1 (si-BF1) and Srebf2 (si-BF2) in hMDMs confirmed by qRT-PCR. (B) (i) qRT-PCR analysis of M1-related genes in hMDMs at 24 hpi. (ii) qRT-PCR analysis of M2-related genes in hMDMs at 24 hpi. The hMDMs were transfected with siRNAs for 24 h and then infected with HTNV at an MOI of 5. (C) Immunoblot analysis of the indicated proteins in hMDMs from (B). (D) Immunoblot analysis of the indicated proteins in hMDMs that were electrotransfected with plasmids expressing eGFP (as a control) or N-SREBP2 for 24 h and then infected with HTNV at an MOI of 5. (E) qRT-PCR analysis of HTNV S segments in hMDMs from (D). (F) ROS detection in hMDMs from (D). (G) Cytokines/chemokines upregulated by N-SREBP overexpression in HTNV-infected hMDMs at 36 hpi. The results were acquired through BioPlex Multiplex Immunoassays. The hMDMs were acquired and differentiated from seven healthy donors and then electrotransfected with the indicated plasmids for 24 h. The hMDMs from one donor were divided into two groups for the transfection of eGFP and N-SREBP2. Concentration (Y unit), pg/ml. (H) Downregulated cytokines/chemokines as in (G). Concentration (Y unit), pg/ml. (I) Unchanged cytokines/chemokines as in (G). Concentration (Y unit), pg/ml. (J) Immunoblot analysis of HTNV NPs in HUVECs. N-SREBP-overexpressing hMDMs were cocultured with HUVECs as designed in Figure 2A-i and then infected with HTNV at an MOI of 5. Immunoblot assays were performed at various time points after HTNV infection. (K) qRT-PCR analysis of the indicated genes in HUVECs from (J). Data are shown as the mean ± SEM and are representative of three independent experiments. Each point represents a single sample (n = 4 in each group except G–I). Analysis was performed using the unpaired Student’s t-test (A–F), paired Student’s t-test (G–I), or one-way ANOVA (K). *p < 0.05, **p < 0.01, and ***p < 0.001.
Figure 5
Figure 5
NEAT1-2 Promotes SREBP-2-Dependent Inflammation in HTNV-infected Macrophages. (A) qRT-PCR analysis of proinflammatory genes in hMDMs with the indicated treatments. The hMDMs were electrotransfected with pCMV-NEAT1-2 or vectors for 24 h and then infected with HTNV at an MOI of 5 with or without fatostatin (20 μM) treatment. Cells were collected for qRT-PCR at 36 hpi. (B) qRT-PCR analysis of proinflammatory genes in hMDMs with the indicated treatments. The hMDMs were electrotransfected with si-NEAT1-2 and/or plasmids coding N-SREBP2 and then infected with HTNV at an MOI of 5. Cells were collected for qRT-PCR at 36 hpi. (C) Detection of the transcriptional activity of SREBP1 in hMDMs from 0 to 36 hpi. (D) Detection of the transcriptional activity of SREBP2 in hMDMs from 0 to 36 hpi. (E) RIP assays to measure the enrichment of NEAT1-2 by different transcription factors. HEK 293T cells were transfected with plasmids expressing Stat1, p65, SREBP1 or SREBP2 and then infected with HTNV at an MOI of 5. Cells at various time points after HTNV infection were collected for RIP analysis. Data are shown as the mean ± SEM and are representative of three independent experiments. Each point represents a single sample (n = 4 in each group. Analysis was performed using the unpaired Student’s t-test (A–D) or one-way ANOVA (E). *p < 0.05, **p < 0.01, and ***p < 0.001.
Figure 6
Figure 6
Inverse Relationship of NEAT1-2 Expression with HFRS Disease Severity. (A) Classification of clinical stages and disease severity for enrolled HFRS patients. Healthy control group, n = 30; febrile group (not combined with hypotensive shock), n = 24; hypotensive group (with or without fever), n = 24; oliguric group, n = 34; diuretic group, n = 24; convalescent group, n = 17. For the acute phase, mild/moderate group, n = 51; severe/critical group, n = 31. (B) qRT-PCR analysis of NEAT1-2 expression levels in monocytes from HFRS patients at different disease stages. (C) qRT-PCR analysis of NEAT1-2 expression levels in monocytes from HFRS patients at the acute phase but with different disease severities. (D-H) The correlation of NEAT1-2 expression level in monocytes from HFRS patients at the acute phase with white blood cell count (WBC) (D), viral load (E), serum creatinine concentration (Scr) (F), the lowest value of platelet count (PLT) (G) or serum IFNα concentration (H). (I) Receiver operating characteristic curve (ROC) and area under the curve (AUC) analyses of the prognostic values of various clinical parameters for HFRS disease severity. Data are shown as the median, quartile, and standard deviation. Each point represents a single sample. Analysis was performed using the one-way ANOVA (B), unpaired Student’s t test (C), or Spearman’s rank correlation test (D-H). *p < 0.05, **p < 0.01, and ***p < 0.001.
Figure 7
Figure 7
Regulation of NEAT1-2 in SREBP2-mediated Anti-hantaviral Macrophage Responses. HTNV infection consumes cellular sterols and activates the SREBP2 pathway in macrophages, during which lncRNA NEAT1-2 potentiates SREBP2 activity by facilitating Srebf1 expression and initiating SREBP2-mediated inflammation. M1-type macrophages further stimulate host antihantaviral responses by secreting multiple cytokines, including IFNα, TNFα, and IL-1β. These cytokines promote the expression of antiviral molecules such as IFITM3 and DDX60, thus restricting HTNV replication and spread.

References

    1. Baasch S., Giansanti P., Kolter J., Riedl A., Forde A. J., Runge S., et al. . (2021). Cytomegalovirus subverts macrophage identity. Cell 184:e3725, 3774.e25–3793.e25. doi: 10.1016/j.cell.2021.05.009 - DOI - PubMed
    1. Bekkering S., Arts R. J. W., Novakovic B., Kourtzelis I., van der Heijden C., Li Y., et al. . (2018). Metabolic induction of trained immunity through the Mevalonate pathway. Cell 172:e139, 135.e9–146.e9. doi: 10.1016/j.cell.2017.11.025 - DOI - PubMed
    1. Chinese National Bureau of Statistics (2020). The epidemiology feature of HFRS in China. Available at: http://www.stats.gov.cn/ (Accessed October 10, 2020).
    1. Cloherty A. P. M., Olmstead A. D., Ribeiro C. M. S., Jean F. (2020). Hijacking of lipid droplets by hepatitis C, dengue and Zika viruses-from viral protein moonlighting to extracellular release. Int. J. Mol. Sci. 21:7901. doi: 10.3390/ijms21217901, PMID: - DOI - PMC - PubMed
    1. Dang E. V., McDonald J. G., Russell D. W., Cyster J. G. (2017). Oxysterol restraint of cholesterol synthesis prevents AIM2 Inflammasome activation. Cell 171:e1011, 1057.e11–1071.e11. doi: 10.1016/j.cell.2017.09.029 - DOI - PMC - PubMed