

Metatranscriptomic Analysis of the Chicken Gut Resistome Response to In-Feed Antibiotics and Natural Feed Additives
- PMID: 35495718
- PMCID: PMC9048739
- DOI: 10.3389/fmicb.2022.833790
Metatranscriptomic Analysis of the Chicken Gut Resistome Response to In-Feed Antibiotics and Natural Feed Additives
Abstract
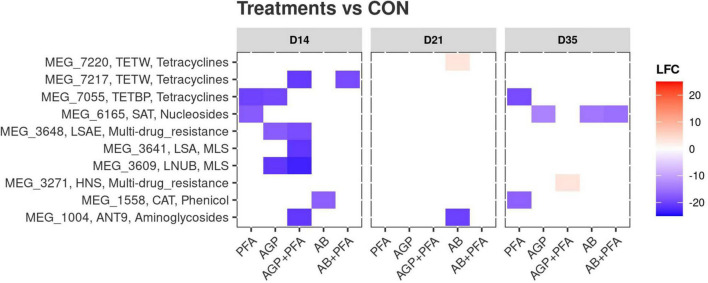
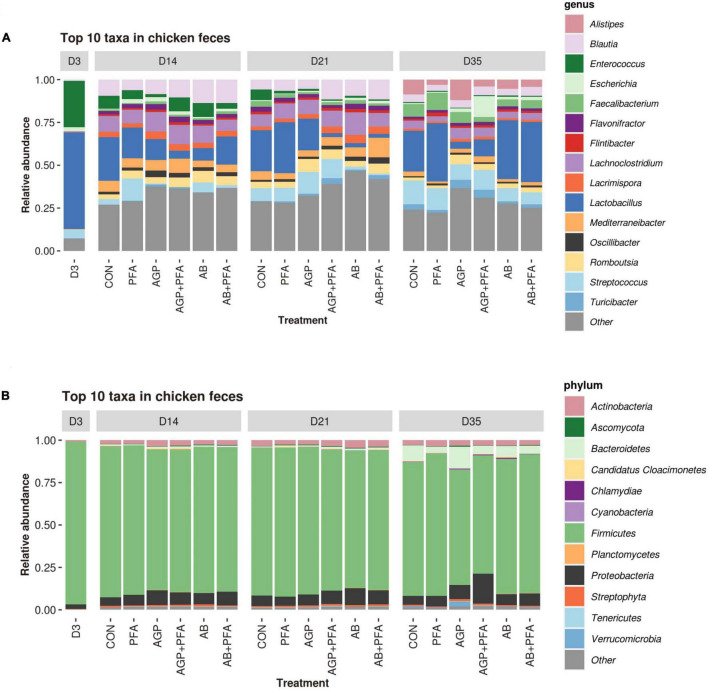
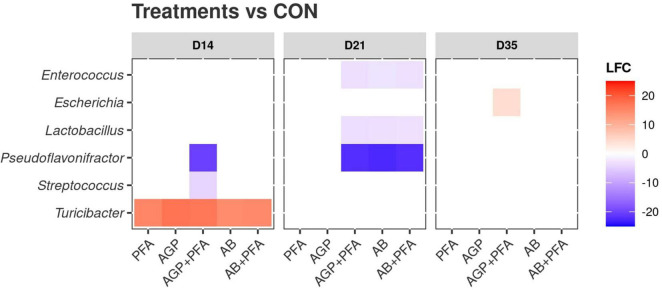
The emergence of resistance against common antibiotics in the gut microbiota is a major issue for both human and livestock health. This highlights the need for understanding the impact of such application on the reservoir of antibiotic resistance genes in poultry gut and devising means to circumvent the potential resistome expansion. Phytogenic feed additives (PFAs) are potential natural alternative to antibiotic to improve animal health and performance, supposedly via positively affecting the gut microbial ecosystem, but there is little systematic information available. In this time-course study, we applied a shotgun meta-transcriptomics approach to investigate the impact of a PFA product as well as the commonly used antibiotic, zinc bacitracin either at AGP concentration or therapeutic concentration on the gut microbiome and resistome of broiler chickens raised for 35 days. Over the course of the trial, PFA treatments increased the abundance of Firmicutes such as Lactobacillus and resulted in a lower abundance of Escherichia, while the latter group increased significantly in the feces of chickens that received either AGP or AB doses of bacitracin. Tetracycline resistance and aminoglycoside resistance were the predominant antibiotic resistance gene (ARG) classes found, regardless of the treatment. PFA application resulted in a decrease in abundance of ARGs compared to those in the control group and other antibiotic treatment groups. In summary, the findings from this study demonstrate the potential of phytogenic feed additives could be an alternative to antibiotics in poultry farming, with the added benefit of counteracting antimicrobial resistance development.
Keywords: antibiotic resistance genes; chicken; gut microbiome; metatranscriptomics; phytogenic feed additives; resistome.
Copyright © 2022 Koorakula, Schiavinato, Ghanbari, Wegl, Grabner, Koestelbauer, Klose, Dohm and Domig.
Conflict of interest statement
MG, GW, NG, AK, and VK are employed by DSM Animal Nutrition & Health, which provided support in the form of salaries for the authors but did not have the main role in the experimental design, data collection and analysis, decision to publish, or preparation of the manuscript. DSM Animal Nutrition & Health is involved in natural feed additive development and research in natural alternatives to in-feed medication in livestock production. The remaining authors declare that the research was conducted in the absence of any commercial or financial relationships that could be construed as a potential conflict of interest.
Figures
Similar articles
-
Dose-dependent impact of enrofloxacin on broiler chicken gut resistome is mitigated by synbiotic application.Front Microbiol. 2022 Aug 4;13:869538. doi: 10.3389/fmicb.2022.869538. eCollection 2022. Front Microbiol. 2022. PMID: 35992659 Free PMC article.
-
Feed additives shift gut microbiota and enrich antibiotic resistance in swine gut.Sci Total Environ. 2018 Apr 15;621:1224-1232. doi: 10.1016/j.scitotenv.2017.10.106. Epub 2017 Oct 18. Sci Total Environ. 2018. PMID: 29054657
-
Effects of antibiotic growth promoter and its natural alternative on poultry cecum ecosystem: an integrated analysis of gut microbiota and host expression.Front Microbiol. 2024 Dec 2;15:1492270. doi: 10.3389/fmicb.2024.1492270. eCollection 2024. Front Microbiol. 2024. PMID: 39687871 Free PMC article.
-
Assessing the potential of phytogenic feed additives: A comprehensive review on their effectiveness as a potent dietary enhancement for nonruminant in swine and poultry.J Anim Physiol Anim Nutr (Berl). 2024 May;108(3):711-723. doi: 10.1111/jpn.13922. Epub 2024 Jan 24. J Anim Physiol Anim Nutr (Berl). 2024. PMID: 38264830 Review.
-
Potential influence of antimicrobial resistance gene content in probiotic bacteria on the gut resistome ecosystems.Front Nutr. 2023 Feb 1;10:1054555. doi: 10.3389/fnut.2023.1054555. eCollection 2023. Front Nutr. 2023. PMID: 36819705 Free PMC article. Review.
Cited by
-
Shift of Microbiota and Modulation of Resistome in the Ceca of Broiler Chicken Fed Berry Pomace Alone or in Combination of a Multienzyme Mixture.Microorganisms. 2025 Apr 30;13(5):1044. doi: 10.3390/microorganisms13051044. Microorganisms. 2025. PMID: 40431218 Free PMC article.
-
Breaking the Cycle: A Yeast Mannan-Rich Fraction Beneficially Modulates Egg Quality and the Antimicrobial Resistome Associated with Layer Hen Caecal Microbiomes under Commercial Conditions.Microorganisms. 2024 Jul 30;12(8):1562. doi: 10.3390/microorganisms12081562. Microorganisms. 2024. PMID: 39203404 Free PMC article.
-
Effects of the Antimicrobial Peptide Mastoparan X on the Performance, Permeability and Microbiota Populations of Broiler Chickens.Animals (Basel). 2022 Dec 8;12(24):3462. doi: 10.3390/ani12243462. Animals (Basel). 2022. PMID: 36552382 Free PMC article.
-
Analysis of Resistance Gene Diversity in the Intestinal Microbiome of Broilers from Two Types of Broiler Farms in Hebei Province, China.Antibiotics (Basel). 2023 Nov 27;12(12):1664. doi: 10.3390/antibiotics12121664. Antibiotics (Basel). 2023. PMID: 38136698 Free PMC article.
-
Gut Microbiome Studies in Livestock: Achievements, Challenges, and Perspectives.Animals (Basel). 2022 Nov 30;12(23):3375. doi: 10.3390/ani12233375. Animals (Basel). 2022. PMID: 36496896 Free PMC article. Review.
References
-
- Bampidis V., Azimonti G., Bastos M., Christensen H., Dusemund B., Kouba M., et al. (2019). Safety and efficacy of Biomin® DC-P as a zootechnical feed additive for chickens for fattening, chickens reared for laying and minor avian species to the point of lay. EFSA J. 17:5724. 10.2903/j.efsa.2019.5724 - DOI - PMC - PubMed
LinkOut - more resources
Full Text Sources