. 2022 Apr 15:16:870350.
doi: 10.3389/fnhum.2022.870350. eCollection 2022.

Abnormal Large-Scale Neuronal Network in High Myopia

Affiliations

Abnormal Large-Scale Neuronal Network in High Myopia

Yu Ji et al. Front Hum Neurosci. .

Abstract

Aim: Resting state functional magnetic resonance imaging (rs-fMRI) was used to analyze changes in functional connectivity (FC) within various brain networks and functional network connectivity (FNC) among various brain regions in patients with high myopia (HM).

Methods: rs-fMRI was used to scan 82 patients with HM (HM group) and 59 healthy control volunteers (HC group) matched for age, sex, and education level. Fourteen resting state networks (RSNs) were extracted, of which 11 were positive. Then, the FCs and FNCs of RSNs in HM patients were examined by independent component analysis (ICA).

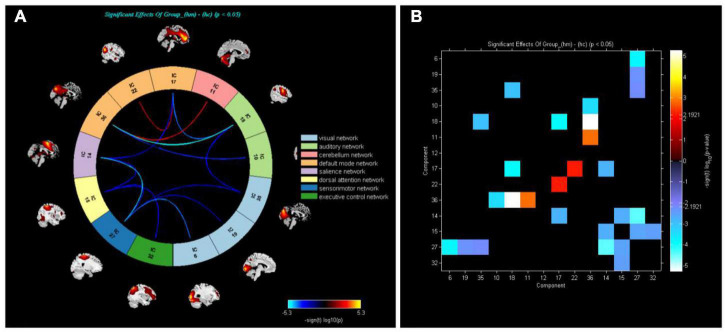
Results: Compared with the HC group, FC in visual network 1 (VN1), dorsal attention network (DAN), auditory network 2 (AN2), visual network 3 (VN3), and sensorimotor network (SMN) significantly increased in the HM group. FC in default mode network 1 (DMN1) significantly decreased. Furthermore, some brain regions in default mode network 2 (DMN2), default mode network 3 (DMN3), auditory network 1 (AN1), executive control network (ECN), and significance network (SN) increased while others decreased. FNC analysis also showed that the network connection between the default mode network (DMN) and cerebellar network (CER) was enhanced in the HM group.

Conclusion: Compared with HCs, HM patients showed neural activity dysfunction within and between specific brain networks, particularly in the DMN and CER. Thus, HM patients may have deficits in visual, cognitive, and motor balance functions.

Keywords: functional connectivity; functional network connectivity; high myopia; independent component analysis; resting state network.


Conflict of interest statement

The authors declare that the research was conducted in the absence of any commercial or financial relationships that could be construed as a potential conflict of interest.

Figures

FIGURE 1
FIGURE 1
Typical spatial patterns of each RSN in HM group: visual network (VN), auditory network (AN), cerebellar network (CER), default mode network (DMN), sensorimotor network (SMN), saliency network (SN), executive control network (ECN), and dorsal attention network (DAN).
FIGURE 2
FIGURE 2
In the HM group, 11 brain regions of RSNs were significantly different (P < 0.01; GRF correction, cluster-level P < 0.05): visual network 1 (VN1), auditory network 1 (AN1), default mode network 1 (DMN1), significance network (SN), dorsal attention network (DAN), default mode network 2 (DMN2), auditory network 2 (AN2), visual network 3 (VN3), default mode network 3 (DMN3), sensorimotor network (SMN), and executive control network (ECN). BrainNet Viewer images show increased (warm colors) and decreased (cool colors) FC connectivities in the HM group.
FIGURE 3
FIGURE 3
(A) Analysis of whole-brain functional network connectivity intensity allowed calculation of differences between HM and HC groups (P < 0.05, two-sample t-test). Yellow lines represent better functional connectivity than in HC group, while blue lines represent weaker functional connectivity than in HC group. (B) Group averaged static functional connectivity between independent component pairs was computed using overall resting state data. Values in the correlation matrix represent Fisher’s z-transformed Pearson correlation coefficients.

References

    1. Azeez A. K., Biswal B. B. (2017). A review of resting-state analysis methods. Neuroimag. Clin. N. Am. 27 581–592. 10.1016/j.nic.2017.06.001 - DOI - PubMed
    1. Cai R. L., Shen G. M., Wang H., Guan Y. Y. (2018). Brain functional connectivity network studies of acupuncture: a systematic review on resting-state fMRI. J. Integr. Med. 16 26–33. 10.1016/j.joim.2017.12.002 - DOI - PubMed
    1. Calhoun V. D., Adali T., Pearlson G. D., Pekar J. J. (2001). A method for making group inferences from functional MRI data using independent component analysis. Hum. Brain Mapp. 14 140–151. 10.1002/hbm.1048 - DOI - PMC - PubMed
    1. Cheng Y., Huang X., Hu Y. X., Huang M. H., Yang B., Zhou F. Q., et al. (2020). Comparison of intrinsic brain activity in individuals with low/moderate myopia versus high myopia revealed by the amplitude of low-frequency fluctuations. Acta Radiol. 61 496–507. 10.1177/0284185119867633 - DOI - PubMed
    1. Cordier L., Diers M. (2018). Learning and unlearning of pain. Biomedicines 6:67. 10.3390/biomedicines6020067 - DOI - PMC - PubMed