Urinary Profile of Endogenous Gamma-Hydroxybutyric Acid and its Biomarker Metabolites in Healthy Korean Females: Determination of Age-Dependent and Intra-Individual Variability and Identification of Metabolites Correlated With Gamma-Hydroxybutyric Acid
- PMID: 35496306
- PMCID: PMC9043528
- DOI: 10.3389/fphar.2022.853971
Urinary Profile of Endogenous Gamma-Hydroxybutyric Acid and its Biomarker Metabolites in Healthy Korean Females: Determination of Age-Dependent and Intra-Individual Variability and Identification of Metabolites Correlated With Gamma-Hydroxybutyric Acid
Abstract
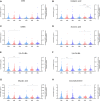
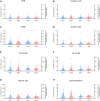
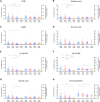
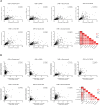
Gamma-hydroxybutyric acid (GHB), used as a therapeutic and an illegal anesthetic, is a human neurotransmitter produced during gamma-aminobutyric acid (GABA) biosynthesis and metabolism. Potential biomarker metabolites of GHB intoxication have been identified previously; however, reference concentrations have not been set due to the lack of clinical study data. Urinary profiling of endogenous GHB and its biomarker metabolites in urine samples (n = 472) of 206 healthy females was performed based on differences in age and time of sample collection using liquid chromatography-tandem mass spectrometry following validation studies. The unadjusted and creatinine-adjusted urinary concentrations ranges were obtained after urinary profiling. The creatinine-adjusted concentrations of glutamic and succinic acids and succinylcarnitine significantly increased, whereas that of glycolic acid significantly decreased with advancing age. Significant inter-day variation of GABA concentration and intra-day variation of 3,4-dihydroxybutyric acid and succinylcarnitine concentrations were observed. The urinary concentrations of 2,4-dihydroxybutyric acid, succinic acid, and 3,4-dihydroxybutyric acid showed the highest correlation with that of GHB. Data from this study suggest population reference limits to facilitate clinical and forensic decisions related to GHB intoxication and could be useful for identification of biomarkers following comparison with urinary profiles of GHB-administered populations.
Keywords: biomarker metabolites; gamma-hydroxybutyric acid; liquid chromatography-tandem mass spectrometry; metabolite profiling; urine.
Copyright © 2022 Kim, Choi, Lee, Kim, Park, Han, Han, Lee and Lee.
Conflict of interest statement
The authors declare that the research was conducted in the absence of any commercial or financial relationships that could be construed as a potential conflict of interest.
Figures


Similar articles
-
Derivatization-assisted LC-MS/MS method for simultaneous quantification of endogenous gamma-hydroxybutyric acid and its metabolic precursors and products in human urine.Anal Chim Acta. 2022 Feb 15;1194:339401. doi: 10.1016/j.aca.2021.339401. Epub 2021 Dec 30. Anal Chim Acta. 2022. PMID: 35063156
-
Phase I metabolites (organic acids) of gamma-hydroxybutyric acid-validated quantification using GC-MS and description of endogenous concentration ranges.Drug Test Anal. 2020 Aug;12(8):1135-1143. doi: 10.1002/dta.2820. Epub 2020 Jun 30. Drug Test Anal. 2020. PMID: 32415745
-
Ultra-high performance liquid chromatography tandem mass spectrometry (UHPLC-MS/MS) for determination of GHB, precursors and metabolites in different specimens: Application to clinical and forensic cases.J Pharm Biomed Anal. 2017 Apr 15;137:123-131. doi: 10.1016/j.jpba.2017.01.022. Epub 2017 Jan 9. J Pharm Biomed Anal. 2017. PMID: 28110168
-
Interpreting γ-hydroxybutyrate concentrations for clinical and forensic purposes.Clin Toxicol (Phila). 2019 Mar;57(3):149-163. doi: 10.1080/15563650.2018.1519194. Epub 2018 Oct 11. Clin Toxicol (Phila). 2019. PMID: 30307336 Review.
-
Metabolic Alterations Associated with γ-Hydroxybutyric Acid and the Potential of Metabolites as Biomarkers of Its Exposure.Metabolites. 2021 Feb 10;11(2):101. doi: 10.3390/metabo11020101. Metabolites. 2021. PMID: 33578991 Free PMC article. Review.
Cited by
-
Urinary concentrations of GHB and its novel amino acid and carnitine conjugates following controlled GHB administration to humans.Sci Rep. 2023 Jun 2;13(1):8983. doi: 10.1038/s41598-023-36213-1. Sci Rep. 2023. PMID: 37268859 Free PMC article.
-
Interaction between γ-Hydroxybutyric Acid and Ethanol: A Review from Toxicokinetic and Toxicodynamic Perspectives.Metabolites. 2023 Jan 25;13(2):180. doi: 10.3390/metabo13020180. Metabolites. 2023. PMID: 36837798 Free PMC article. Review.
References
LinkOut - more resources
Full Text Sources

