

Atomic force microscopy and Raman spectra profile of blood components associated with exposure to cigarette smoking
- PMID: 35496627
- PMCID: PMC9050830
- DOI: 10.1039/d0ra01384f
Atomic force microscopy and Raman spectra profile of blood components associated with exposure to cigarette smoking
Abstract
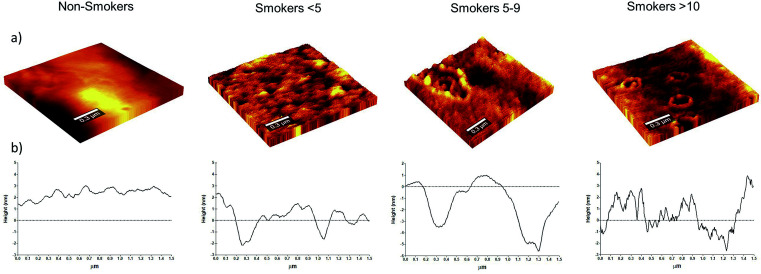
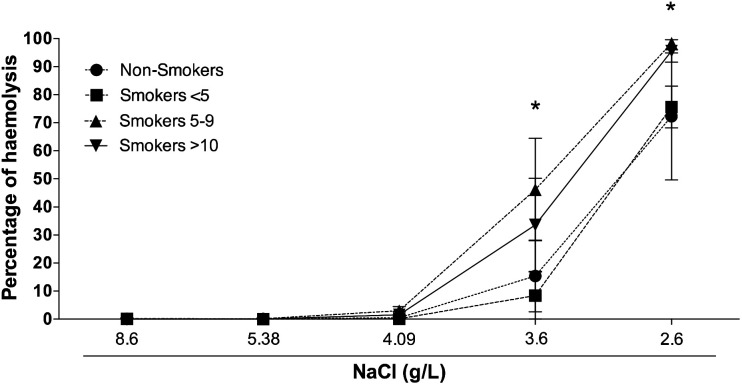
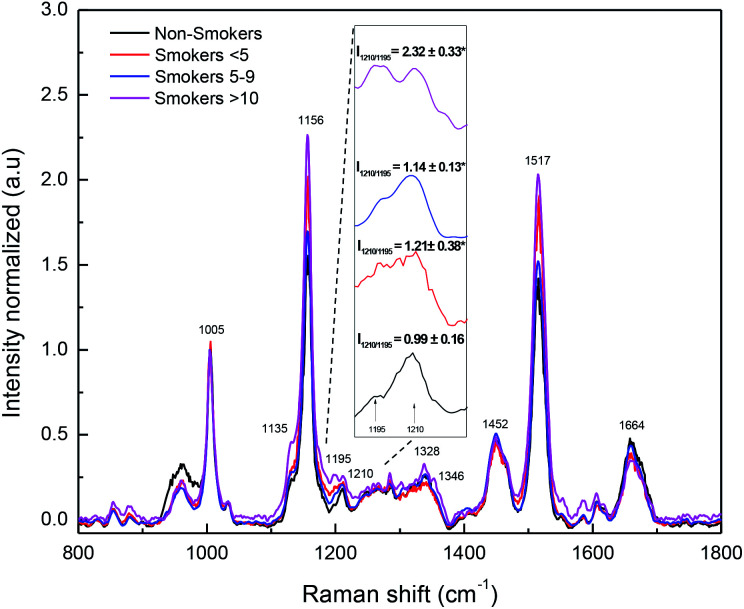
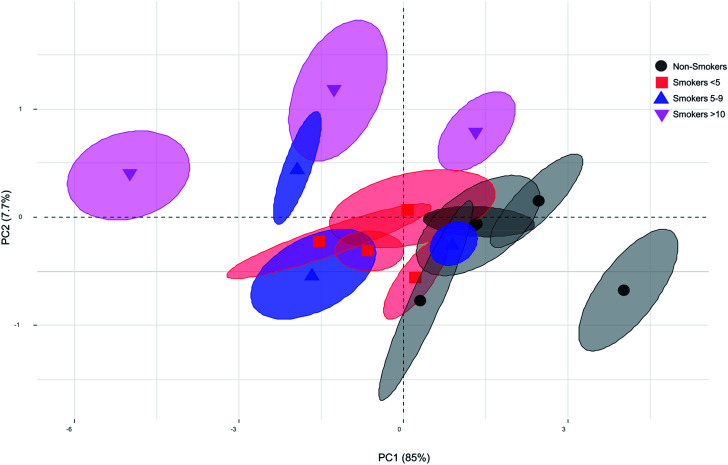
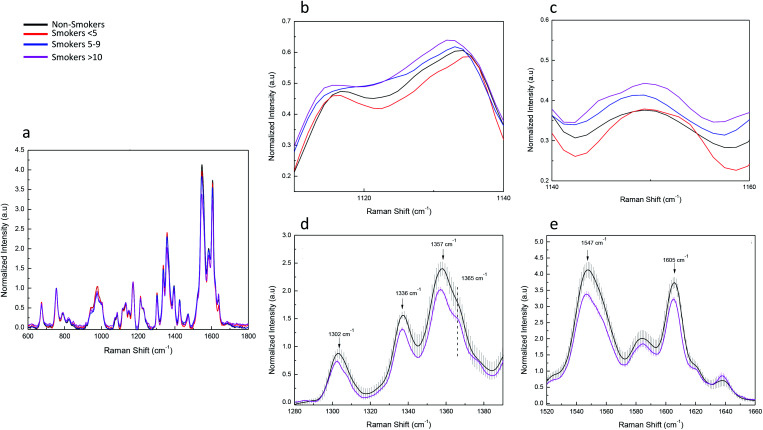
Tobacco smoke contains several compounds with oxidant and pro-oxidant properties with the capability of producing structural changes in biomolecules, as well as cell damage. This work aimed to describe and analyse the effect of tobacco smoke on human blood components, red blood cell (RBC) membrane, haemoglobin (Hb) and blood plasma by Atomic Force Microscopy (AFM) and Raman spectroscopy. Our results indicate that tobacco induced RBC membrane nano-alterations characterized by diminished RBC diameter and increased nano-vesicles formation, and RBC fragility. The Raman spectra profile suggests modifications in chemical composition specifically found in peaks 1135 cm-1, 1156 cm-1, 1452 cm-1 and intensity relation of peaks 1195 cm-1 and 1210 cm-1 of blood plasma and by change of peaks 1338 cm-1, 1357 cm-1, 1549 cm-1 and 1605 cm-1 associated with the pyrrole ring of Hb. The relevance of these results lies in the identification of a profile of structural and chemical alterations that serves as a biomarker of physiological and pathological conditions in the human blood components induced by tobacco exposure using AFM and the Raman spectroscopy as tools for monitoring them.
This journal is © The Royal Society of Chemistry.
Conflict of interest statement
The authors declare that they have no competing interests.
Figures
Similar articles
-
Nanoscale Changes on RBC Membrane Induced by Storage and Ionizing Radiation: A Mini-Review.Front Physiol. 2021 Jun 4;12:669455. doi: 10.3389/fphys.2021.669455. eCollection 2021. Front Physiol. 2021. PMID: 34149450 Free PMC article. Review.
-
Nano alterations of membrane structure on both γ-irradiated and stored human erythrocytes.Int J Radiat Biol. 2017 Dec;93(12):1306-1311. doi: 10.1080/09553002.2017.1393581. Epub 2017 Nov 7. Int J Radiat Biol. 2017. PMID: 29034757
-
The ring-stage of Plasmodium falciparum observed in RBCs of hospitalized malaria patients.Analyst. 2015 Dec 7;140(23):8007-16. doi: 10.1039/c5an01598g. Epub 2015 Nov 2. Analyst. 2015. PMID: 26524434
-
Surface-enhanced Raman spectroscopy and ultrastructural analysis of penicillin-producing Penicillium rubens strains.J Microsc. 2022 Apr;286(1):22-30. doi: 10.1111/jmi.13085. Epub 2022 Feb 12. J Microsc. 2022. PMID: 35092003
-
Atomic force microscopy: From red blood cells to immunohaematology.Adv Colloid Interface Sci. 2017 Nov;249:149-162. doi: 10.1016/j.cis.2017.05.011. Epub 2017 May 11. Adv Colloid Interface Sci. 2017. PMID: 28515013 Review.
Cited by
-
Nanoscale Changes on RBC Membrane Induced by Storage and Ionizing Radiation: A Mini-Review.Front Physiol. 2021 Jun 4;12:669455. doi: 10.3389/fphys.2021.669455. eCollection 2021. Front Physiol. 2021. PMID: 34149450 Free PMC article. Review.
References
LinkOut - more resources
Full Text Sources
Miscellaneous