

A strategy for preparing non-fluorescent graphene oxide quantum dots as fluorescence quenchers in quantitative real-time PCR
- PMID: 35497124
- PMCID: PMC9052102
- DOI: 10.1039/d0ra00142b
A strategy for preparing non-fluorescent graphene oxide quantum dots as fluorescence quenchers in quantitative real-time PCR
Abstract
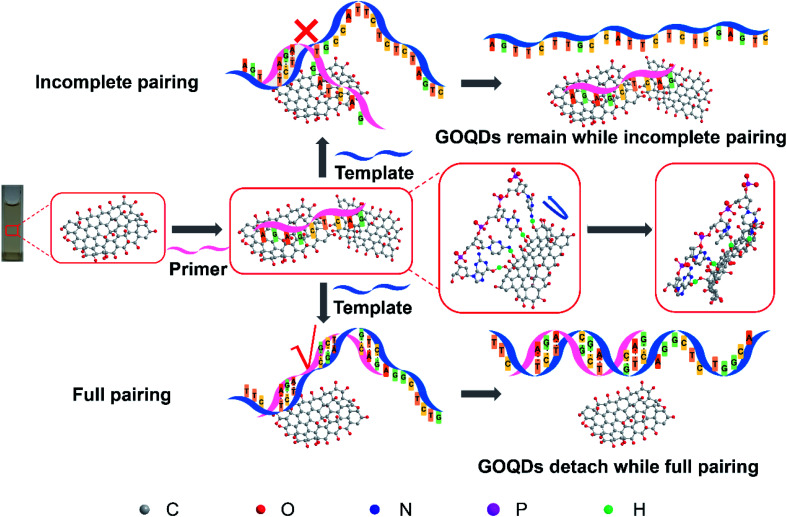
In recent years, graphene oxide quantum dots (GOQDs) have emerged as novel nanomaterials for optical sensing, bioimaging, clinical testing, and environmental testing. However, GOQDs demonstrate unique photoluminescence properties, with GOQDs having quantum limitations and edge effects that often affect the accuracy of the test results in the sensory field. Herein, GOQDs with a large content of hydroxyl groups and low fluorescence intensity were first prepared via an improved Fenton reaction in this study, which introduces a large amount of epoxy groups to break the C-C bonds. The synthesized GOQDs show no significant variation in the fluorescence intensity upon ultraviolet and visible light excitations. We further utilized the GOQDs as fluorescence quenchers for different fluorescent dyes in real-time fluorescence quantitative polymerase chain reaction (qRT-PCR), and verified that the addition of GOQDs (5.3 μg ml-1) into a qRT-PCR system could reduce the background fluorescence intensity of the reaction by fluorescence resonance energy transfer (FRET) during its initial stage and its non-specific amplification, and improve its specificity. In addition, the qRT-PCR method could detect two different lengths of DNA sequences with a high specificity in the 104 to 1010 copies per μl range. It is of paramount importance to carry out further investigations to establish an efficient, sensitive, and specific RT-PCR method based on the use of GOQD nanomaterials as fluorescence quenchers.
This journal is © The Royal Society of Chemistry.
Conflict of interest statement
There are no conflicts to declare.
Figures


Similar articles
-
Recycling Motorcycle Exhaust Soot into Fluorescent Graphene Oxide Quantum Dots for Sensing Ferrocyanide Ions and Bioimaging Cells: A Method for Waste Utilization.ACS Omega. 2025 Mar 31;10(14):14229-14240. doi: 10.1021/acsomega.5c00229. eCollection 2025 Apr 15. ACS Omega. 2025. PMID: 40256545 Free PMC article.
-
Preparation of graphene oxide quantum dots from waste toner, and their application to a fluorometric DNA hybridization assay.Mikrochim Acta. 2019 Jun 27;186(7):483. doi: 10.1007/s00604-019-3539-x. Mikrochim Acta. 2019. PMID: 31250112
-
Silicon-Doped Graphene Oxide Quantum Dots as Efficient Nanoconjugates for Multifunctional Nanocomposites.ACS Appl Mater Interfaces. 2022 Feb 9;14(5):7161-7174. doi: 10.1021/acsami.1c22208. Epub 2022 Jan 25. ACS Appl Mater Interfaces. 2022. PMID: 35076220
-
Fluorescence and Sensing Applications of Graphene Oxide and Graphene Quantum Dots: A Review.Chem Asian J. 2017 Sep 19;12(18):2343-2353. doi: 10.1002/asia.201700814. Epub 2017 Aug 30. Chem Asian J. 2017. PMID: 28742956 Free PMC article. Review.
-
Photoluminescence and Fluorescence Quenching of Graphene Oxide: A Review.Nanomaterials (Basel). 2022 Jul 17;12(14):2444. doi: 10.3390/nano12142444. Nanomaterials (Basel). 2022. PMID: 35889668 Free PMC article. Review.
Cited by
-
Accomplishment of one-step specific PCR and evaluated SELEX process by a dual-microfluidic amplified system.Biomicrofluidics. 2021 Apr 5;15(2):024107. doi: 10.1063/5.0045965. eCollection 2021 Mar. Biomicrofluidics. 2021. PMID: 33841601 Free PMC article.
-
Multifunctional carbon nanomaterials for diagnostic applications in infectious diseases and tumors.Mater Today Bio. 2022 Mar;14:100231. doi: 10.1016/j.mtbio.2022.100231. Epub 2022 Mar 5. Mater Today Bio. 2022. PMID: 35280329 Free PMC article. Review.
References
-
- Yew Y. T. Loo A. H. Sofer Z. Klímová K. Pumera M. Appl. Mater. Today. 2017;7:138–143. doi: 10.1016/j.apmt.2017.01.002. - DOI
LinkOut - more resources
Full Text Sources