. 2022 Mar 28;2(4):100192.
doi: 10.1016/j.crmeth.2022.100192. eCollection 2022 Apr 25.

An integrated toolbox to profile macrophage immunometabolism

Affiliations

An integrated toolbox to profile macrophage immunometabolism

Sanne G S Verberk et al. Cell Rep Methods. .

Abstract

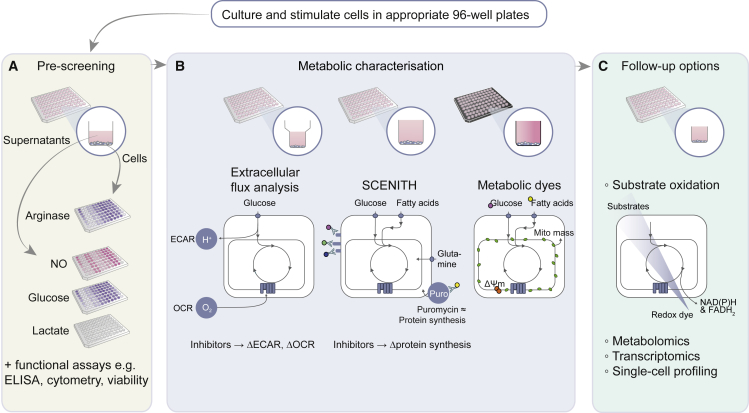
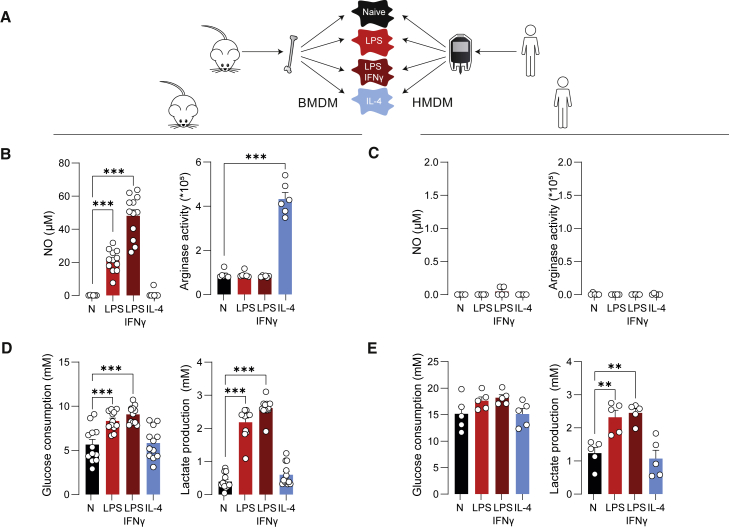
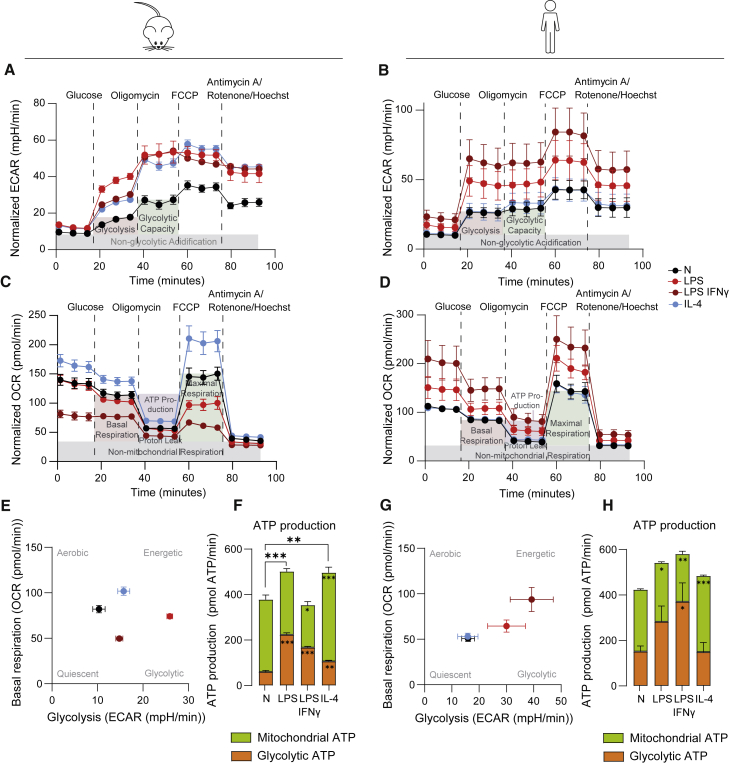
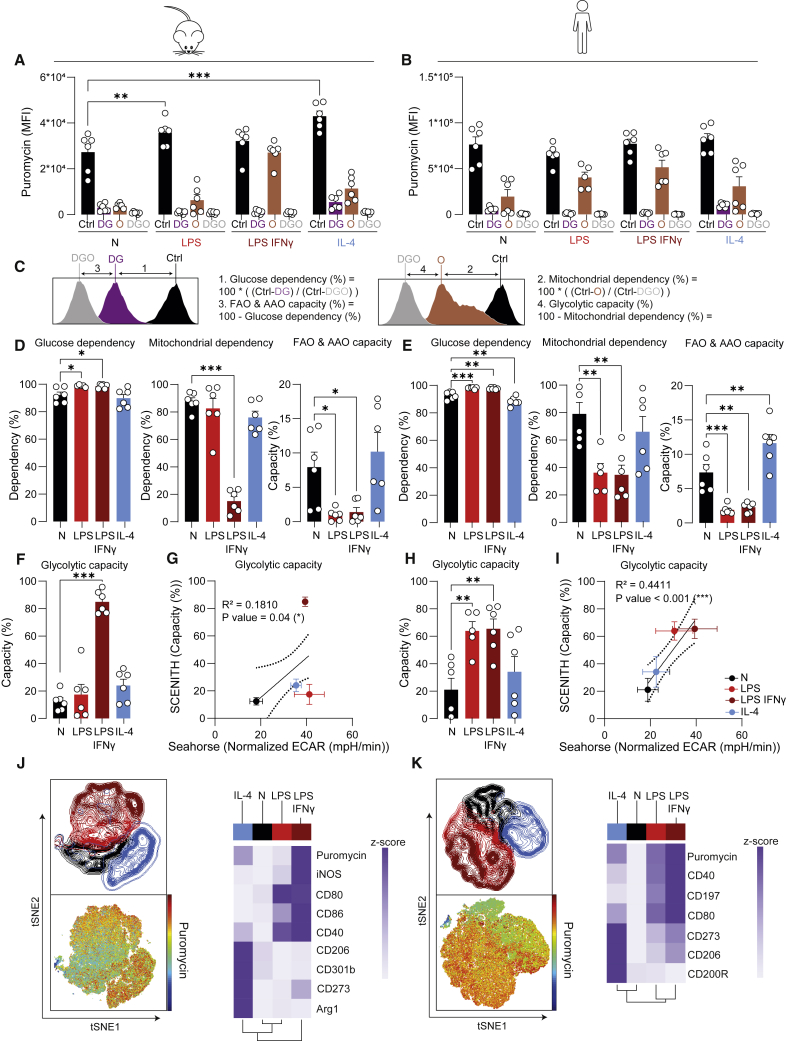
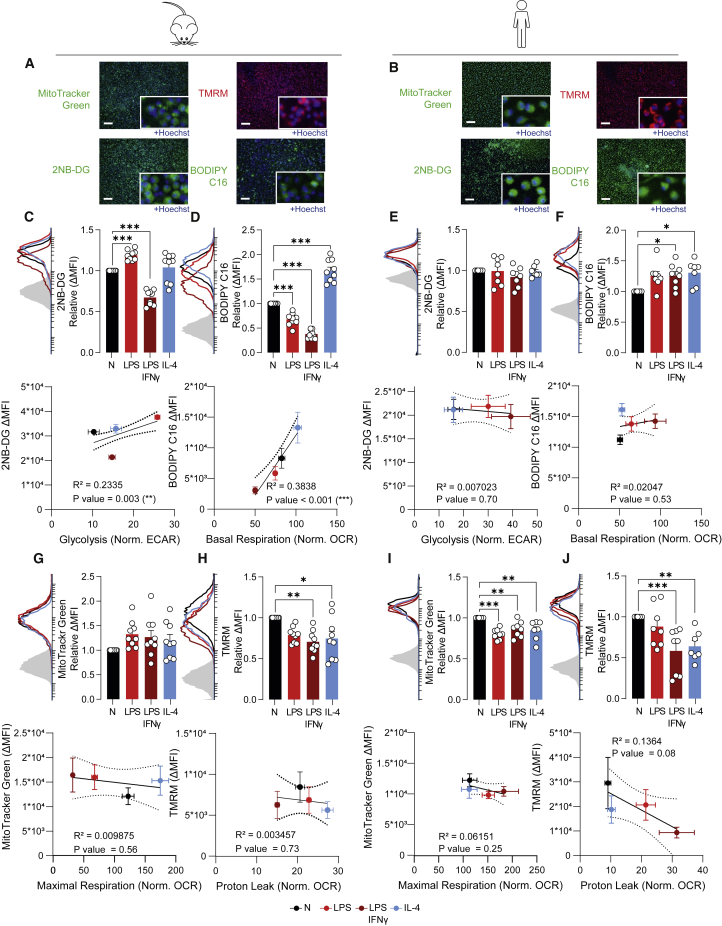
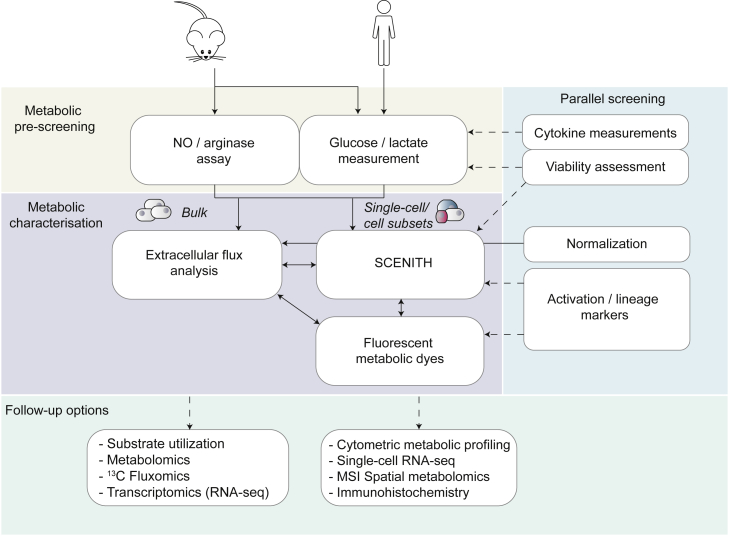
Macrophages are dynamic immune cells that can adopt several activation states. Fundamental to these functional activation states is the regulation of cellular metabolic processes. Especially in mice, metabolic alterations underlying pro-inflammatory or homeostatic phenotypes have been assessed using various techniques. However, researchers new to the field may encounter ambiguity in choosing which combination of techniques is best suited to profile immunometabolism. To address this need, we have developed a toolbox to assess cellular metabolism in a semi-high-throughput 96-well-plate-based format. Application of the toolbox to activated mouse and human macrophages enables fast metabolic pre-screening and robust measurement of extracellular fluxes, mitochondrial mass and membrane potential, and glucose and lipid uptake. Moreover, we propose an application of SCENITH technology for ex vivo metabolic profiling. We validate established activation-induced metabolic rewiring in mouse macrophages and report new insights into human macrophage metabolism. By thoroughly discussing each technique, we hope to guide readers with practical workflows for investigating immunometabolism.

Keywords: immunometabolism; macrophages; metabolism; semi-high throughput screening; toolbox.


Conflict of interest statement

The authors declare no competing interests. There are restrictions to the commercial use of SCENITH due to a pending patent application (PCT/EP2020/060,486).

Figures

None
Graphical abstract
Figure 1
Figure 1
Overview of semi-high-throughput techniques encompassed in metabolic pre-screening and toolbox (A) Metabolic pre-screening, consisting of arginase activity assay in cell lysates and NO, lactate, and glucose levels in cellular supernatant (yellow). (B and C) The core metabolic characterization, consisting of extracellular flux (XF) analysis, SCENITH, and uptake of fluorescent metabolic dyes (purple). XF analysis measures extracellular acidification and oxygen consumption in XF 96-well plates in response to metabolic inhibitors to estimate glycolysis and OXPHOS, respectively. The flow cytometry-based metabolic profiling technique SCENITH (Arguello et al., 2020) measures changes in the level of translation in response to inhibitors as a measurement for cellular metabolism. This can be assessed in plate-reader-compatible FACS 96-well plates. Fluorescence measurement of the uptake of several metabolic dyes can be measured by an imaging multi-mode plate reader in black 96-well plates and by flow cytometry. (C) These readouts can be followed up by more extensive metabolic profiling using substrate oxidation, metabolomics, transcriptomics, or various types of single-cell profiling.
Figure 2
Figure 2
Metabolic pre-screening of BMDMs and HMDMs indicate metabolic differences after varying macrophage activation (A) BMDMs and HMDMs were left untreated (naive, N), or stimulated with either LPS, LPS + IFNγ, or IL-4 for 24 h. (B and C) Levels of NO in supernatants from BMDMs (B) or HMDMs (both 1 × 105 cells per well) (C) and arginase activity in BMDMs (5 × 104 cells per well) (B) or HMDMs (1 × 105 cells per well) (C) following stimulation. (D and E) Levels of glucose consumption and lactate production in supernatants of BMDMs (D) or HMDMs (E) (all 1 × 105 cells per well). Data are shown as mean ± SEM For BMDMs, n = 12 mice with three technical replicates in four independent experiments were included for NO, glucose, and lactate assays, and n = 6 with three technical replicates in two independent experiments for arginase activity assay. For HMDMs, five human donors with three technical replicates in two independent experiments were included for all assays. ∗∗p < 0.01, ∗∗∗p < 0.001 by one-way ANOVA with Dunnett’s post hoc test for multiple comparisons.
Figure 3
Figure 3
XF analyses of BMDMs and HMDMs yield insight into metabolic profiles of macrophages after LPS ± IFNγ and IL-4-activation (A and B) Normalized (to relative Hoechst+ objects) ECAR, with injections of glucose, oligomycin, FCCP, and antimycin A/rotenone/Hoechst for BMDMs (A) and HMDMs (B). (C and D) Normalized (to relative Hoechst+ objects) OCR with same injections as for ECAR for BMDMs (C) and HMDMs (D). (E and G) Metabolic profiles outlining basal respiration and glycolysis for BMDMs (E) and HMDMs (G). (F and H) Mitochondrial and glycolytic contribution to overall ATP production in BMDMs (F) and HMDMs (H); n = 6 mice or n = 6 donors were included with four to five technical replicates each. Values shown as mean ± SEM calculated from the average of technical replicates per mouse/donor. ∗p < 0.05, ∗∗p < 0.01, ∗∗∗p < 0.001 by one-way ANOVA with Dunnett’s post hoc test for multiple comparisons. For (F) and (H), significance on top of bar graphs indicates changes in total ATP production rate; significance within bars indicates significant differences between either the glycolytic or mitochondrial contribution to ATP production rate compared with N.
Figure 4
Figure 4
Metabolic analysis of BMDMs and HMDMs with SCENITH reveals expected macrophage activation by LPS ± IFNγ, and IL-4 (A and B) MFI of puromycin across samples treated with different inhibitors for BMDMs (A) and HMDMs (B). DG, O and DGO indicate Deoxyglucose- (DG), oligomycin- (O), or deoxyglucose + oligomycin-treated (DGO) samples. (C) Calculations of metabolic SCENITH parameters based on puromycin MFI. (D, E, F, and H) SCENITH parameters as calculated for mouse (D and F) and human (E and H) macrophages. (G and I) Correlation of glycolytic capacity as measured with XF analysis with glycolytic capacity as measured with SCENITH for BMDMs (G) and HMDMs (I). (J and K) tSNE dimensionality reduction of naive, LPS ± IFNγ-, and IL-4-treated BMDMs (J) and HMDMs (K) and clustered heatmaps showing the expression of activation markers and puromycin per stimulus. Data are shown as mean ± SEM Each dot marks a separate mouse (n = 6) or human donor (n = 6). ∗p < 0.05, ∗∗p < 0.01, ∗∗∗p < 0.001 by two-way (A and B) or ordinary one-way ANOVA(D, E, F, and H) with Dunnett’s post hoc test for multiple comparisons. Correlations were fitted using a simple linear regression model (G and I).
Figure 5
Figure 5
Uptake of fluorescent probes provides additional insight into macrophage metabolism (A and B) Representative images of BMDM (A) and HMDM (B) staining by fluorescent dyes and uptake of fluorescent nutrient analogs as assessed by multi-mode reader. Scale bar represents 200 μm. (C–F) Fluorescence intensity of 2NB-DG (C and E) and BODIPY C16 (D and F) uptake by BMDMs (C and D) and HMDMs (E and F) as examined by flow cytometry, correlated with relevant parameters of XF analysis. (G–J) Fluorescence intensity of MitoTracker Green (G and I) and TMRM (H and J) analysis as examined by flow cytometry and correlations with relevant parameters of XF analysis in BMDMs (G and H) and HMDMs (I and J). Data are shown as mean ± SEM For graphs of fluorescent probes, each dot marks a separate mouse (n = 9) or donor (n = 8). ΔMFI was calculated as MFI (median fluorescence intensity) of sample – MFI of unstained control. ∗p < 0.05, ∗∗p < 0.01, ∗∗∗p < 0.001 by one-way ANOVA with Dunnett’s post hoc test for multiple comparisons. Correlations were fitted using a simple linear regression model.
Figure 6
Figure 6
An actionable workflow to guide researchers from simple screening toward complex measurement of immunometabolism Immunometabolic alterations can be pre-screened by quick and easy assays such as NO production and arginase activity in mouse macrophages and glucose consumption and lactate production in both species (yellow). Cytokine and viability measurements (green) can be performed in parallel to connect cellular metabolic changes and function. These assays can be followed up by metabolic characterization (purple) with a bulk (XF) analysis or single-cell approaches (SCENITH and fluorescent metabolic dyes). Normalization should be performed in parallel to XF analysis, and optional phenotyping can be done by adding activation and/or lineage markers to SCENITH and fluorescent metbolic dyes. Experiments can be further extended using more complex techniques (green), such as substrate utilization, metabolomics/fluxomics, RNA-seq for bulk analysis of homogeneous samples, or metabolic profiling using cytometry, single-cell RNA-seq, spatial metabolomics, or immunohistochemistry for complex samples where single-cell or spatial resolution is required. Solid lines indicate preferred workflow; dotted lines indicate optional readouts.

References

    1. Ahl P.J., Hopkins R.A., Xiang W.W., Au B., Kaliaperumal N., Fairhurst A.M., Connolly J.E. Met-Flow, a strategy for single-cell metabolic analysis highlights dynamic changes in immune subpopulations. Commun. Biol. 2020;3:305. doi: 10.1038/s42003-020-1027-9. - DOI - PMC - PubMed
    1. Arguello R.J., Combes A.J., Char R., Gigan J.P., Baaziz A.I., Bousiquot E., Camosseto V., Samad B., Tsui J., Yan P., et al. SCENITH: a flow cytometry-based method to functionally profile energy metabolism with single-cell resolution. Cell Metab. 2020;32:1063–1075.e67. doi: 10.1016/j.cmet.2020.11.007. - DOI - PMC - PubMed
    1. Artyomov M.N., Van den Bossche J. Immunometabolism in the single-cell era. Cell Metab. 2020;32:710–725. doi: 10.1016/j.cmet.2020.09.013. - DOI - PMC - PubMed
    1. Baardman J., Verberk S.G.S., Prange K.H.M., van Weeghel M., van der Velden S., Ryan D.G., Wust R.C.I., Neele A.E., Speijer D., Denis S.W., et al. A defective pentose phosphate pathway reduces inflammatory macrophage responses during hypercholesterolemia. Cell Rep. 2018;25:2044–2052.e45. doi: 10.1016/j.celrep.2018.10.092. - DOI - PubMed
    1. Bailey J.D., Diotallevi M., Nicol T., McNeill E., Shaw A., Chuaiphichai S., Hale A., Starr A., Nandi M., Stylianou E., et al. Nitric oxide modulates metabolic remodeling in inflammatory macrophages through TCA cycle regulation and itaconate accumulation. Cell Rep. 2019;28:218–230.e17. doi: 10.1016/j.celrep.2019.06.018. - DOI - PMC - PubMed

Publication types

LinkOut - more resources