. 2020 Sep 2:8:e00137.
doi: 10.1016/j.ohx.2020.e00137. eCollection 2020 Oct.

Open source arc analyzer: Multi-sensor monitoring of wire arc additive manufacturing

Affiliations

Open source arc analyzer: Multi-sensor monitoring of wire arc additive manufacturing

Adam M Pringle et al. HardwareX. .

Erratum in

Abstract

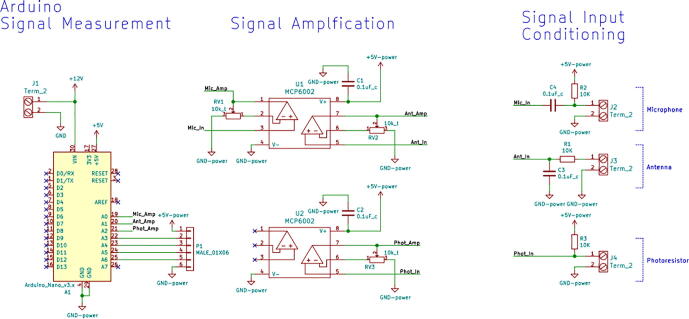
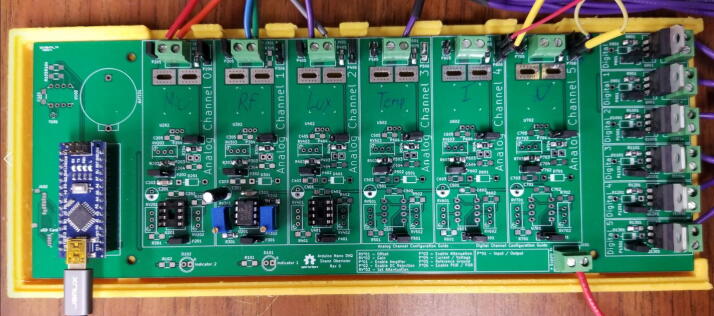
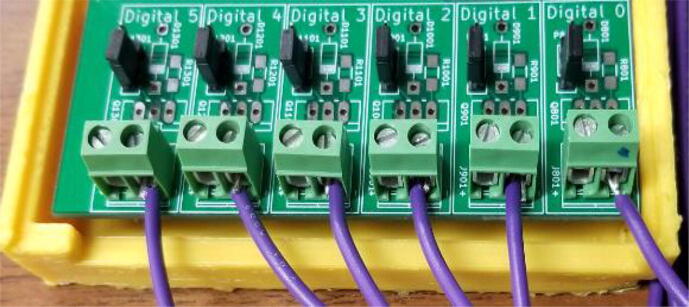
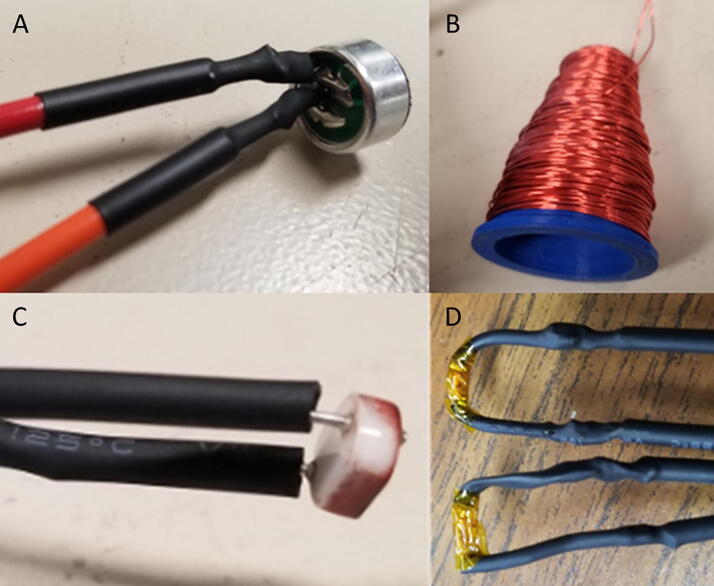
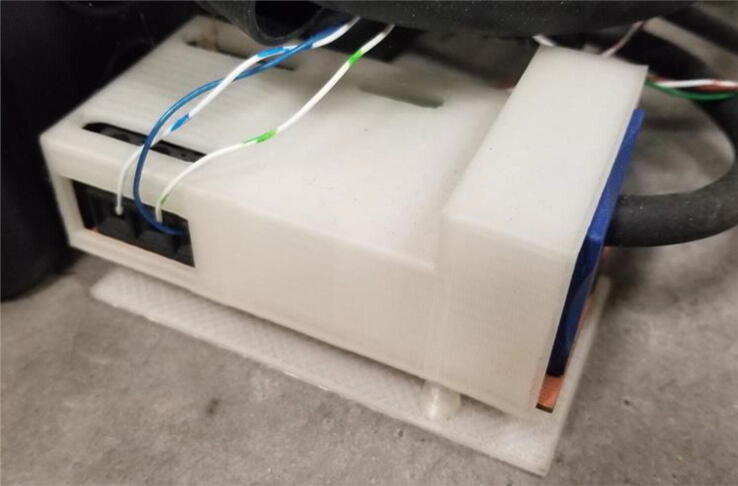
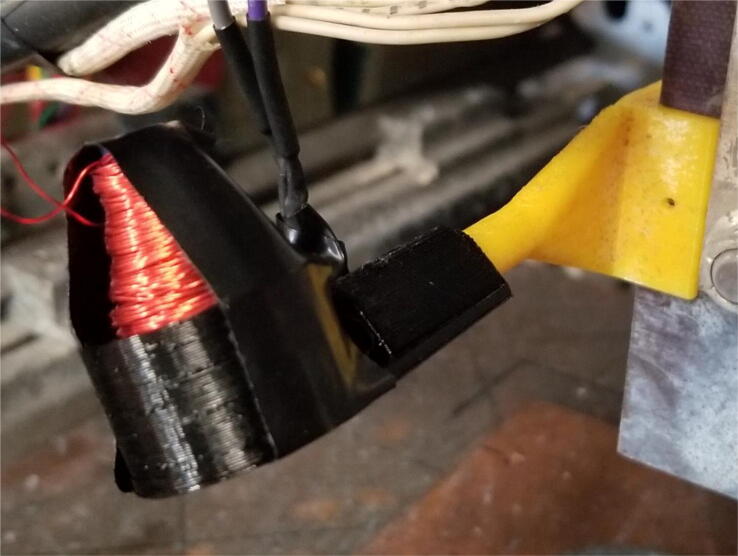
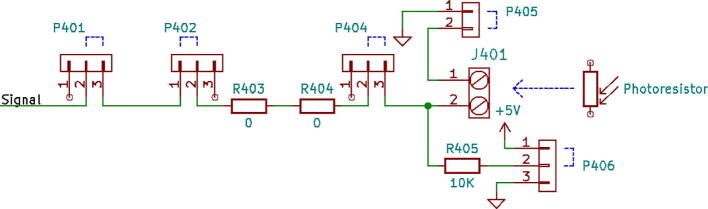
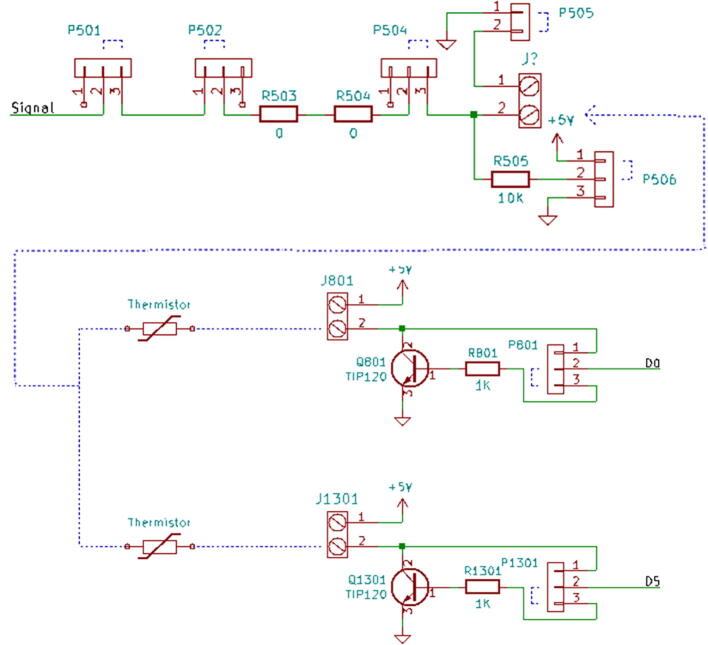
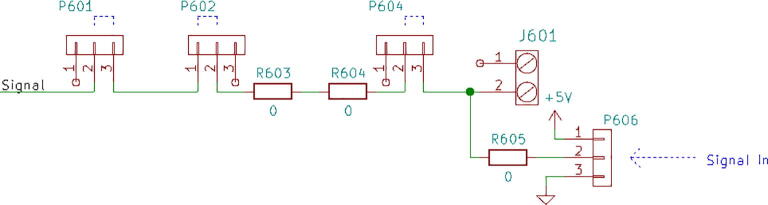
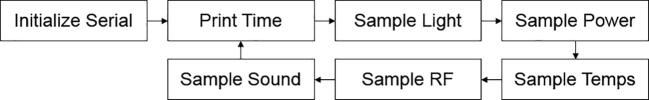
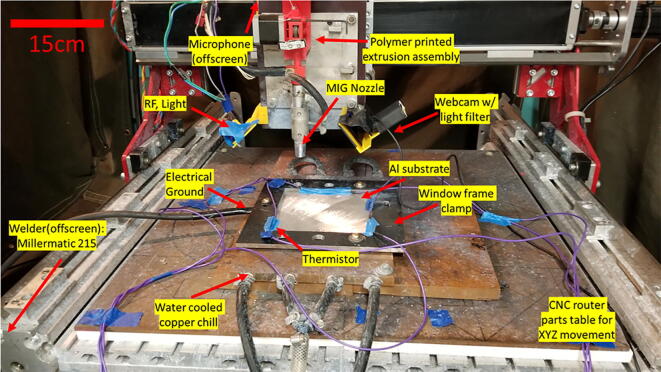
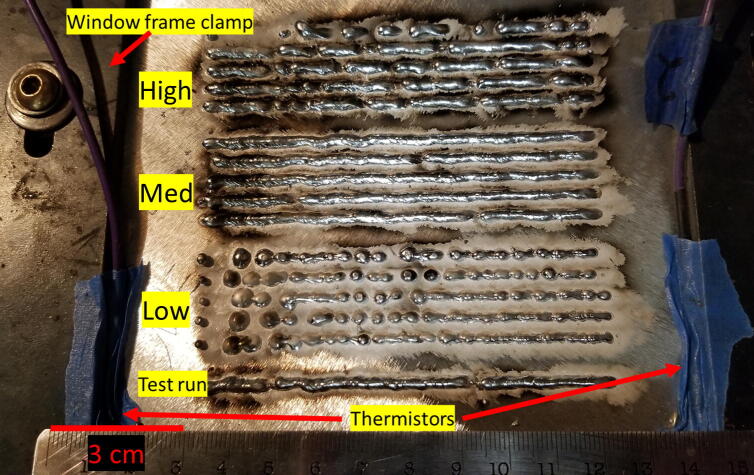
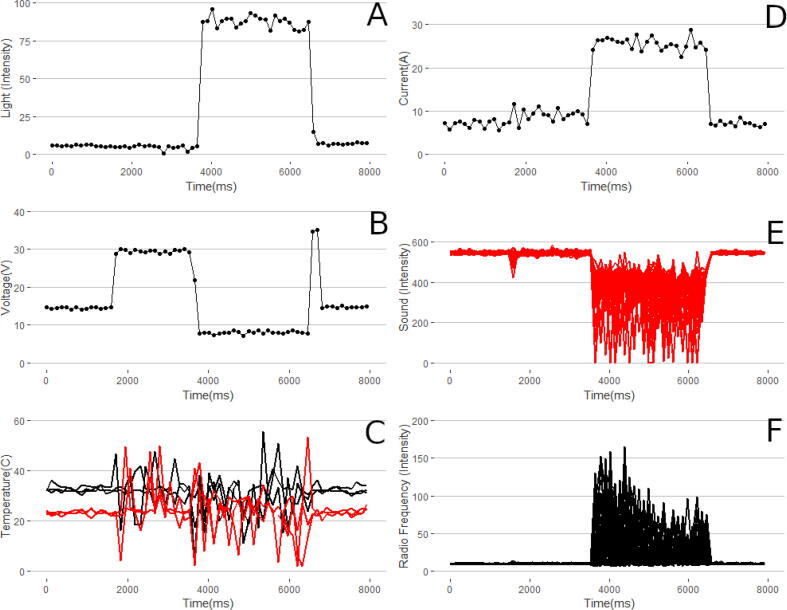
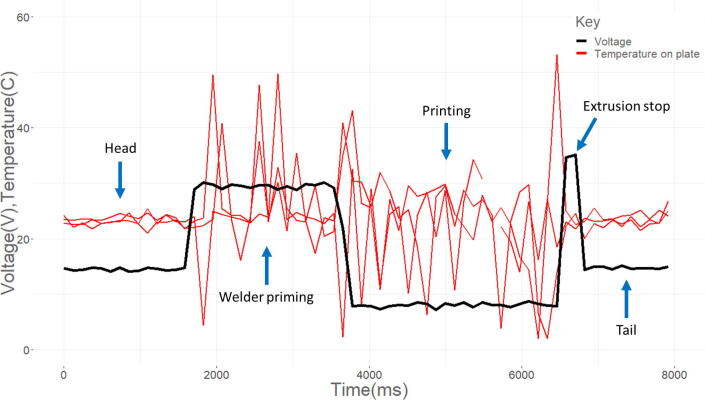
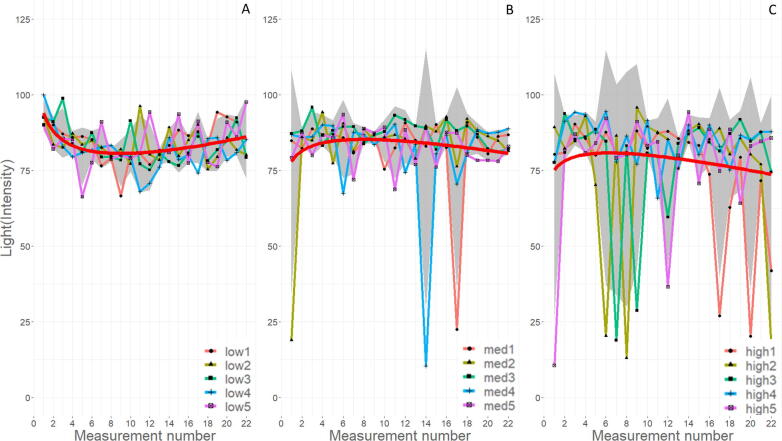
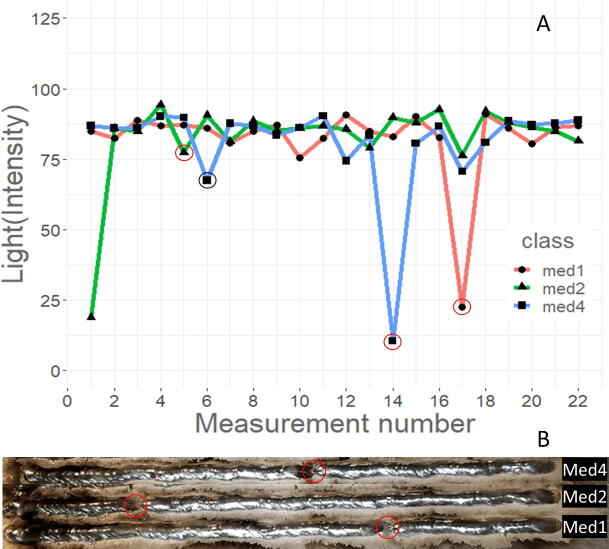
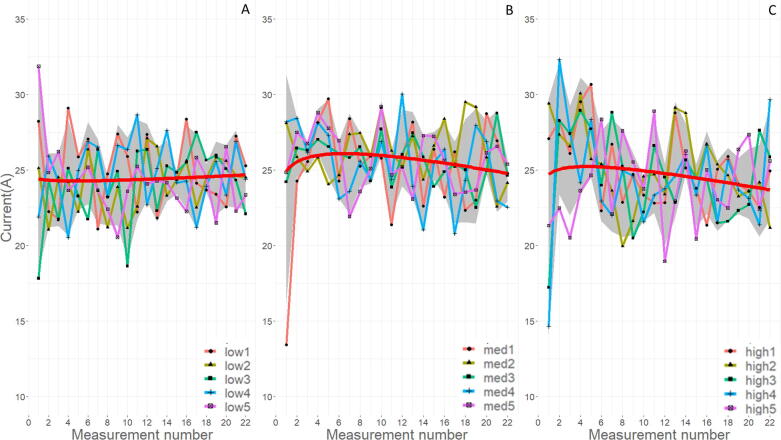
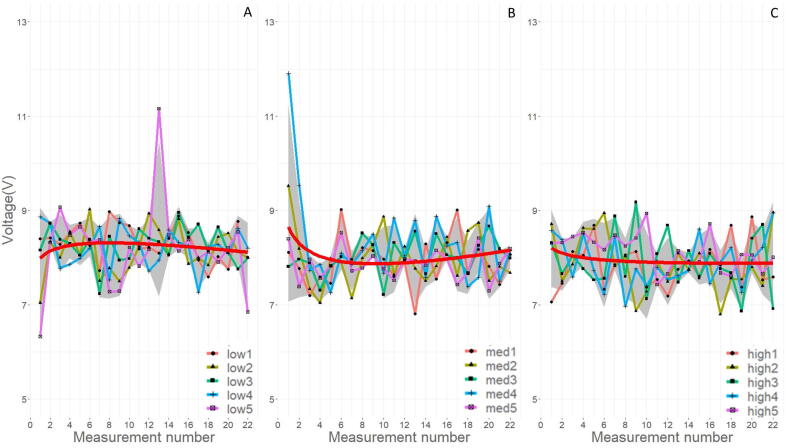
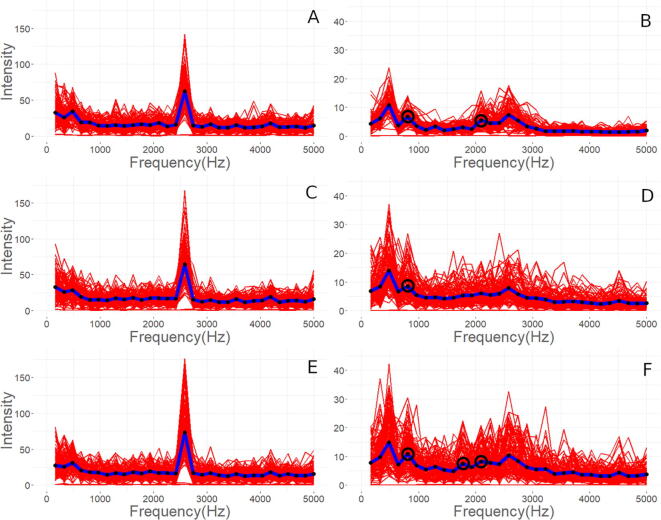
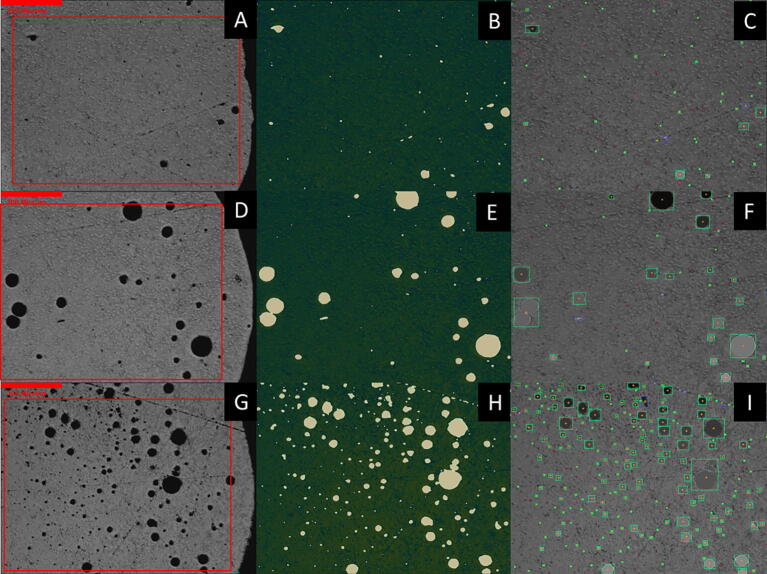
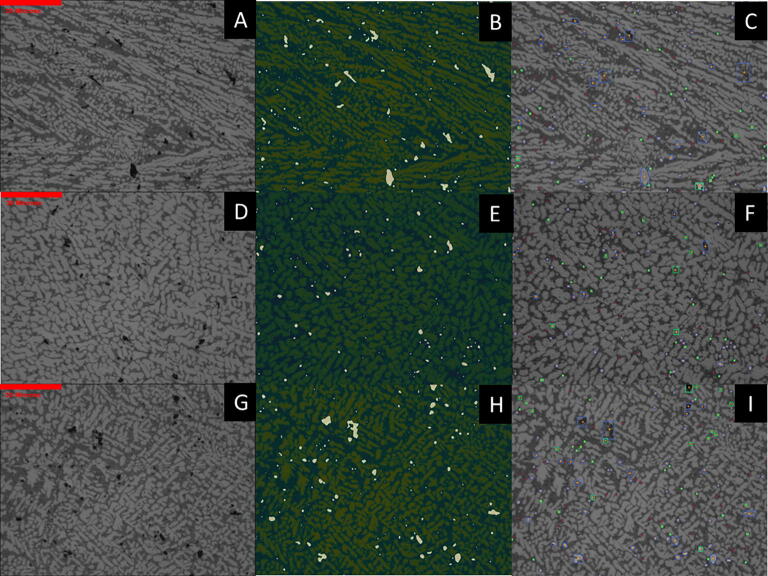
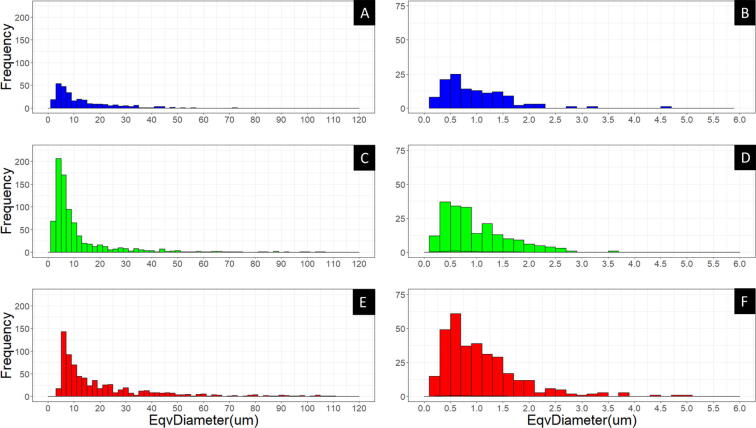
Low-cost high-resolution metal 3-D printing remains elusive for the scientific community. Low-cost gas metal arc wire (GMAW)-based 3-D printing enables wire arc additive manufacturing (WAAM) for near net shape applications, but has limited resolution due to the complexities of the arcing process. To begin to monitor and thus control these complexities, the initial designs of the open source GMAW 3-D printer have evolved to include current and voltage monitoring. Building on this prior work, in this study, the design, fabrication and use of the open source arc analyzer is described. The arc analyzer is a multi-sensor monitoring system for quantifying the processing during WAAM, which includes voltage, current, sound, light intensity, radio frequency, and temperature data outputs. The open source arc analyzer is tested here on aluminum WAAM by varying wire feed rate and measuring the resultant changes in the sensor data. Visual inspection and microstructural analysis of the printed samples looking for the presence of porosity are used as the physical indicators of quality. The value of the sensors was assessed and the most impactful sensors were found to be the light and radio frequency sensors, which showed arc extinction events and a characteristic "good weld" peak frequency.

Keywords: 3-D printing, gas metal arc weld, GMAW, metal inert gas welding, MIG welding, additive manufacturing, metal printing; Metal 3-D printing, low cost metal 3-D printer, open-source metal 3-D printer, GMAW 3-D printing; Open-source hardware; RepRap; WAAM; Welder; Welding; Wire Arc Additive Manufacturing.


Conflict of interest statement

The authors declare that they have no known competing financial interests or personal relationships that could have appeared to influence the work reported in this paper.

Figures

None
Graphical abstract
Fig. 1
Fig. 1
Arc Analyzer electrical schematics.
Fig. 2
Fig. 2
Arc Analyzer board with completed sensor circuits.
Fig. 3
Fig. 3
Digital I/O close up with six thermistors connected.
Fig. 4
Fig. 4
(A) microphone, (B) radio frequency antenna, (C) photoresistor, and (D) thermistors sensors used with the Arc Analyzer.
Fig. 5
Fig. 5
PLA casing covering voltage and current circuit attached around welding electrode constructed from Pinar et al. .
Fig. 6
Fig. 6
Clamping platform for radio frequency antenna and photoresistor held onto printer carriage.
Fig. 7
Fig. 7
Channel 0 on the Arc Analyzer shows the microphone circuit.
Fig. 8
Fig. 8
Channel 1 on the Arc Analyzer shows the radio frequency antenna circuit.
Fig. 9
Fig. 9
Channel 2 on the Arc Analyzer shows the photoresistor circuit.
Fig. 10
Fig. 10
Channel 3 on the Arc Analyzer shows thermistor circuit.
Fig. 11
Fig. 11
Channel 4 and 5 on the Arc Analyzer show the joining circuit with the specialized board .
Fig. 12
Fig. 12
Simple looping system used by the Arc Analyzer Arduino code.
Fig. 13
Fig. 13
Anaconda prompt for Jupyter Notebook open-sourced web application.
Fig. 14
Fig. 14
Jupyter Notebook interface detailing settings such as the measurement duration and filename designation.
Fig. 15
Fig. 15
Jupyter Notebook run all command (A), Franklin printer firmware run selected job command (B), and video recording (C).
Fig. 16
Fig. 16
Example data output first columns of saved txt file for data analysis.
Fig. 17
Fig. 17
The experimental WAAM setup, scale bar of 15 cm.
Fig. 18
Fig. 18
5 runs at each of the three different WFS, low, med, and high at 140, 201, and 245 mm/s, respectively. Print starts on left, and terminates on right.
Fig. 19
Fig. 19
Raw data gathered via the Arc Analyzer for a given testing period. A: light intensity B: voltage, C: six thermistor readings with three off the build platform in black, and three on the build platform in red, D: current, E: raw sound, and F: raw radio frequency.
Fig. 20
Fig. 20
Electromagnetic interference of welding process on thermistor sensor values, voltage in red, temperature sensor in black.
Fig. 21
Fig. 21
Change in photoresistor measured light intensity over the print duration for each WFS (A is low, B is med, and C is high), the red line is a smoothing formula = y ~ x + log(x), and a 95% confidence is shown in gray.
Fig. 22
Fig. 22
Change in photoresistor measured light intensity over the print duration for med1, med2, and med4 samples (A). Red circles match the light intensity drop with the physical defect in the weld line with the black circle representing a false drop (B).
Fig. 23
Fig. 23
Change in measured welding current over the print duration for each WFS (A is low, B is med, and C is high), red line is a smoothing formula = y ~ x + log(x), and a 95% confidence is shown in gray.
Fig. 24
Fig. 24
Change in measured welding voltage over the print duration for each WFS (A is low, B is med, and C is high), the red line is a smoothing formula = y ~ x + log(x), and 95% confidence is shown in gray.
Fig. 25
Fig. 25
Sound FFT (A, C, and E) and RF FFT (B, D, and F) where A and B is low extrusion, C and D is med WFS, and E and F is high WFS. The blue line is the average intensity at the measured frequency.
Fig. 26
Fig. 26
Optical microscopy of 50× magnification images of printed microstructure as-taken on left, high-contrast modified images in middle showing detected macro porosity, and fully thresholded images on right. A–C are the low WFS, D–F are the med WFS, and G–I are the high WFS.
Fig. 27
Fig. 27
Optical microscopy of 500× magnification images of printed microstructure as-taken on left, high-contrast modified images in middle showing detected micro porosity, and fully thresholded images on right. A–C are the low WFS, D–F are the med WFS, and G–I are the high WFS.
Fig. 28
Fig. 28
Histograms of porosity equivalent diameter, macro porosity on left, and micro porosity on right. A and B, C and D, E and F represent low (blue), med (green), and high (red) WFS respectively. (For interpretation of the references to colour in this figure legend, the reader is referred to the web version of this article.)

References

    1. Nilsiam Y., Sanders P., Pearce J. Applications of open source GMAW-based metal 3-D printing. J. Manuf. Mater. Process. 2018;2(1):18.
    1. Sells E., Bailard S., Smith Z., Bowyer A., RepRap O.V. Handbook of Research in Mass Customization and Personalization. World Scientific Publishing Company; 2009. The replicating rapid prototyper: maximizing customizability by breeding the means of production; pp. 568–580.
    1. Jones R., Haufe P., Sells E., Iravani P., Olliver V., Palmer C., Bowyer A. RepRap – the replicating rapid prototyper. Robotica. 2011;29:177–191. doi: 10.1017/S026357471000069X. - DOI
    1. Bowyer A. 3D printing and humanity’s first imperfect replicator. 3D print. Addit. Manuf. 2014;1:4–5. doi: 10.1089/3dp.2013.0003. - DOI
    1. Anzalone G.C., Zhang C., Wijnen B., Sanders P.G., Pearce J.M. A low-cost open-source metal 3-D printer. IEEE Access. 2013;1:803–810. doi: 10.1109/ACCESS.2013.2293018. - DOI