

An efficient variable selection method based on random frog for the multivariate calibration of NIR spectra
- PMID: 35498850
- PMCID: PMC9052783
- DOI: 10.1039/d0ra00922a
An efficient variable selection method based on random frog for the multivariate calibration of NIR spectra
Abstract
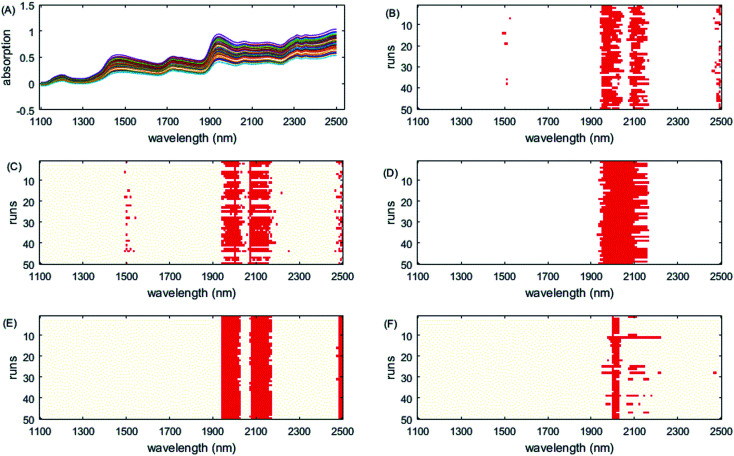
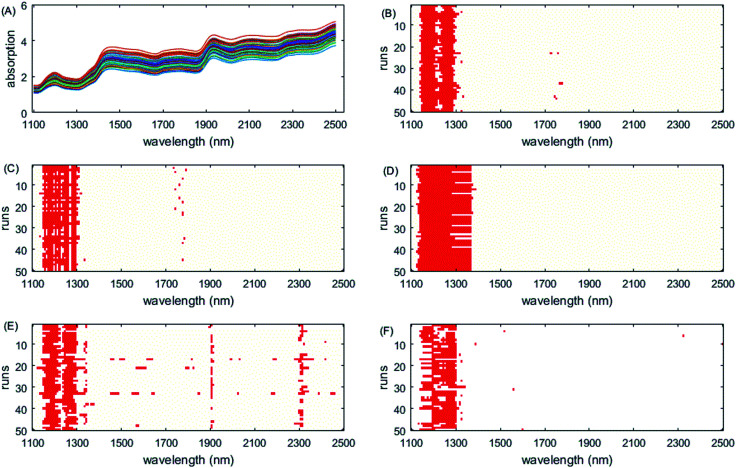
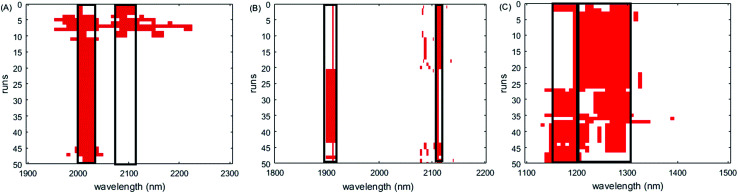
Variable selection is a critical step for spectrum modeling. In this study, a new method of variable interval selection based on random frog (RF), known as Interval Selection based on Random Frog (ISRF), is developed. In the ISRF algorithm, RF is used to search the most likely informative variables and then, a local search is applied to expand the interval width of the informative variables. Through multiple runs and visualization of the results, the best informative interval variables are obtained. This method was tested on three near infrared (NIR) datasets. Four variable selection methods, namely, genetic algorithm PLS (GA-PLS), random frog, interval random frog (iRF) and interval variable iterative space shrinkage approach (iVISSA) were used for comparison. The results show that the proposed method is very efficient to find the best interval variables and improve the model's prediction performance and interpretation.
This journal is © The Royal Society of Chemistry.
Conflict of interest statement
There are no conflicts to declare.
Figures


References
-
- Pasquini C. J. Braz. Chem. Soc. 2003;14:198–219. doi: 10.1590/S0103-50532003000200006. - DOI
-
- Stenberg B., Rossel R. A. V., Mouazen A. M. and Wetterlind J., in Advances in agronomy, Elsevier, 2010, vol. 107, pp. 163–215
-
- Gredilla A. de Vallejuelo S. F.-O. Elejoste N. de Diego A. Madariaga J. M. TrAC, Trends Anal. Chem. 2016;76:30–39. doi: 10.1016/j.trac.2015.11.011. - DOI
-
- Candes E. Tao T. Annals of Statistics. 2007;35:2313–2351. doi: 10.1214/009053606000001523. - DOI
LinkOut - more resources
Full Text Sources
Miscellaneous