

Epidemiological and sociodemographic transitions of female breast cancer incidence, death, case fatality and DALYs in 21 world regions and globally, from 1990 to 2017: An Age-Period-Cohort Analysis
- PMID: 35499053
- PMCID: PMC9039678
- DOI: 10.1016/j.jare.2021.07.012
Epidemiological and sociodemographic transitions of female breast cancer incidence, death, case fatality and DALYs in 21 world regions and globally, from 1990 to 2017: An Age-Period-Cohort Analysis
Abstract
Introduction: Breast cancer (BC) is the most widely studied disease due to its higher prevalence, heterogeneity and mortality.
Objectives: This study aimed to compare female BC trends among 21 world regions and globally over 28 year of data and to assess the association between sociodemographic transitions and female BC risks.
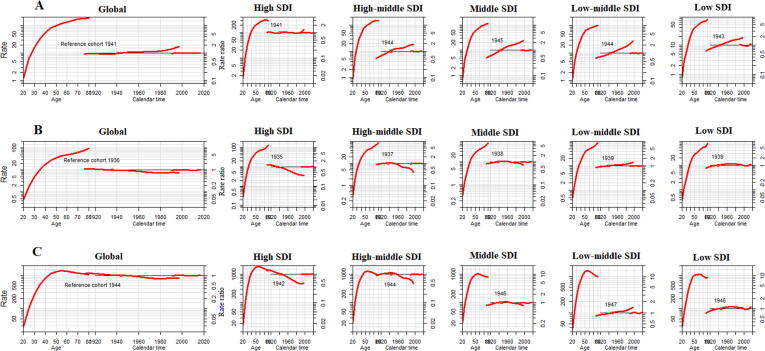
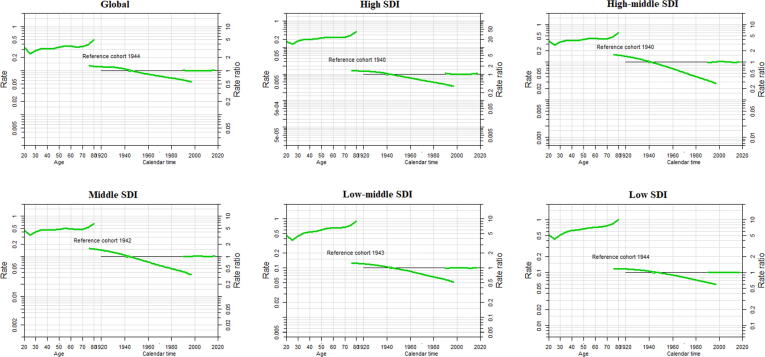
Methods: We used Global burden of disease study data and measure the female BC burden according to 21 world regions and sociodemographic indices (SDI). Age-period-cohort (APC) analysis was used to estimate time and cohort trend of BC in different SDI regions.
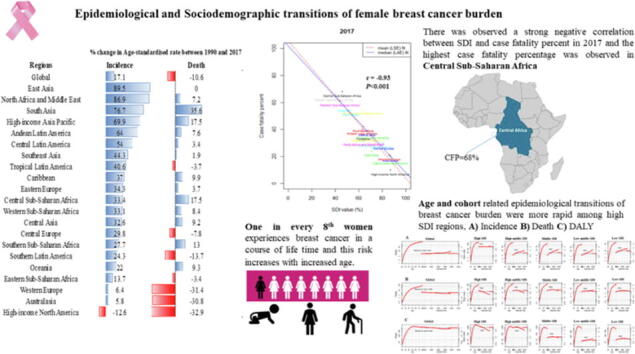
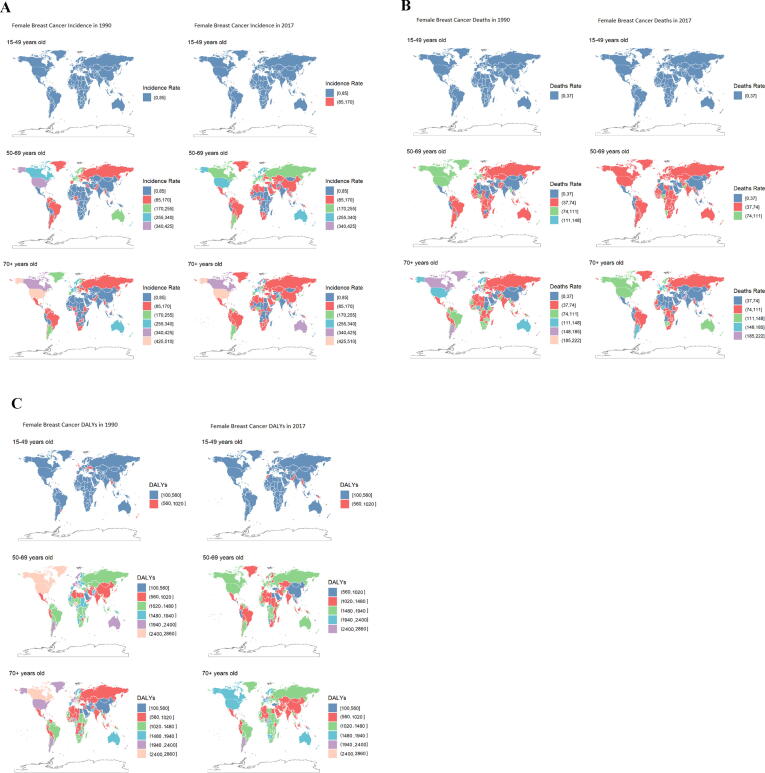
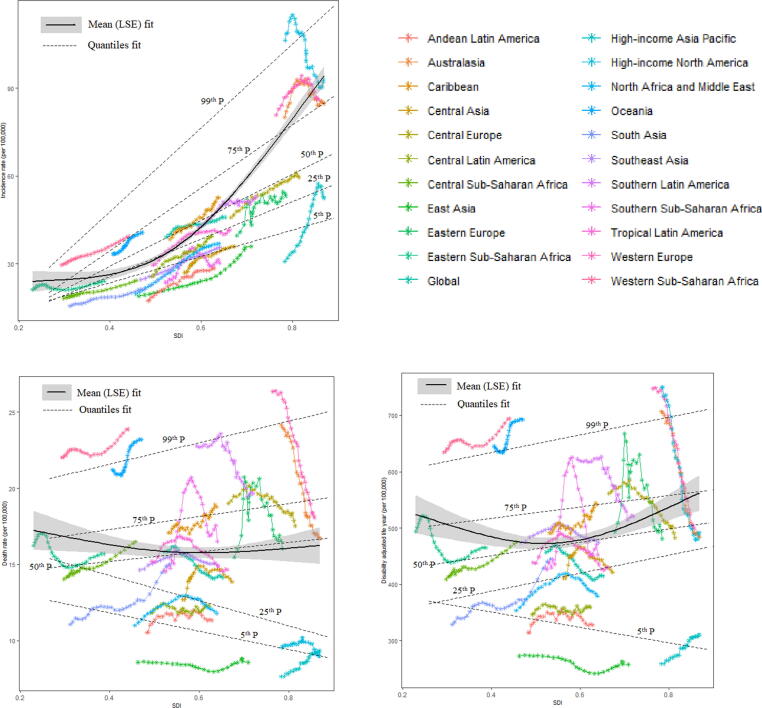
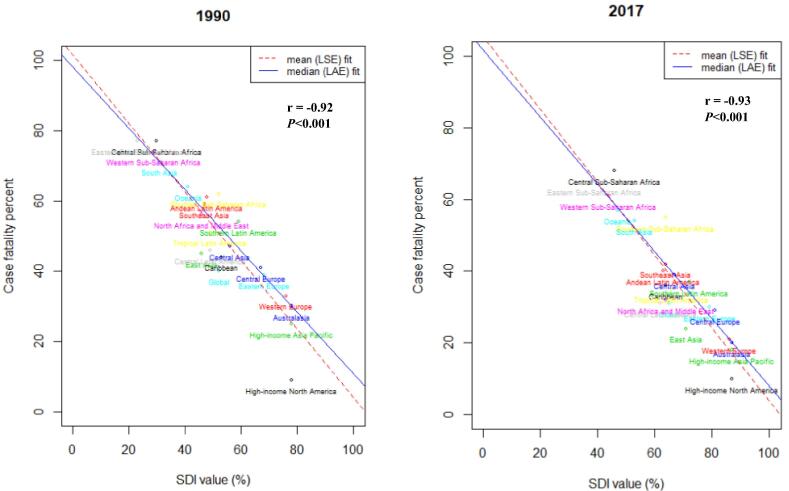
Results: By world regions, age-standardised rate of female BC incidence were high in high-income-North America (ASR, 92.9; (95 %UI, 89.2, 96.6)), Western Europe (84.7; (73.4, 97.2)) and Australia (86; (81.7, 90.2)) in 2017. Whereas this rate was significantly increased by 89.5% between 1990 and 2017 in East Asia. We observed negative association between SDI and death, and DALYs in 25th and below percentiles of death and DALYs for the worldwide regions. Further, there was observed a strong negative correlation between SDI and case fatality percent (r2017 = -0.93; r1990 = -0.92) in both 2017 and 1990 worldwide and highest case fatality percentage was observed in Central Sub-Saharan Africa. Overall, the risk of case-fatality rate tends to decrease most noticeably in high middle SDI countries, and the reduction of the risk of case-fatality rate in the recent cohort was the lowest in the low SDI countries.
Conclusions: Remarkable variations exist among various regions in BC burden. There is a need to reduce the health burden from BC in less developed and under developing countries, because under-developed countries are facing higher degree of health-related burden. Public health managers should execute more classified and cost-effective screening and treatment interferences to lessen the deaths caused by BC, predominantly among middle and low SDI countries having inadequate healthcare supplies.
Keywords: APC, age-period-cohort; ASDR, age-standardized death rates; ASIR, age-standardized incidence rates; Age-period-cohort; BC, breast cancer; Breast cancer; CFP, case-fatality-percent; CFR, case-fatality rates; Case fatality; DALYs, disability adjusted life years; DR, death rates; GBD, global burden of diseases; IR, incidence rates; Incidence; SDI, sociodemographic index; World regions; YLDs, years lived with disability; YLLs, years of life lost.
© 2022 The Authors. Published by Elsevier B.V. on behalf of Cairo University.
Conflict of interest statement
The authors declare that they have no known competing financial interests or personal relationships that could have appeared to influence the work reported in this paper.
Figures
References
-
- Fitzmaurice C., Akinyemiju T.F., Al Lami F.H., Alam T., Alizadeh-Navaei R., Allen C., et al. Global, regional, and national cancer incidence, mortality, years of life lost, years lived with disability, and disability-adjusted life-years for 29 cancer groups, 1990 to 2016: a systematic analysis for the global burden of disease study. JAMA Oncol. 2018;4(11):1553. doi: 10.1001/jamaoncol.2018.2706. - DOI - PMC - PubMed
-
- Fitzmaurice C., Abate D., Abbasi N., Abbastabar H., Abd-Allah F., Abdel-Rahman O., et al. Global, regional, and national cancer incidence, mortality, years of life lost, years lived with disability, and disability-adjusted life-years for 29 cancer groups, 1990 to 2017: a systematic analysis for the global burden of disease study. JAMA Oncol. 2019;5(12):1749. doi: 10.1001/jamaoncol.2019.2996. - DOI - PMC - PubMed
-
- Siegel RL, Miller KD, Jemal A. Cancer statistics, 2019. CA: A Cancer J Clinicians 2019; 69(1): 7–34. - PubMed
Publication types
MeSH terms
LinkOut - more resources
Full Text Sources
Medical
Miscellaneous
