. 2022 May 2;132(9):e156616.
doi: 10.1172/JCI156616.

Cross-species genetic screens identify transglutaminase 5 as a regulator of polyglutamine-expanded ataxin-1

Affiliations

Cross-species genetic screens identify transglutaminase 5 as a regulator of polyglutamine-expanded ataxin-1

Won-Seok Lee et al. J Clin Invest. .

Abstract

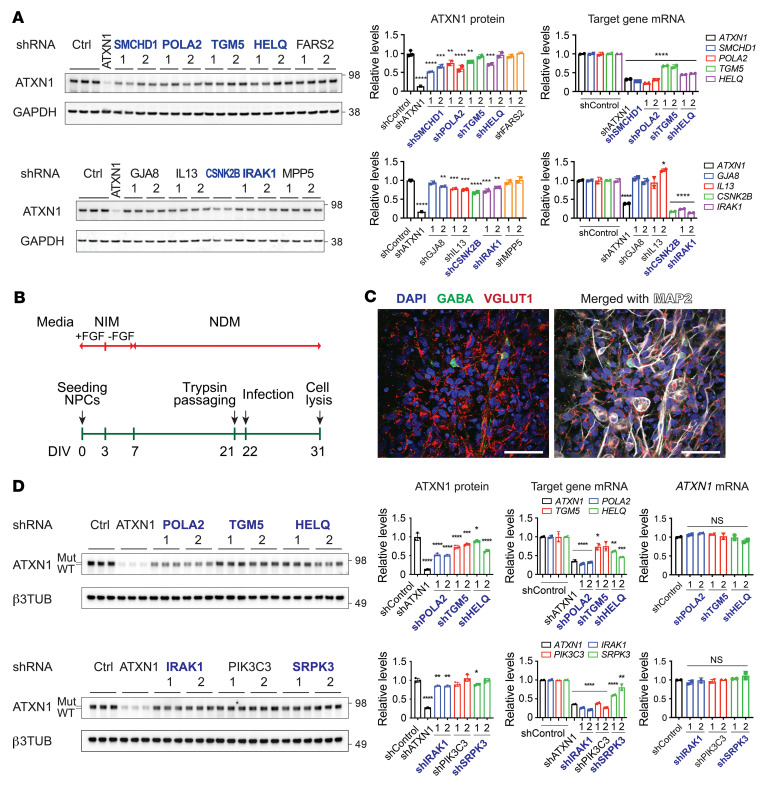
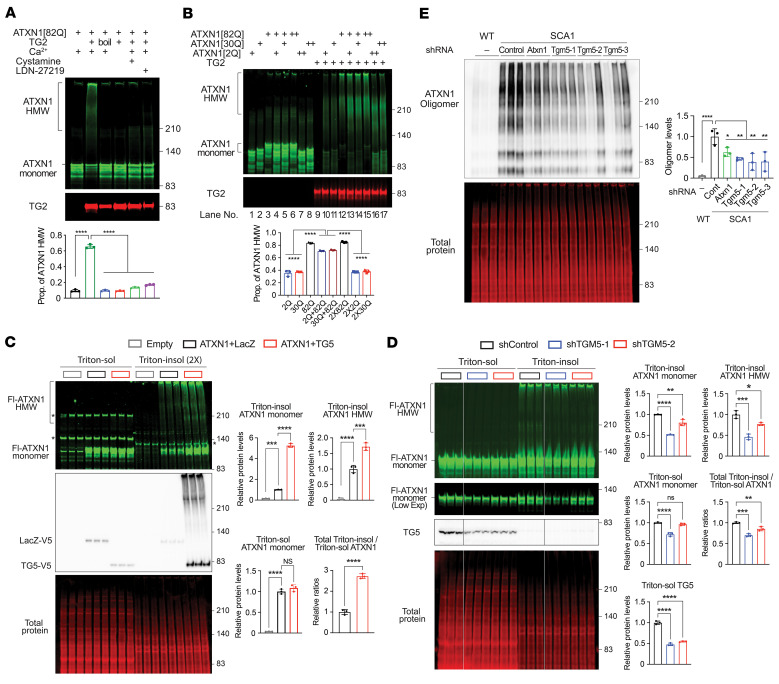
Many neurodegenerative disorders are caused by abnormal accumulation of misfolded proteins. In spinocerebellar ataxia type 1 (SCA1), accumulation of polyglutamine-expanded (polyQ-expanded) ataxin-1 (ATXN1) causes neuronal toxicity. Lowering total ATXN1, especially the polyQ-expanded form, alleviates disease phenotypes in mice, but the molecular mechanism by which the mutant ATXN1 is specifically modulated is not understood. Here, we identified 22 mutant ATXN1 regulators by performing a cross-species screen of 7787 and 2144 genes in human cells and Drosophila eyes, respectively. Among them, transglutaminase 5 (TG5) preferentially regulated mutant ATXN1 over the WT protein. TG enzymes catalyzed cross-linking of ATXN1 in a polyQ-length-dependent manner, thereby preferentially modulating mutant ATXN1 stability and oligomerization. Perturbing Tg in Drosophila SCA1 models modulated mutant ATXN1 toxicity. Moreover, TG5 was enriched in the nuclei of SCA1-affected neurons and colocalized with nuclear ATXN1 inclusions in brain tissue from patients with SCA1. Our work provides a molecular insight into SCA1 pathogenesis and an opportunity for allele-specific targeting for neurodegenerative disorders.

Keywords: Genetic diseases; Genetics; Molecular pathology; Neurodegeneration; Neuroscience.


Conflict of interest statement

Conflict of interest: HYZ is collaborating with UCB Pharmaceuticals and HTO with Ionis Pharmaceuticals on strategies to lower ATXN1. None of the work presented in this study is part of this collaboration.

Figures

Figure 1
Figure 1. Cross-species screen of druggable genes reveals potential regulators of ATXN1.
(A) Schematic representation of the cell-based screen. ATXN1 reporter cells produce RFP-ATXN1[82Q] and YFP from the same transcript through separate translation processes. ATXN1[82Q] levels are monitored by RFP/YFP ratio whereby YFP normalizes ATXN1 levels. After retroviral transduction of the reporter cells with pooled shRNA libraries targeting 7787 genes, cells were subjected to FACS to collect the cells with the lowest 5% and highest 5% RFP/YFP ratio. Genomic DNAs of these cells were extracted, and Illumina sequencing revealed relative enrichment of each shRNA in the sorted cells compared with the non-sorted bulk population. Identifying the genes targeted by the enriched or depleted shRNAs in each group revealed regulators of ATXN1 protein levels, which were filtered and prioritized (see Methods). (B) A diagram for modifier screen in Drosophila. Ectopic expression of human mutant ATXN1[82Q] in Drosophila eyes induces retinal degeneration. This fly was crossed with shRNA fly lines that target 1102 Drosophila genes corresponding to 2144 human homologs for identifying genes that suppress or exacerbate external eye phenotype. (C) The number of genes that overlapped between cell-based screen and Drosophila-based screen. The 156 positive regulators, including 70 genes that overlapped in the 2 screens and 86 top cell screen hits were selected for validation (See Methods for criteria applied). (D) A diagram for tiered validation of potential ATXN1 regulators. The number of genes before and after each validation step is displayed. (E) Summary of ATXN1[82Q] ELISA result presented as averaged percentage changes of ATXN1[82Q] levels after knockdown of 156 genes by 3 shRNAs in the ATXN1 reporter cells. MSK1 and ATXN1 were included as positive controls. (F) A representative ATXN1[82Q] ELISA result after knockdown of the genes that belong to the “others” and ”kinase/phosphatase” libraries. Individual bar displays ATXN1 levels of each shRNA. Blue-colored genes are selected for next validations. Data shown as mean ± SD, *P < 0.05, **P < 0.01, ***P < 0.001, ****P < 0.0001, 1-way ANOVA, post hoc Dunnett’s test.
Figure 2
Figure 2. Validation of ATXN1 regulators in Daoy cells and iPSC-derived neurons from patients with SCA1.
(A) Representative Western blot analysis of endogenous ATXN1 and qRT-PCR results of target genes after knockdown of 93 genes for 9 days in WT Daoy cells. ATXN1 shRNA was used as positive control. Data shown as mean ± SD, *P < 0.05, **P < 0.01, ***P < 0.001, ****P < 0.0001, 1-way ANOVA, post hoc Dunnett’s test for left graphs; Tukey’s test for right graphs. Blue-colored genes selected for further validation. (B) Culturing scheme of patient iPSC-derived neurons. iPSCs were first differentiated into NPCs, and then differentiated into neurons by incubating NPCs in NIM and NDM. (C) Immunofluorescent (IF) image of MAP2, VGLUT1, and GABA in the iPSC-derived neurons from patients with SCA1 after 3 weeks of differentiation. Scale bar: 50 μm. (D) Representative Western blot analysis of mutant and WT ATXN1, and qRT-PCR results of target genes and ATXN1 after knockdown of ATXN1 regulators for 9 days in iPSC-derived neurons from patients with SCA1. Blue-colored genes are validated ATXN1 regulators. Data shown as mean ± SD, *P < 0.05, **P < 0.01, ***P < 0.001, ****P < 0.0001, 1-way ANOVA, post hoc Dunnett’s test for the left and right graphs; Tukey’s test for the middle graphs.
Figure 3
Figure 3. Validation of TGM5, IRAK1, SRPK3, and STK16 in SCA1 animal models.
(A) Scanning electron microscopy images of Drosophila eyes expressing human ATXN1[82Q] with knockdown of Drosophila homologs of TGM5, IRAK1, SRPK3, or STK16. Scale bar: 100 μm in the top images; 10 μm in the bottom images. (B) Effect of TGM5 or STK16 knockdown on the motor performance of Drosophila SCA1 model expressing ATXN1[82Q] in the CNS. Data shown as mean ± SEM, *P < 0.05, linear mixed-effect model ANOVA. (C) Schematic representation for stereotaxic injection of adeno-associated virus serotype 9 (AAV9) carrying shRNAs into the cerebella of adult SCA1 mice (left), and representative fluorescence brain images with or without bright field taken after 4 weeks of the injection (right). Scale bar: 2 mm. (D) Western blot analysis of WT and mutant ATXN1 in the cerebella of SCA1 mice after the knockdown of Stk16, Tgm5, Irak1, or Srpk3 using 3 different shRNAs. Data shown as mean ± SD, *P < 0.05, **P < 0.01, ***P < 0.001, ****P < 0.0001; 1-way ANOVA was performed in ATXN1[2Q] and ATXN1[154Q] separately. Post hoc Dunnett’s test; 2-tailed t test was used for comparing ATXN1[2Q] and ATXN1[154Q]. (E) qRT-PCR data of the mRNA levels of the 4 genes knocked down in D. Data shown as mean ± SD, **P < 0.01, ***P < 0.001, ****P < 0.0001, 1-way ANOVA, post hoc Tukey’s test.
Figure 4
Figure 4. TGs regulate mutant ATXN1 levels and stability via their catalytic activity.
(A) Cell screen data of the genes that encode catalytically active TG. Positive and negative regulators are colored with green and pink, respectively. Color scale is based on the net number of suppressor shRNAs and represented next to the table. (B) Western blot analysis of ATXN1 levels after knockdown of TG2 for 9 days in iPSC-derived neurons from patients with SCA1. Data shown as mean ±SD, **P < 0.01, ***P < 0.001, ****P < 0.0001, 1-way ANOVA, post hoc Dunnett’s test. (C) Western blot analysis of ATXN1 levels after a treatment with TG2 inhibitor (LDN-27219) for 3 days on iPSC-derived neurons from patients with SCA1. Data shown as mean ± SD, **P < 0.01, 1-way ANOVA, post hoc Dunnett’s test. (D) Western blot analysis of ATXN1 levels after overexpression of either WT or catalytically inactive mutant TG2 in patient iPSC-derived neurons for 9 days. Data shown as mean ± SD, *P < 0.05, 1-way ANOVA, post hoc Tukey’s test. (E) Western blot analysis of ATXN1 levels after overexpression of either WT or catalytically inactive mutant TG5 in ATXN1 reporter cells for 3 days. Data shown as mean ± SD, ***P < 0.001, ****P < 0.0001, 1-way ANOVA, post hoc Tukey’s test. (F) Co-IP results of ATXN1[82Q] and ATXN1[30Q] with TG5 (top) or TG2 (bottom) in the HEK293T cells co-overexpressing ATXN1 and TG. V5-tagged TG5 or TG2 were pulled down and flag-tagged ATXN1 was immunoblotted. (G) Representative IF images of ATXN1[82Q] and TG5 (top) or TG2 (bottom) in Daoy cells overexpressing ATXN1[82Q] and TG5/2. Note that the 2 proteins colocalize. Scale bar: 20 μm. (H) Stability assay of inducibly expressed ATXN1 with different polyQ-length in Daoy cells expressing shTGM2 or shControl. After a 48-hour doxycycline treatment for inducing ATXN1 expression, media was exchanged into growth media without doxycycline, and cells were collected every 6 hours until 30 hours after the media change. Data shown as mean ± SD, *P < 0.05, ****P < 0.0001, 2-way ANOVA, post hoc Dunnett’s test.
Figure 5
Figure 5. TGs preferentially cross-link mutant ATXN1 and regulate its solubility and oligomerization.
(A) In vitro TG assay of ATXN1[82Q] with recombinant human TG2 under various conditions: with normal or heat-inactivated enzyme; with or without Ca2+ ion, pan-TG inhibitor cystamine (40 mM), or TG2-specific inhibitor LDN-27219 (2 mM). The proportion of ATXN1 high MW (HMW) species in each lane represented in bottom graph. Data shown as mean ± SD, ****P < 0.0001, 1-way ANOVA, post hoc Dunnett’s test. (B) In vitro TG assay of ATXN1[82Q], ATXN1[30Q], and ATXN1[2Q] with recombinant human TG2. Either 1× (+) dose or 2× (++) doses of ATXN1 was used for the reaction. The proportion of ATXN1 HMW species in lane 10–17 represented in bottom graph. Data shown as mean ± SD, ****P < 0.0001, 1-way ANOVA, post hoc Tukey’s test. (C) Western blot analysis of Triton X-100–soluble or –insoluble ATXN1 HMW species and monomer extracted from HEK293T cells overexpressing ATXN1[82Q] and TG5 or LacZ. Empty, empty vector; LacZ, overexpression control. Triton X-100–insoluble ATXN1 (HMW species + monomer) to Triton X-100–soluble ATXN1 (monomer) ratio in each overexpression group represented in bottom right graph. Asterisk indicates nonspecific bands. Data shown as mean ± SD, ***P < 0.001, ****P < 0.0001, 2-tailed t test for bottom right graph; 1-way ANOVA for other graphs with post hoc Dunnett’s test. (D) Western blot analysis of Triton X-100–soluble or –insoluble ATXN1 HMW species and monomer extracted from HEK293T cells overexpressing ATXN1[82Q] and shRNA against TG5. Triton X-100–insoluble ATXN1 (HMW species + monomer) to Triton X-100–soluble ATXN1 (monomer) ratio in each experimental group represented in middle right graph. Data shown as mean ± SD, *P < 0.05, **P < 0.01, ***P < 0.001, ****P < 0.0001, 1-way ANOVA, post hoc Dunnett’s test. (E) Western blot analysis of soluble ATXN1 oligomers in cerebellar lysate of WT mice and SCA1 mice expressing shTgm5 (same lysate in Figure 3D) using oligomer-specific F11G3 antibody. Data shown as mean ± SD, *P < 0.05, **P < 0.01, ****P < 0.0001, 1-way ANOVA, post hoc Dunnett’s test.
Figure 6
Figure 6. Tg modulates mutant ATXN1 and its toxicity in Drosophila SCA1 models.
(A) Western blot and qRT-PCR analyses of ATXN1[82Q] protein and mRNA levels after the knockdown of Tg with 2 different shRNAs in Drosophila eyes expressing ATXN1[82Q]. Knockdown of Tg was confirmed by qRT-PCR (bottom right). Protein lysates were extracted from the pooled 16 fly heads per genotype. Data shown as mean ± SD, *P < 0.05, ***P < 0.001, ****P < 0.0001, 1-way ANOVA, post hoc Dunnett’s test. (B) Western blot and qRT-PCR analyses of ATXN1[82Q] protein and mRNA levels after overexpression of Tg in Drosophila eyes expressing ATXN1[82Q]. Overexpression of Tg was confirmed by qRT-PCR (bottom right). Protein lysates were extracted from the pooled 8 fly heads per genotype. Data shown as mean ± SD, ***P < 0.001, ****P < 0.0001, 1-way ANOVA, post hoc Dunnett’s test. (C) Representative images of Drosophila eyes showing external organization of the ommatidia from negative control and flies expressing ATXN1[82Q] together with Tg or control shRNA. Note the severely degenerated eye with black necrotic patches upon the coexpression of Tg and ATXN1[82Q]. Scale bar: 100 μm in the top images; 50 μm in the bottom images. (D) Effect of Tg knockdown and (E) effect of Tg overexpression on the motor performance of Drosophila SCA1 model expressing ATXN1[82Q] in the CNS. Data shown as mean ± SEM, *P < 0.05, linear mixed-effect model ANOVA.
Figure 7
Figure 7. TG5 but not TG2 colocalizes with nuclear inclusions of ATXN1 in the pons of patients with SCA1.
(A) Representative IF images of ATXN1 nuclear inclusions (NIs) in the MAP2+ neurons that have large nuclei in the control and SCA1 patient pons. Scale bar: 50 μm. (B) Representative IF images of TG5 (left) and TG2 (right) in the neurons that display ATXN1 NIs in the pons of patients with SCA1. Control pons were also stained for comparison. White dashed-line boxes in the top images are enlarged in the bottom. Scale bar: 25 μm in the top images; 10 μm in the bottom images. (C) Quantification of the proportion of ATXN1 NIs that colocalize with TG. Images were obtained from 3 controls and 3 patients with SCA1, and the proportion was calculated from 20–30 NIs in each individual. Data shown as mean ± SD, ****P < 0.0001, 2-tailed t test. (D) Representative IF images of TG5 (left) and TG2 (right) in the CALB1+ Purkinje cells in control and SCA1 patient cerebellum. White dashed-line boxes in the middle images are enlarged in the bottom. Scale bar: 50 μm in the top and middle images; 20 μm in the bottom images. (E) Quantification of the proportion of Purkinje cells with nuclear TG. Images were obtained from 3 controls and 3 patients with SCA1, and the proportion was calculated from 18–24 Purkinje cells in each individual. Data shown as mean ± SD, **P < 0.01, ***P < 0.001, 2-way ANOVA, post hoc Tukey’s test.

References

    1. Skovronsky DM, et al. Neurodegenerative diseases: new concepts of pathogenesis and their therapeutic implications. Annu Rev Pathol. 2006;1:151–170. doi: 10.1146/annurev.pathol.1.110304.100113. - DOI - PubMed
    1. Gan L, et al. Converging pathways in neurodegeneration, from genetics to mechanisms. Nat Neurosci. 2018;21(10):1300–1309. doi: 10.1038/s41593-018-0237-7. - DOI - PMC - PubMed
    1. Soto C. Unfolding the role of protein misfolding in neurodegenerative diseases. Nat Rev Neurosci. 2003;4(1):49–60. doi: 10.1038/nrn1007. - DOI - PubMed
    1. Ross CA, Poirier MA. Protein aggregation and neurodegenerative disease. Nat Med. 2004:10 (suppl:S10–S17). doi: 10.1038/nm1066. - DOI - PubMed
    1. Farr SA, et al. Central and peripheral administration of antisense oligonucleotide targeting amyloid-β protein precursor improves learning and memory and reduces neuroinflammatory cytokines in Tg2576 (AβPPswe) mice. J Alzheimers Dis. 2014;40(4):1005–1016. doi: 10.3233/JAD-131883. - DOI - PMC - PubMed

Publication types