. 2022 May 2;132(9):e152383.
doi: 10.1172/JCI152383.

Activated SUMOylation restricts MHC class I antigen presentation to confer immune evasion in cancer

Affiliations

Activated SUMOylation restricts MHC class I antigen presentation to confer immune evasion in cancer

Uta M Demel et al. J Clin Invest. .

Abstract

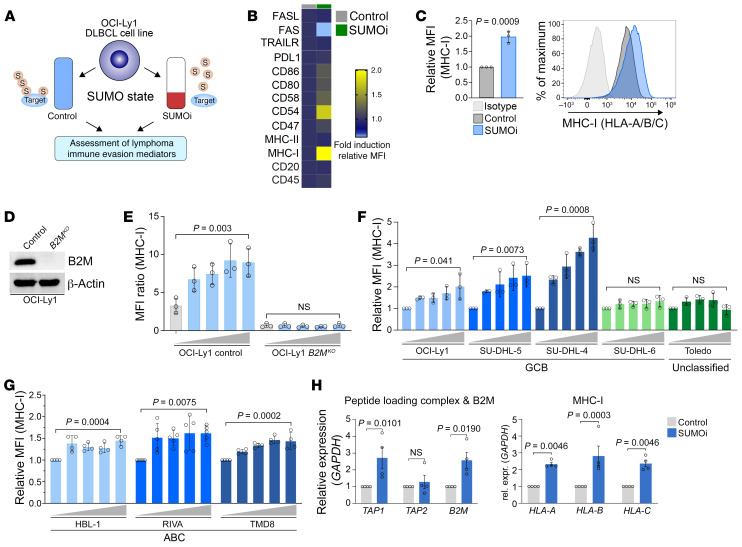
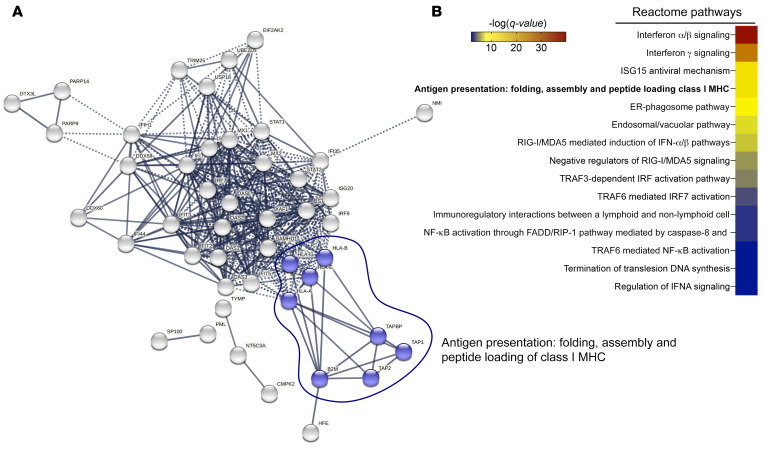
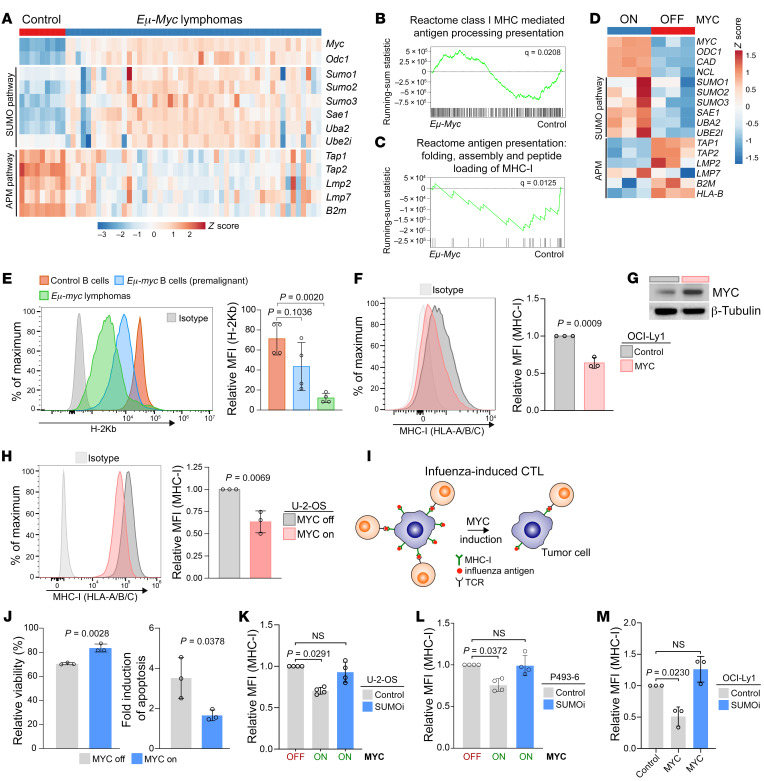
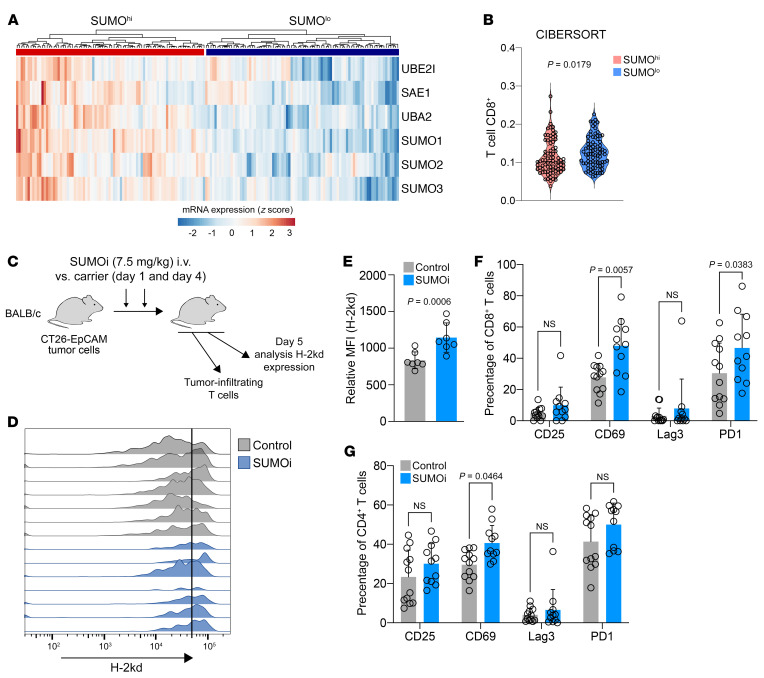
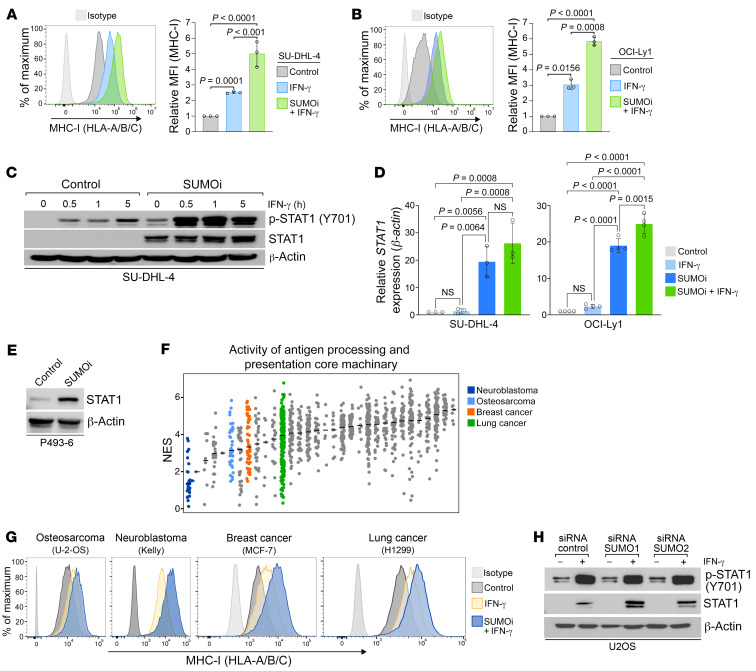
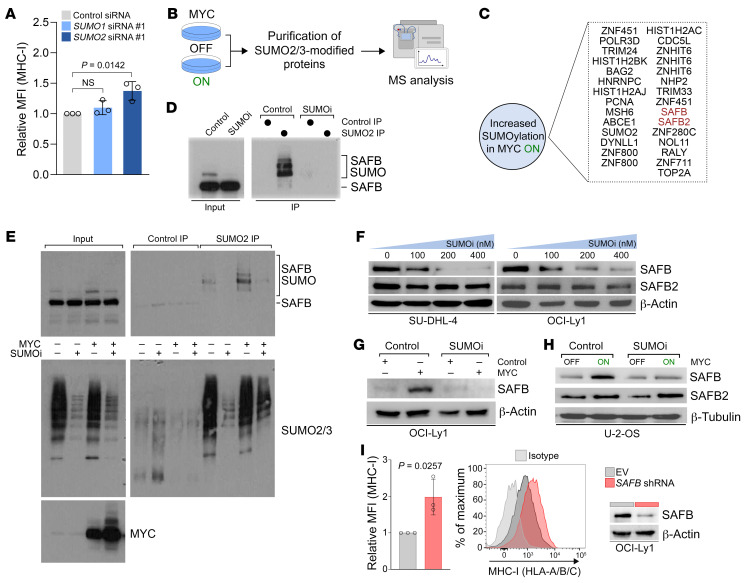
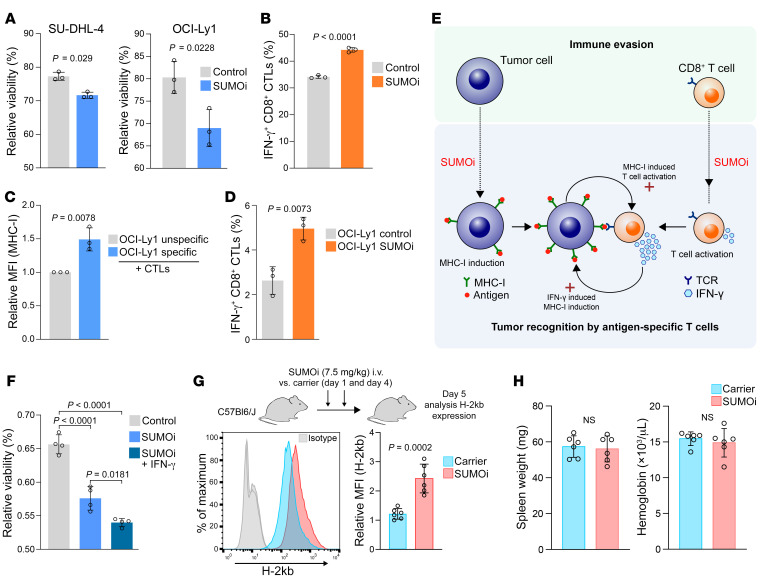
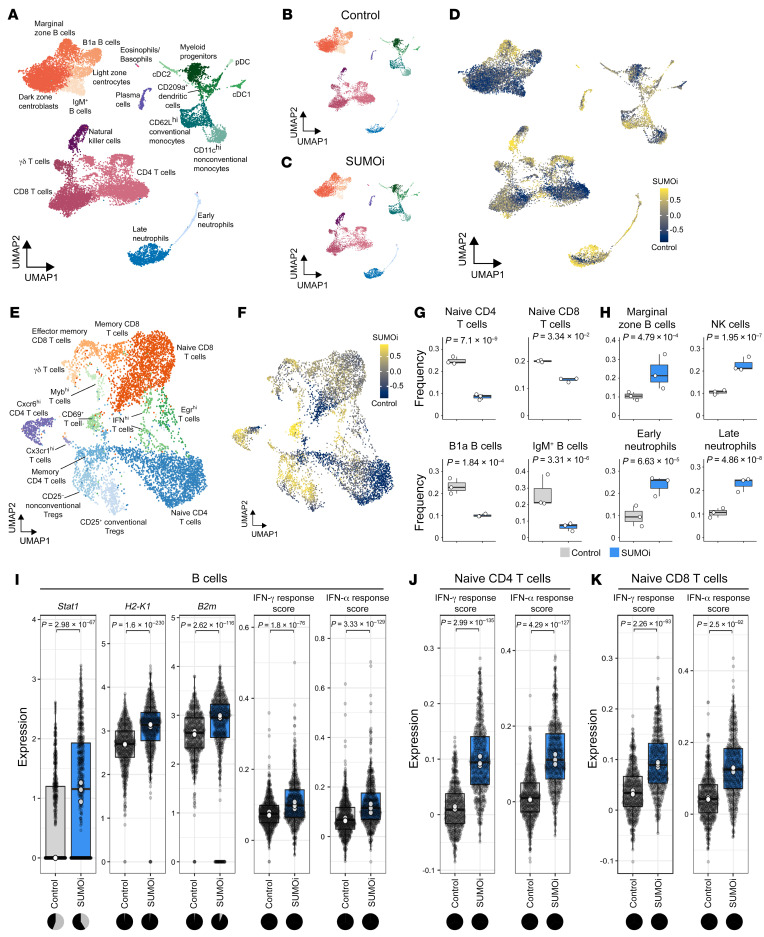
Activated SUMOylation is a hallmark of cancer. Starting from a targeted screening for SUMO-regulated immune evasion mechanisms, we identified an evolutionarily conserved function of activated SUMOylation, which attenuated the immunogenicity of tumor cells. Activated SUMOylation allowed cancer cells to evade CD8+ T cell-mediated immunosurveillance by suppressing the MHC class I (MHC-I) antigen-processing and presentation machinery (APM). Loss of the MHC-I APM is a frequent cause of resistance to cancer immunotherapies, and the pharmacological inhibition of SUMOylation (SUMOi) resulted in reduced activity of the transcriptional repressor scaffold attachment factor B (SAFB) and induction of the MHC-I APM. Consequently, SUMOi enhanced the presentation of antigens and the susceptibility of tumor cells to CD8+ T cell-mediated killing. Importantly, SUMOi also triggered the activation of CD8+ T cells and thereby drove a feed-forward loop amplifying the specific antitumor immune response. In summary, we showed that activated SUMOylation allowed tumor cells to evade antitumor immunosurveillance, and we have expanded the understanding of SUMOi as a rational therapeutic strategy for enhancing the efficacy of cancer immunotherapies.

Keywords: Antigen presentation; Immunology; Immunotherapy; Oncology; Ubiquitin-proteosome system.


Figures

Figure 1
Figure 1. SUMOi induces the MHC-I antigen processing and presentation pathway.
(A) Outline of the experimental setup for the identification of SUMO-dependent lymphoma immune evasion mechanisms. (B) Flow cytometry–based heatmap displaying the fold induction of MFI of immune evasion–associated surface markers of OCI-Ly1 cells treated with 40 nM SUMOi or control for 72 hours (n = 3). (C) Flow cytometric analysis of MHC-I expression of OCI-Ly1 cells treated with 40 nM SUMOi or DMSO (n = 3). Data represent the mean ± SD. P value was determined by unpaired t test. (D) Immunoblot analysis of OCI-Ly1 control and B2MKO cell lines. (E) Flow cytometric analysis of MHC-I expression of OCI-Ly1 control and B2MKO cell lines treated with increasing SUMOi concentrations (0, 20, 40, 80, 160 nM) for 72 hours (n = 3). Data represent the mean ± SD. P value was determined by ANOVA with Tukey’s post hoc test. (F) Flow cytometric analysis of MHC-I expression on 4 germinal center B cell–like cell lines and 1 unclassified DLBCL cell line treated with increasing concentrations of SUMOi (0, 20, 40, 80, 160 nM) for 72 hours (n = 3). Data represent the mean ± SD. P values were determined by ANOVA with Tukey’s post hoc test. (G) Flow cytometric analysis of MHC-I expression on 3 activated B cell DLBCL cell lines treated with increasing concentrations of SUMOi (RIVA: 0, 20, 40, 80, 160 nM (n = 5); HBL-1: 0, 2.5, 5, 10, 20 nM (n = 4); TMD8: 0, 5, 10, 20, 40 nM (n = 4)) for 72 hours. Data represent the mean ± SD. P values were determined by ANOVA with Tukey’s post hoc test. (H) mRNA expression analysis of the indicated MHC-I APM genes in SU-DHL-4 cells treated with SUMOi (100 nM, 72 h) or control (n = 4). Data represent the mean ± SEM. P values were determined by unpaired t test.
Figure 2
Figure 2. MS-based proteome analysis of SUMOi-treated DLBCL cell lines.
(A) STRING network analysis depicting the interconnection of proteins enriched after SUMOi treatment of human OCI-Ly1 and SU-DHL-4 DLBCL cell lines. Proteins enriched in OCI-Ly1, SU-DHL-4, or both cell lines were used as input for the network analysis. Only connected proteins are shown. (B) Proteins enriched in OCI-Ly1, SU-DHL-4, or both cell lines were analyzed using the Reactome database. The color-coded FDR q value is shown for all significantly enriched pathways.
Figure 3
Figure 3. MYC-driven suppression of the MHC-I/APM pathway confers immune evasion and can be restored by SUMOi.
(AC) Expression of the indicated genes in murine Eμ-Myc lymphomas compared with that in control B cells in the GSE7897 data set in the NCBI’s GEO and GSEA analysis. (D) Expression of the indicated genes after repression of MYC for 24 hours in the human P493-6 cell line in the GSE32219 data set in the NCBI’s GEO. (E) Surface MHC-I expression on B cells derived from WT mice (n = 4), premalignant Eμ-myc mice (n = 4), and Eμ-myc lymphomas (n = 4). Data represent the mean ± SD. P values were determined by ANOVA with Tukey’s post hoc test. (F) MHC-I expression of OCI-Ly1 control and MYC cell lines. Data represent the mean ± SD. P value was determined by unpaired t test. (G) Immunoblot analysis of OCI-Ly1 control and MYC cell lines. (H) MHC-I expression of U-2-OS cells after induction of MYC for 48 hours. Data represent the mean ± SD. P value was determined by unpaired t test. (I) Experimental setup of the coculture assay performed to assess CTL-mediated cytolysis. (J) Flow cytometric analysis of cell death and apoptosis of U-2-OS cells following MYC induction (48 h), after incubation for 4.5 hours with CTLs at an effector/target ratio of 5:1. Viability was determined by DAPI and annexin V staining (n = 3). Data represent the mean ± SD. P values were determined by unpaired t test. (K) MHC-I expression of U-2-OS cells treated with SUMOi (100 nM, 72 h) and after induction of MYC for 48 hours (n = 4). Data represent the mean ± SD. Statistical significance was determined by ANOVA with Tukey’s post hoc test. (L) MHC I expression on P493-6 cells treated with SUMOi (60 nM, 48 h) and repression of MYC for 48 hours (n = 3). Data represent the mean ± SD. Statistical significance was determined by ANOVA with Tukey’s post hoc test. (M) MHC-I expression on the OCI-Ly1 cells described in G treated with SUMOi (100 nM, 72 h) (n = 3). Data represent the mean ± SD. Statistical significance was determined by ANOVA with Tukey’s post hoc test.
Figure 4
Figure 4. Activated SUMOylation is associated with tumor-infiltrating T cells.
(A) Expression of SUMO core machinery genes in primary DLBCL samples (n = 176) in the GSE4475 data set in NCBI’s GEO clustering in a SUMOhi and SUMOlo cell population. (B) Analysis of tumor-infiltrating CD8+ T cells with CIBERSORT (68) in the SUMOhi and SUMOlo cell populations described in A. P value was determined by Mann-Whitney U test. (C) Experimental workflow for the analysis of H-2kd expression and tumor-infiltrating T cells in CT-26 tumors from mice treated with either SUMOi or carrier control. (D) H-2kd expression of murine CT26-EpCAM tumor cells on day 5 after SUMOi or carrier treatment on day 1 and day 4. (E) Quantification of H-2kd expression in murine CT26-EpCAM tumor cells on day 5 after SUMOi (n = 7) or carrier (n = 7) treatment on day 1 and day 4. Data represent the mean ± SD. P value was determined by unpaired t test. (F and G) Flow cytometry–based analysis of tumor-infiltrating CD8+ and CD4+ T cells with the indicated surface markers. Control, n = 12; SUMOi, n = 11. Data represent the mean ± SD. P values were determined by ANOVA with Šidák’s correction.
Figure 5
Figure 5. Activated SUMOylation restricts cytokine-dependent induction of MHC-I.
(A) MHC-I expression on SU-DHL-4 cells treated either with control, SUMOi (100 nM, 72 h), or SUMOi (100 nM, 72 h) and IFN-γ (100 U/mL) for 24 hours (n = 3). Data represent the mean ± SD. P values were determined by ANOVA with Tukey’s post hoc test. (B) MHC-I expression of OCI-Ly1 cells treated with control, SUMOi (40 nM, 72 h), or SUMOi (40 nM, 72 h) and IFN-γ (100 U/mL) for 24 hours (n = 3). Data represent the mean ± SD. P values were determined by ANOVA with Tukey’s post hoc test. (C) Immunoblot analysis of SU-DHL-4 cells treated with IFN-γ (100 U/mL) for the indicated durations after pretreatment with SUMOi (100 nM) or control for 72 hours. (D) STAT1 mRNA expression analysis of SU-DHL-4 (100 nM, 72 h; n = 3) and OCI-Ly1 (40 nM, 72 h; n = 4) cells treated with control or SUMOi and IFN-γ (100 U/mL) for 1 hour, as indicated. Data represent the mean ± SD. P values were determined by ANOVA with Tukey’s post hoc test. (E) Immunoblot analysis of P493-6 cells treated with 60 nM SUMOi for 48 hours. (F) Activity of the antigen processing and presentation core machinery determined with ssGSEA in cell lines listed in the Cancer Cell Line Encyclopedia. Each dot represents an individual cancer cell line (NES). Horizontal black lines indicate the median. (G) MHC-I expression after incubation with IFN-γ (100 U/mL) for 24 hours in the indicated cell lines pretreated with either SUMOi (U-2-OS, Kelly, MCF-7: 100 nM; H1299: 500 nM) or control for 72 hours. (H) Immunoblot analysis of U-2-OS cells after transfection with specific SUMO1, SUMO2, or control siRNAs (72 h) and treatment or not with IFN-γ (100 U/mL) for 24 hours.
Figure 6
Figure 6. MYC-induced SUMOylation of SAFB suppresses the MHC-I/APM pathway.
(A) MHC-I expression of U-2-OS cells after transfection with specific SUMO1, SUMO2, or control siRNAs (72 h, n = 3). Data represent the mean ± SD. Statistical significance was determined by ANOVA with Tukey’s post hoc test. (B) Outline of the experimental setup for the identification of MYC-induced differentially SUMOylated proteins. SUMO2/3-modified proteins were purified from U-2-OS cells after MYC induction for 48 hours and analyzed by MS. (C) Schematic illustration summarizing the results of quantitative MS analysis from U-2-OS cells after MYC induction for 48 hours. The experiment was performed in triplicate. (D) Immunoblot analysis of U-2-OS cells treated with 100 nM SUMOi or control for 72 hours and IP with either SUMO2 or a control antibody. (E) Immunoblot analysis of U-2-OS cells treated with 100 nM SUMOi or control for 72 hours after 48 hours of MYC induction and IP with either SUMO2 or control antibody. (F) Immunoblot analysis of SU-DHL-4 and OCI-Ly1 cells treated with the indicated concentrations of SUMOi (0, 100, 200, 400 nM) or control for 72 hours. (G) Immunoblot analysis of OCI-Ly1 cells transduced with an MYC expression plasmid or a control plasmid. The cells were treated with either 100 nM SUMOi or control for 72 hours. (H) Immunoblot analysis of U-2-OS cells after 48 hours of MYC induction, treated with either 100 nM SUMOi or control for 72 hours. (I) MHC-I expression of OCI-Ly1 cells after transduction with a specific SAFB shRNA or a control vector (n = 3). Data represent the mean ± SD. P value was determined by unpaired t test. Immunoblot analysis of the respective OCI-Ly1 cells.
Figure 7
Figure 7. SUMOi drives a feed-forward loop amplifying the antitumor immune response.
(A) Viability of OCI-Ly1 (40 nM SUMOi, 48 h) and SU-DHL4 (100 nM SUMOi, 48 h) cells (loaded with 2.5 μM peptide for 2 h) after coculturing with CTLs at effector/target ratio 5:1 for 5 h. DAPI staining and flow cytometry measurement (n = 3). P values determined by unpaired t test. (B) IFN-γ in CTLs treated with SUMOi (100 nM, 48 h) or control after coculturing for 16 hours with OCI-Ly1 cells (loaded with 2.5 M peptide for 2 h) at an effector/target ratio of 5:1 (n = 3). P value was determined by unpaired t test. (C) MHC-I expression on OCI-Ly1 cells loaded with a specific influenza or nonspecific control peptide (2.5 μM, 2 h) after coculturing for 12 hours with influenza-specific CTLs at an effector/target ratio of 2:1 (n = 3). P value was determined by unpaired t test. (D) IFN-γ expression in CTLs after coculturing for 16 hours with control or SUMOi-pretreated OCI-Ly1 cells (40 nM, 48 h, loaded with 0.02 μM peptide for 2 h) at an effector/target ratio of 5:1 (n = 3). P value was determined by unpaired t test. (E) SUMOi drives induction of the MHC-I/APM pathway in tumor cells and the activation of T cells. When both cell types are combined, SUMOi drives a feed-forward mechanism amplifying the antitumor immune response. (F) Viability of OCI-Ly1 cells (40 nM SUMOi, 48 h) incubated or not with IFN-γ (100 U/mL) for 24 hours (loaded with 2.5 μM peptide for 2 h) after coculturing for 5 hours with CTLs at an effector/target ratio of 5:1. DAPI staining and flow cytometric measurement (n = 4). P values were determined by ANOVA with Tukey’s post hoc test. (G) Experimental workflow and H-2Kb expression on B cells in WT mice treated with SUMOi (n = 6) or carrier (n = 6). P value was determined by unpaired t test. (H) Comparison of spleen weights and hemoglobin levels in WT mice treated with SUMOi (n = 6) or carrier (n = 6). P value was determined by unpaired t test. All data in the figure represent the mean ± SD.
Figure 8
Figure 8. SUMOi globally alters the immune landscape.
(A) UMAP visualization of spleen scRNA-Seq data from control and SUMOi-treated mice. (B) UMAP visualization of spleen scRNA-Seq data from control mice (n = 3). (C) UMAP visualization of spleen scRNA-Seq data from SUMOi-treated mice (n = 3). (D) Detection of differentially abundant cell populations in the spleens of control and SUMOi-treated mice using DA-Seq (71). Cells are colored by the DA-Seq measure. Yellow indicates greater abundance after SUMOi treatment; dark blue indicates greater abundance in the control. (E) The T cell populations identified in A were separated and reclustered. The UMAP visualization shows T cells for both conditions. (F) Detection of differentially abundant T cell populations in control and SUMOi-treated mice with DA-Seq. Cells are colored by the DA-Seq measure. Yellow indicates greater abundance after SUMOi treatment; dark blue indicates greater abundance in control mice. (G and H) Differential abundance testing on mouse-wise pseudo-bulks (white dots, n = 3). Bar plots indicate the respective subpopulation frequencies stratified by condition. The center line of the box plot is the median. The box extends from the 25th to 75th percentiles. The whisker length is from minimum to maximum. Significance was determined using a negative binomial generalized linear model. (G) Significantly more abundant cell populations were detected in control mice. (H) Significantly more abundant cell populations were detected in SUMOi-treated mice. (IK) Differential expression analysis in B cells (I), naive CD4+ T cells (J), and naive CD8+ T cells (K) of the genes of interest (normalized expression) and IFN response scores (arbitrary expression). Gray dots represent individual cells. White dots indicate the median per mouse-wise pseudo-bulk. The back line indicates the median across all cells. Wilcoxon’s rank-sum test was applied to determine significance. The adjusted P values (Bonferroni’s correction) are shown. The pie charts indicate the number of cells with normalized counts equal to 0 (gray) and normalized counts greater than 0 (black) for the respective genes and condition.

References

    1. Seeler JS, Dejean A. SUMO and the robustness of cancer. Nat Rev Cancer. 2017;17(3):184–197. doi: 10.1038/nrc.2016.143. - DOI - PubMed
    1. Hendriks IA, Vertegaal AC. A comprehensive compilation of SUMO proteomics. Nat Rev Mol Cell Biol. 2016;17(9):581–595. doi: 10.1038/nrm.2016.81. - DOI - PubMed
    1. Flotho A, Melchior F. Sumoylation: a regulatory protein modification in health and disease. Annu Rev Biochem. 2013;82:357–385. doi: 10.1146/annurev-biochem-061909-093311. - DOI - PubMed
    1. Kunz K, et al. SUMO-specific proteases and isopeptidases of the SENP family at a glance. J Cell Sci. 2018;131(6):jcs211904. doi: 10.1242/jcs.211904. - DOI - PubMed
    1. Nayak A, Muller S. SUMO-specific proteases/isopeptidases: SENPs and beyond. Genome Biol. 2014;15(7):422. doi: 10.1186/s13059-014-0422-2. - DOI - PMC - PubMed

Publication types

Substances