. 2022 May 2;132(9):e147253.
doi: 10.1172/JCI147253.

Loss of the collagen IV modifier prolyl 3-hydroxylase 2 causes thin basement membrane nephropathy

Affiliations

Loss of the collagen IV modifier prolyl 3-hydroxylase 2 causes thin basement membrane nephropathy

Hande Aypek et al. J Clin Invest. .

Abstract

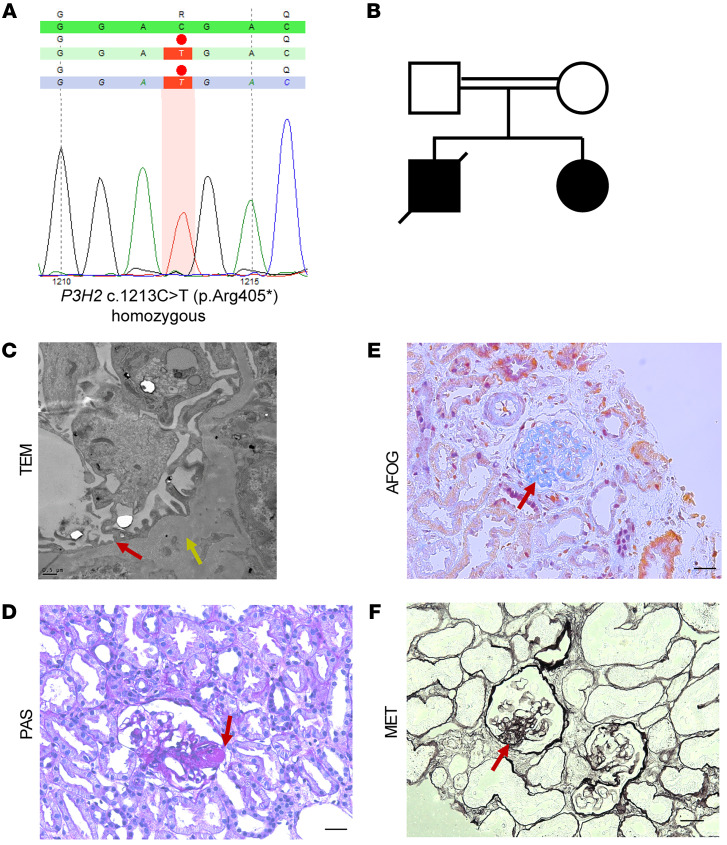
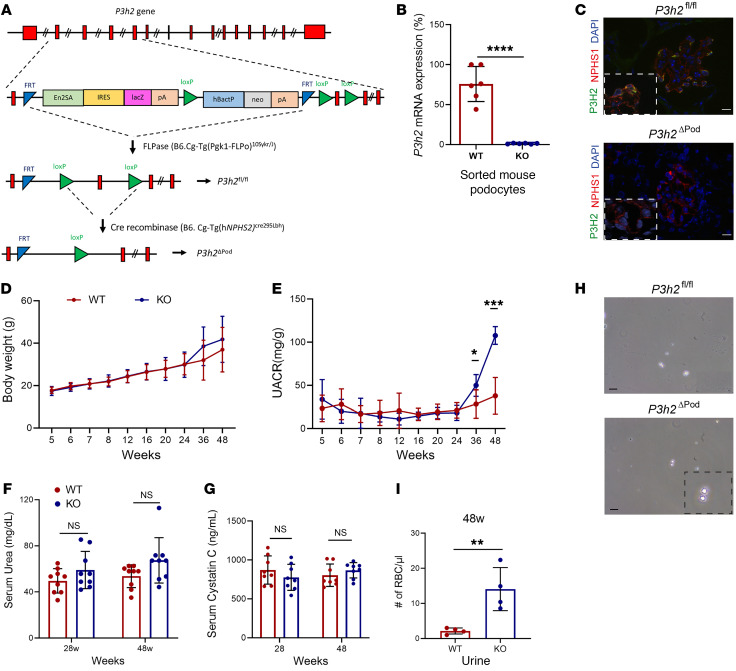
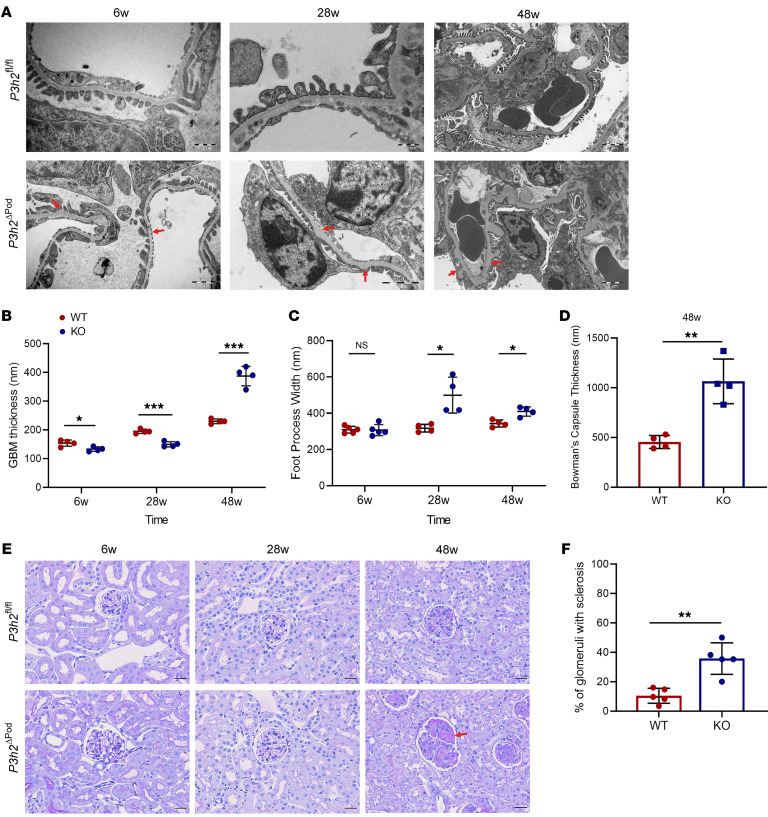
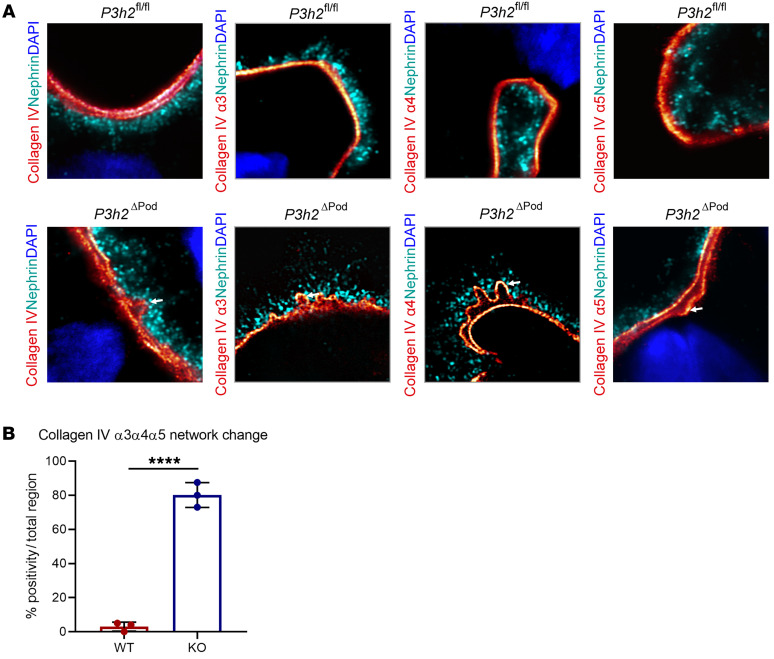
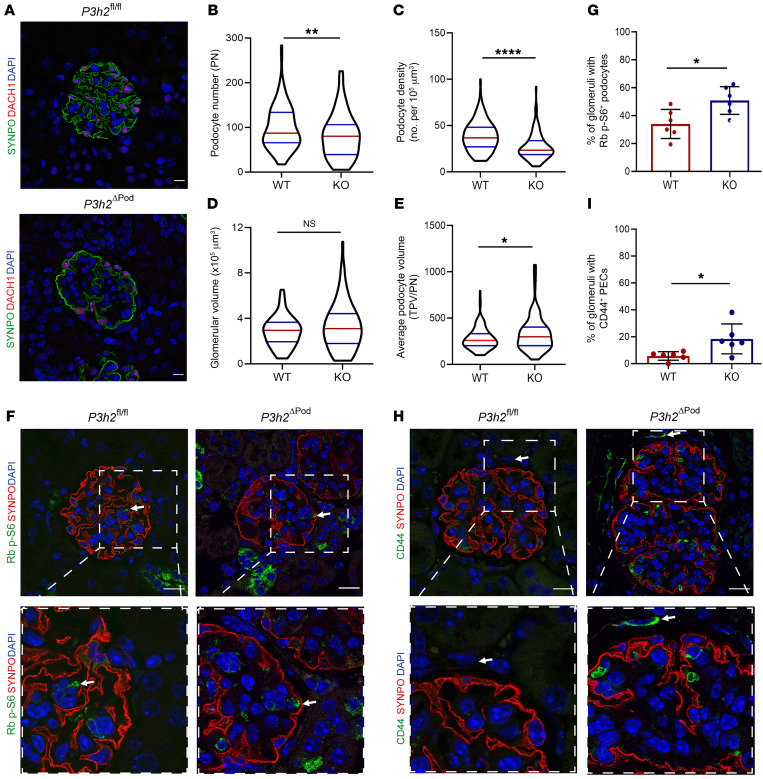
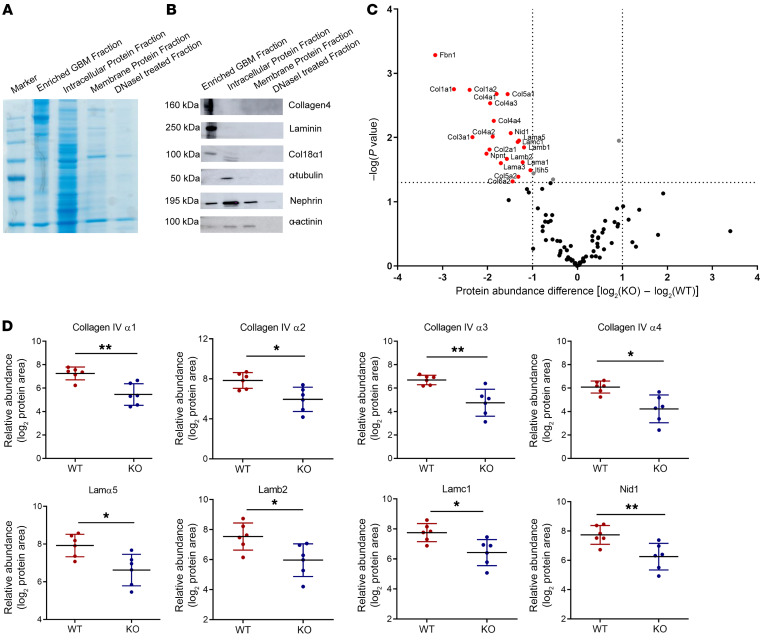
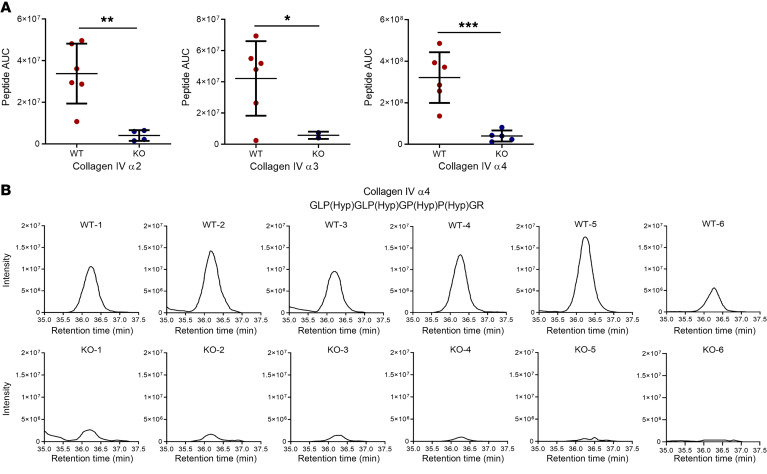
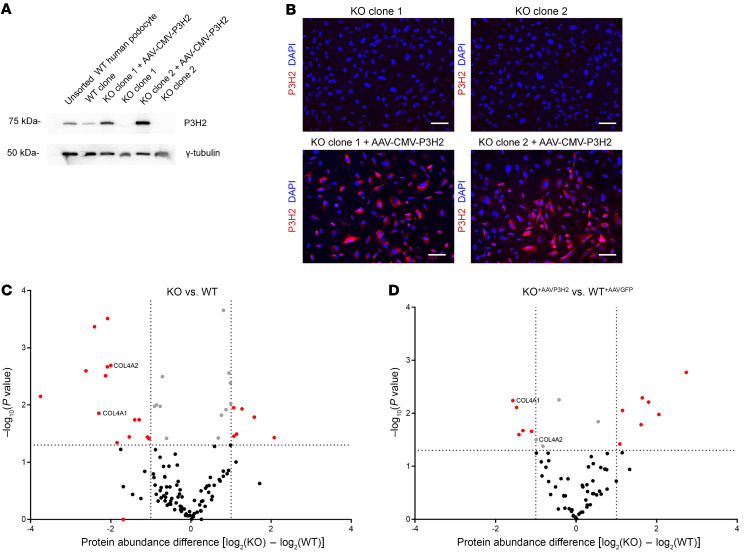
The glomerular filtration barrier (GFB) produces primary urine and is composed of a fenestrated endothelium, a glomerular basement membrane (GBM), podocytes, and a slit diaphragm. Impairment of the GFB leads to albuminuria and microhematuria. The GBM is generated via secreted proteins from both endothelial cells and podocytes and is supposed to majorly contribute to filtration selectivity. While genetic mutations or variations of GBM components have been recently proposed to be a common cause of glomerular diseases, pathways modifying and stabilizing the GBM remain incompletely understood. Here, we identified prolyl 3-hydroxylase 2 (P3H2) as a regulator of the GBM in an a cohort of patients with albuminuria. P3H2 hydroxylates the 3' of prolines in collagen IV subchains in the endoplasmic reticulum. Characterization of a P3h2ΔPod mouse line revealed that the absence of P3H2 protein in podocytes induced a thin basement membrane nephropathy (TBMN) phenotype with a thinner GBM than that in WT mice and the development of microhematuria and microalbuminuria over time. Mechanistically, differential quantitative proteomics of the GBM identified a significant decrease in the abundance of collagen IV subchains and their interaction partners in P3h2ΔPod mice. To our knowledge, P3H2 protein is the first identified GBM modifier, and loss or mutation of P3H2 causes TBMN and focal segmental glomerulosclerosis in mice and humans.

Keywords: Chronic kidney disease; Collagens; Monogenic diseases; Nephrology.


Conflict of interest statement

Conflict of interest: TBH has consultancy agreements with AstraZeneca, Bayer, Boehringer-Ingelheim, DaVita, Deerfield, Fresenius Medical Care, GoldfinchBio, Mantrabio, Novartis, and Retrophin; receives research funding from Amicus Therapeutics and Fresenius Medical Care; and is on the editorial board of Kidney International and the advisory board of Nature Reviews Nephrology. MG and TW are employees of the Medizinische Genetik Mainz, Limbach Genetics. In addition to his part-time faculty appointment at the University of Freiburg, CB is the Medical and Managing Director of Medizinische Genetik Mainz and Limbach Genetics GmbH.

Figures

Figure 1
Figure 1. Histologic examination of a kidney biopsy from a patient with a P3H2 gene mutation, in a cohort of patients with albuminuria.
(A) Exact position of the P3H2 mutation. A nonsense mutation was detected at exon 4, with transition from cytosine (C) to thymidine (T) at position 1213, leading to a premature stop codon. (B) Pedigree of the patient. The patient was the second child of consanguineous parents, who was diagnosed with FSGS. Her brother was also diagnosed with FSGS but died during childhood. (C) Foot process effacement (red arrow) and an irregular and thickened GBM (yellow arrow) was observed on TEM micrographs of the patient’s biopsy. Scale bar: 0.5 μm. (D) Representative PAS staining showed focal glomerulosclerosis (red arrow). (E) Fibrosis was observed on AFOG staining (red arrow). (F) Representative MET staining shows a thickened GBM (red arrow). Scale bars: 20 μm (DF).
Figure 2
Figure 2. Generation and characterization of P3h2ΔPod mice by urinalysis.
(A) Schematic strategy for the generation of P3h2ΔPod mice. (B) KO confirmation of the P3h2ΔPod mice. qPCR P3h2 mRNA expression analysis was performed in sorted podocytes from WT and KO mice. P3h2 mRNA levels were reduced by 99% in P3h2ΔPod mice compare with levels in P3h2fl/fl mice. (C) Immunofluorescence staining of WT and KO kidney tissues for P3H2, NPHS1, and DAPI. There was no detectable P3H2 in the P3h2ΔPod mouse podocytes. Scale bar: 10 μm; inset zoom, ×5. (D) Body weights of P3h2ΔPod and P3h2fl/fl mice were measured starting at 5 weeks until 48 weeks of age. There was no significant difference at any time point in body weights between the WT and KO mice (E) UACR of P3h2ΔPod and P3h2fl/fl mice. KO mice started to present with albuminuria at 36 weeks of age, and this had increased at 48 weeks of age. (F) Serum urea measurements for P3h2ΔPod and P3h2fl/fl mice. No significant increase was observed in the KO mice. (G) Serum cystatin C measurement for P3h2ΔPod and P3h2fl/fl mice. No significant increase was observed in the KO mice. (H) Hematuria was detected in spot urine of P3h2ΔPod mice. Representative images of urine from mice of each genotype. There were significantly more and dysmorphic RBCs in KO urine than WT urine. Scale bar: 50 μm: inset zoom, ×5. (I) Quantification of urinary RBCs under a light microscope. n ≥ 3. Graphs show the mean ± SD. *P < 0.05, **P < 0.01, ***P < 0.001, and ****P < 0.0001, by unpaired, 2-tailed Student’s t test.
Figure 3
Figure 3. Ultrastructural analysis and histological phenotypes of P3h2ΔPod and P3h2fl/fl mice.
(A) TEM micrographs of P3h2ΔPod and P3h2fl/fl mice at 6 weeks, 28 weeks, and 48 weeks. Red arrows indicate an abnormal GBM structure. Scale bars: 500 nm (top left and middle panels), 2 μm (top right panel), 1 μm (bottom left panel), and 2 μm (bottom middle and right panels). (B) Measurement of GBM thickness on TEM micrographs. At 6 weeks and 28 weeks, the KO mice had a thinner GBM, whereas at 48 weeks, the KO mice had a thicker GBM when compared with that of WT mice. (C) Foot process width measurement of WT and KO podocytes on TEM micrographs. Foot process widths were increased in 28- and 48-week-old KO mice when compared with WT foot process widths, indicating foot process effacement. (D) Bowman’s capsule thickness measurement on TEM micrographs of P3h2ΔPod and P3h2fl/fl mice at 48 weeks. The thickness of Bowman’s capsule was significantly increased in KO mice, indicating PEC activation. (E) PAS staining was performed at 6 weeks, 28 weeks, and 48 weeks. At 6 weeks and 28 weeks, the glomerular morphology was healthy in P3h2ΔPod mice. At 48 weeks, glomerulosclerosis and podocyte injury were observed in P3h2ΔPod kidney tissue (red arrow). Scale bar: 20 μm. (F) Quantification of glomerulosclerosis in P3h2ΔPod and P3h2fl/fl mice at 48 weeks. P3h2ΔPod mice had significantly more glomerulosclerosis than did P3h2fl/fl mice. n ≥4. Graphs show the mean ± SD. *P < 0.05, **P < 0.01, and ***P < 0.001, by unpaired, 2-tailed Student’s t test.
Figure 4
Figure 4. High-resolution imaging to visualize collagen IV α3α4α5 network formation.
(A) High-resolution imaging of glomeruli from P3h2ΔPod and P3h2fl/fl mice with expansion microscopy. In WT GBM, a linear collagen IV localization was observed for collagen IV and collagen IV α3, α4, and α5 proteins, indicating proper network formation. However, in KO GBM, collagen IV alignment was split, and irregular network formation (white arrows) was observed for collagen IV, collagen IV α3, α4, and α5 stainings, which showed disrupted network formation. Microscopy was performed with a LSM 800 with Airyscan using a ×63 objective, a digital zoom of ×8, and ×4 linear expansion of tissues. (B) Quantification of irregular network formation of collagen IV. Randomly chosen glomeruli from WT and KO mice were evaluated for linear and irregular collagen IV network formation. The graph shows that collagen IV network formation in KO GBM was significantly disrupted when compared with that in WT GBM, indicating that collagen IV α3, α4, and α5 proteins were unable to form a proper network in the absence of P3H2. n = 3. Graphs show the mean ± SD. ****P < 0.0001, by unpaired, 2-tailed Student’s t test.
Figure 5
Figure 5. Podocyte morphometric analysis of P3h2ΔPod and P3h2fl/fl mice.
(A) Representative immunofluorescence images of WT and KO mouse kidney tissue stained for SYNPO, DACH1, and DAPI. The images were used for the measurement of podocyte number, podocyte density, glomerular volume, and average podocyte volume (average podocyte volume = total podocyte volume/podocyte number [TPV/PN]). Scale bar: 10 μm. (B) Podocyte numbers for WT and KO mice. The number of podocytes was significantly decreased in KO mice glomeruli, indicating podocyte loss. (C) Podocyte density for WT and KO mice. In KO mouse glomeruli, the podocyte density was significantly decreased compared with that of WT glomeruli, again indicating podocyte loss. (D) Glomerular volume for WT and KO mice. There was no significant difference in glomerular volumes between WT and KO mice. (E) Average podocyte volume for WT and KO mice. A significant increase in the average podocyte volume was observed in KO mouse glomeruli, indicating podocyte hypertrophy. (F) Podocyte hypertrophy evaluation for P3h2ΔPod and P3h2fl/fl mice using immunofluorescence staining for ribosomal (Rb) p-S6, SYNPO, and DAPI. Representative immunofluorescence images show Rb p-S6 (green) in podocytes from both WT and KO mice (white arrows). Scale bars: 20 μm; inset zoom, ×5. (G) Quantification of immunofluorescence images showed a significant increase in podocyte hypertrophy in KO glomeruli when compared with WT glomeruli. (H) PEC activation analysis of P3h2ΔPod and P3h2fl/fl mice via immunofluorescence staining for CD44, SYNPO, and DAPI. Representative immunofluorescence images for KO mice show CD44 (green) signal in PECs (white arrow), indicating PEC activation. Representative immunofluorescence images for WT mice show no CD44+ signal in PECs (white arrow). Scale bars: 20 μm. Inset zoom, ×5. (I) Quantification of immunofluorescence images indicated a significant increase in the percentage of glomeruli with activated PECs in KO mice when compared with those of WT mice. n = 6. Data show the mean ± SD. *P < 0.05, by unpaired, 2-tailed Student’s t test. Graphs in BE show the median ± IQR (n ≥6); *P < 0.05, **P < 0.01, and ****P < 0.0001, by Mann-Whitney U test. Graphs in G and I show the mean ± SD (n = 6).
Figure 6
Figure 6. Relative quantitative proteomics of the GBM of P3h2ΔPod and P3h2fl/fl mice.
(A) Coomassie blue staining of enriched GBM and further fractions collected during GBM isolation. The GBM fraction had high-molecular-weight protein bands indicating that the isolated GBM was enriched with ECM proteins. The intracellular protein fraction had protein bands of variable size, showing that during isolation, many intracellular proteins were separated from the enriched GBM. (B) Western blot analysis of the GBM and other fractions for quality control of isolated GBM. ECM proteins were detected in high abundance in the enriched GBM fraction. Intracellular and transmembrane proteins were in low abundance or not detected in the enriched GBM fraction when compared with intracellular and membrane protein fractions. (C) Volcano plot of the relative quantitative GBM proteome. The x axis shows log2 fold changes in the abundance of WT and KO GBM proteins, and the y axis shows the P values for the GBM proteins. The abundance of the main structural GBM proteins was decreased in KO mice, as shown in the left portion of the plot. The vertical dotted line marks the –log(P value) cutoff of 1.3, above which all proteins are considered statistically significant; the dotted horizontal lines indicate the protein abundance difference [log2(KO) – log2(WT)] cutoff of less and –1 or greater than 1. Proteins with a –log(P value) of greater than 1.3 and a difference 1 or less are highlighted in red. (D) Dot plots of the structural proteins in the GBM showing a difference in their abundance. Comparison of the relative abundance values of the GBM proteome of each mouse group shows a significant decrease in the main GBM structural proteins. n = 6. Graphs show the mean ± SD. *P < 0.05 and **P < 0.01, by unpaired, 2-tailed Student’s t test.
Figure 7
Figure 7. 3Hyp analysis of collagen IV α2, α3, and α4.
(A) Three different collagen IV peptides were chosen to show the effect of P3h2 deletion on 3Hyp of proline residues. It shows that in KO GBM, selected collagen IV α2, α3 and α4 peptides had significantly less 3Hyp in proline residues than did WT GBM. (B) Individual 3Hyp intensity graphs of the collagen IV α4 peptide (GLP(Hyp)GLP(Hyp)GP(Hyp)P(Hyp)GR). 3Hyp were analyzed by measuring the intensities. In the KO collagen IV α4 peptide, the intensities were too low to detect when compared with WT, indicating an absence of 3Hyp on the proline residue. n = 6. Graphs show the mean ± SD. *P < 0.05, ** P < 0.01, and ***P < 0.001, by unpaired, 2-tailed Student’s t test.
Figure 8
Figure 8. Rescue of the ECM phenotype of P3H2-KO podocyte lines via AAV-CMV-P3H2 infection.
(A) P3H2 expression was determined via Western blotting. P3H2 protein expression was detected in AAV-CMV-P3H2–infected KO cells. (B) Immunofluorescence staining of KO and infected cells. P3H2 localization was observed in infected cells with a 60%–70% infection efficiency. Scale bars: 20 μm. (C) ECM proteomics for WT and KO cells. The x axis shows log2 fold changes in the abundance of WT and KO GBM proteins, and the y axis shows the P values of the GBM proteins. In the volcano plot, downregulation of collagen IV α1 and α2 subchains in the KO ECM was observed when compared with WT. (D) ECM proteomics of AAV-CMV-GFP–infected WT and AAV-CMV-P3H2–infected KO cells. Volcano plot shows that collagen IV α2 was no longer significantly downregulate and that α1 was still significantly downregulated in the ECM of infected KO cells. However, the difference in abundances of collagen IV α1 and α2 subchains were decreased with infection of AAV-CMV-P3H2, indicating that P3H2 reexpression increased the collagen IV α1 and α2 protein abundance and partially rescued the KO ECM phenotype. For C and D, the vertical dotted lines marks the –log(P value) cutoff of 1.3, above which all proteins were considered statistically significant; the dotted horizontal lines indicate the protein abundance difference [log2(KO) – log2(WT)] cutoff of less and –1 or greater than 1. Proteins with a –log(P value) of greater than 1.3 and a difference of 1 or less are highlighted in red.

Comment in

References

    1. Lovric S, et al. Genetic testing in steroid-resistant nephrotic syndrome: when and how? Nephrol Dial Transplant. 2016;31(11):1802–1813. doi: 10.1093/ndt/gfv355. - DOI - PMC - PubMed
    1. Deltas C, et al. Carriers of autosomal recessive alport syndrome with thin basement membrane nephropathy presenting as focal segmental glomerulosclerosis in later life. Nephron. 2015;130(4):271–280. doi: 10.1159/000435789. - DOI - PubMed
    1. Voskarides K, et al. COL4A3 founder mutations in Greek-Cypriot families with thin basement membrane nephropathy and focal segmental glomerulosclerosis dating from around 18th century. Genet Test. 2008;12(2):273–278. doi: 10.1089/gte.2007.0110. - DOI - PubMed
    1. Papazachariou L, et al. Frequent COL4 mutations in familial microhematuria accompanied by later-onset Alport nephropathy due to focal segmental glomerulosclerosis. Clin Genet. 2017;92(5):517–527. doi: 10.1111/cge.13077. - DOI - PubMed
    1. Dische FE, et al. Abnormally thin glomerular basement membranes associated with hematuria, proteinuria or renal failure in adults. Am J Nephrol. 1985;5(2):103–109. doi: 10.1159/000166914. - DOI - PubMed

Publication types

Substances

Supplementary concepts