

Quantitative Apparent Diffusion Coefficients From Peritumoral Regions as Early Predictors of Response to Neoadjuvant Systemic Therapy in Triple-Negative Breast Cancer
- PMID: 35499264
- PMCID: PMC9626398
- DOI: 10.1002/jmri.28219
Quantitative Apparent Diffusion Coefficients From Peritumoral Regions as Early Predictors of Response to Neoadjuvant Systemic Therapy in Triple-Negative Breast Cancer
Abstract
Background: Pathologic complete response (pCR) to neoadjuvant systemic therapy (NAST) in triple-negative breast cancer (TNBC) is a strong predictor of patient survival. Edema in the peritumoral region (PTR) has been reported to be a negative prognostic factor in TNBC.
Purpose: To determine whether quantitative apparent diffusion coefficient (ADC) features from PTRs on reduced field-of-view (rFOV) diffusion-weighted imaging (DWI) predict the response to NAST in TNBC.
Study type: Prospective.
Population/subjects: A total of 108 patients with biopsy-proven TNBC who underwent NAST and definitive surgery during 2015-2020.
Field strength/sequence: A 3.0 T/rFOV single-shot diffusion-weighted echo-planar imaging sequence (DWI).
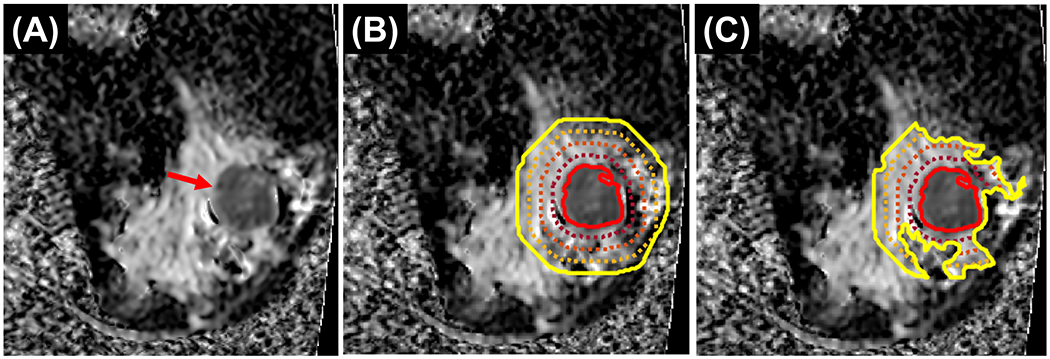
Assessment: Three scans were acquired longitudinally (pretreatment, after two cycles of NAST, and after four cycles of NAST). For each scan, 11 ADC histogram features (minimum, maximum, mean, median, standard deviation, kurtosis, skewness and 10th, 25th, 75th, and 90th percentiles) were extracted from tumors and from PTRs of 5 mm, 10 mm, 15 mm, and 20 mm in thickness with inclusion and exclusion of fat-dominant pixels.
Statistical tests: ADC features were tested for prediction of pCR, both individually using Mann-Whitney U test and area under the receiver operating characteristic curve (AUC), and in combination in multivariable models with k-fold cross-validation. A P value < 0.05 was considered statistically significant.
Results: Fifty-one patients (47%) had pCR. Maximum ADC from PTR, measured after two and four cycles of NAST, was significantly higher in pCR patients (2.8 ± 0.69 vs 3.5 ± 0.94 mm2 /sec). The top-performing feature for prediction of pCR was the maximum ADC from the 5-mm fat-inclusive PTR after cycle 4 of NAST (AUC: 0.74; 95% confidence interval: 0.64, 0.84). Multivariable models of ADC features performed similarly for fat-inclusive and fat-exclusive PTRs, with AUCs ranging from 0.68 to 0.72 for the cycle 2 and cycle 4 scans.
Data conclusion: Quantitative ADC features from PTRs may serve as early predictors of the response to NAST in TNBC.
Evidence level: 1 TECHNICAL EFFICACY: Stage 4.
Keywords: apparent diffusion coefficient; neoadjuvant therapy; peritumoral edema; prediction of treatment response; quantitative MRI; triple negative breast cancer.
© 2022 International Society for Magnetic Resonance in Medicine.
Figures

Comment in
-
Editorial for "Quantitative Apparent Diffusion Coefficients from Peritumoral Regions as Early Predictors of Response to Neoadjuvant Systemic Therapy in Triple-Negative Breast Cancer".J Magn Reson Imaging. 2022 Dec;56(6):1910-1911. doi: 10.1002/jmri.28217. Epub 2022 May 4. J Magn Reson Imaging. 2022. PMID: 35506513 No abstract available.
References
-
- Dent R, Trudeau M, Pritchard KI, et al. Triple-negative breast cancer: clinical features and patterns of recurrence. Clin Cancer Res 2007;13(15):4429–4434. - PubMed
-
- Oakman C, Viale G, Di Leo A. Management of triple negative breast cancer. Breast 2010;19(5):312–321. - PubMed
-
- Bauer KR, Brown M, Cress RD, Parise CA, Caggiano V. Descriptive analysis of estrogen receptor (ER)-negative, progesterone receptor (PR)-negative, and HER2-negative invasive breast cancer, the so-called triple-negative phenotype: a population-based study from the California Cancer Registry. Cancer 2007;109(9):1721–1728. - PubMed
-
- von Minckwitz G, Untch M, Blohmer JU, et al. Definition and impact of pathologic complete response on prognosis after neoadjuvant chemotherapy in various intrinsic breast cancer subtypes. J Clin Oncol 2012;30(15):1796–1804. - PubMed
Publication types
MeSH terms
Grants and funding
LinkOut - more resources
Full Text Sources
Medical
