

Protein degradation sets the fraction of active ribosomes at vanishing growth
- PMID: 35500024
- PMCID: PMC9098079
- DOI: 10.1371/journal.pcbi.1010059
Protein degradation sets the fraction of active ribosomes at vanishing growth
Abstract
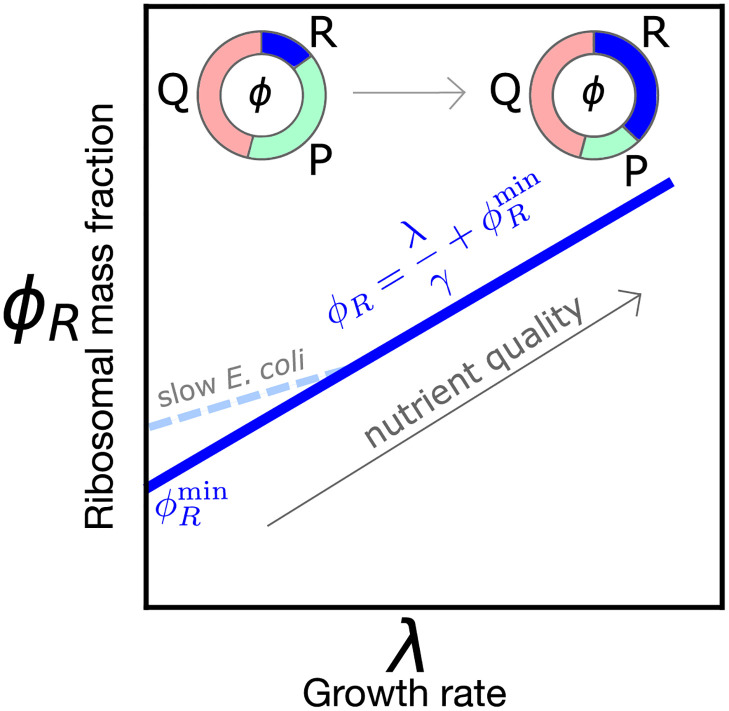
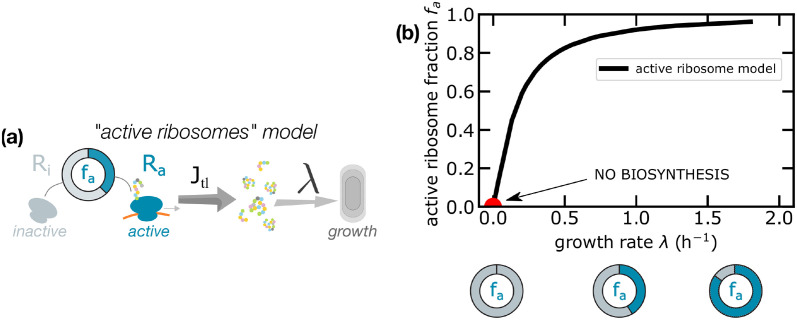
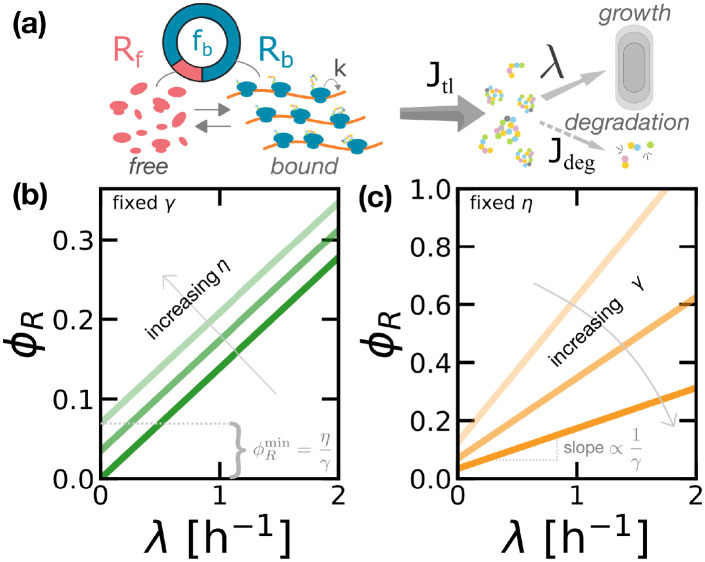
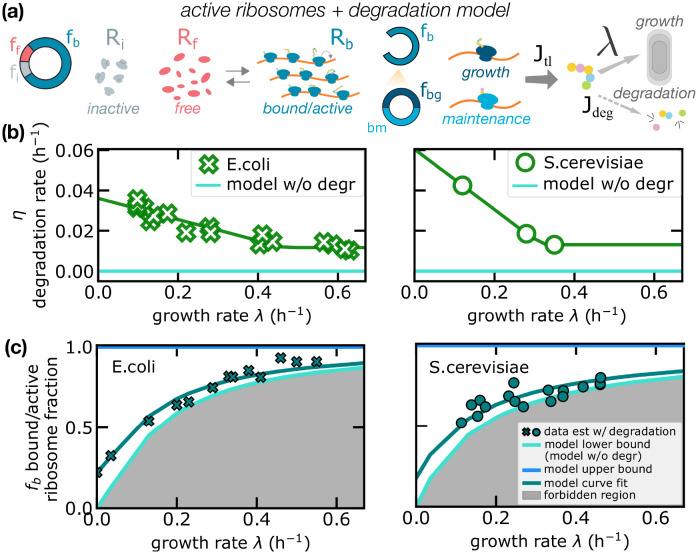
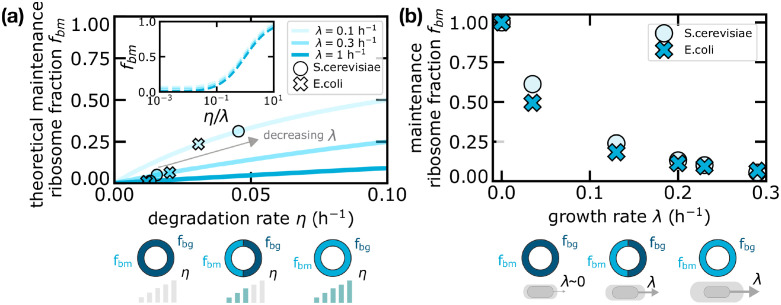
Growing cells adopt common basic strategies to achieve optimal resource allocation under limited resource availability. Our current understanding of such "growth laws" neglects degradation, assuming that it occurs slowly compared to the cell cycle duration. Here we argue that this assumption cannot hold at slow growth, leading to important consequences. We propose a simple framework showing that at slow growth protein degradation is balanced by a fraction of "maintenance" ribosomes. Consequently, active ribosomes do not drop to zero at vanishing growth, but as growth rate diminishes, an increasing fraction of active ribosomes performs maintenance. Through a detailed analysis of compiled data, we show that the predictions of this model agree with data from E. coli and S. cerevisiae. Intriguingly, we also find that protein degradation increases at slow growth, which we interpret as a consequence of active waste management and/or recycling. Our results highlight protein turnover as an underrated factor for our understanding of growth laws across kingdoms.
Conflict of interest statement
The authors have declared that no competing interests exist.
Figures
Similar articles
-
Reduction of translating ribosomes enables Escherichia coli to maintain elongation rates during slow growth.Nat Microbiol. 2016 Dec 12;2:16231. doi: 10.1038/nmicrobiol.2016.231. Nat Microbiol. 2016. PMID: 27941827 Free PMC article.
-
Environment-specificity and universality of the microbial growth law.Commun Biol. 2022 Aug 31;5(1):891. doi: 10.1038/s42003-022-03815-w. Commun Biol. 2022. PMID: 36045217 Free PMC article.
-
Escherichia coli translation strategies differ across carbon, nitrogen and phosphorus limitation conditions.Nat Microbiol. 2018 Aug;3(8):939-947. doi: 10.1038/s41564-018-0199-2. Epub 2018 Jul 23. Nat Microbiol. 2018. PMID: 30038306 Free PMC article.
-
When stable RNA becomes unstable: the degradation of ribosomes in bacteria and beyond.Biol Chem. 2013 Jul;394(7):845-55. doi: 10.1515/hsz-2013-0133. Biol Chem. 2013. PMID: 23612597 Review.
-
Novel ribosome-associated translation factors are required to maintain the fidelity of translation in yeast.Biochem Soc Trans. 1993 Nov;21(4):857-62. doi: 10.1042/bst0210857. Biochem Soc Trans. 1993. PMID: 8132081 Review. No abstract available.
Cited by
-
Self-reproduction and doubling time limits of different cellular subsystems.NPJ Syst Biol Appl. 2023 Sep 20;9(1):44. doi: 10.1038/s41540-023-00306-4. NPJ Syst Biol Appl. 2023. PMID: 37730753 Free PMC article.
-
How total mRNA influences cell growth.Proc Natl Acad Sci U S A. 2024 May 21;121(21):e2400679121. doi: 10.1073/pnas.2400679121. Epub 2024 May 16. Proc Natl Acad Sci U S A. 2024. PMID: 38753514 Free PMC article.
-
Super-exponential growth and stochastic size dynamics in rod-like bacteria.Biophys J. 2023 Apr 4;122(7):1254-1267. doi: 10.1016/j.bpj.2023.02.015. Epub 2023 Feb 22. Biophys J. 2023. PMID: 36814380 Free PMC article.
-
Optimal control of ribosome population for gene expression under periodic nutrient intake.J R Soc Interface. 2024 Mar;21(212):20230652. doi: 10.1098/rsif.2023.0652. Epub 2024 Mar 6. J R Soc Interface. 2024. PMID: 38442858 Free PMC article.
-
Out-of-equilibrium gene expression fluctuations in the presence of extrinsic noise.Phys Biol. 2023 Aug 10;20(5):10.1088/1478-3975/acea4e. doi: 10.1088/1478-3975/acea4e. Phys Biol. 2023. PMID: 37489881 Free PMC article.
References
Publication types
MeSH terms
LinkOut - more resources
Full Text Sources
Molecular Biology Databases
