. 2022 May 2;18(5):e1010187.
doi: 10.1371/journal.pgen.1010187. eCollection 2022 May.

The anterior Hox gene ceh-13 and elt-1/GATA activate the posterior Hox genes nob-1 and php-3 to specify posterior lineages in the C. elegans embryo

Affiliations

The anterior Hox gene ceh-13 and elt-1/GATA activate the posterior Hox genes nob-1 and php-3 to specify posterior lineages in the C. elegans embryo

John Isaac Murray et al. PLoS Genet. .

Abstract

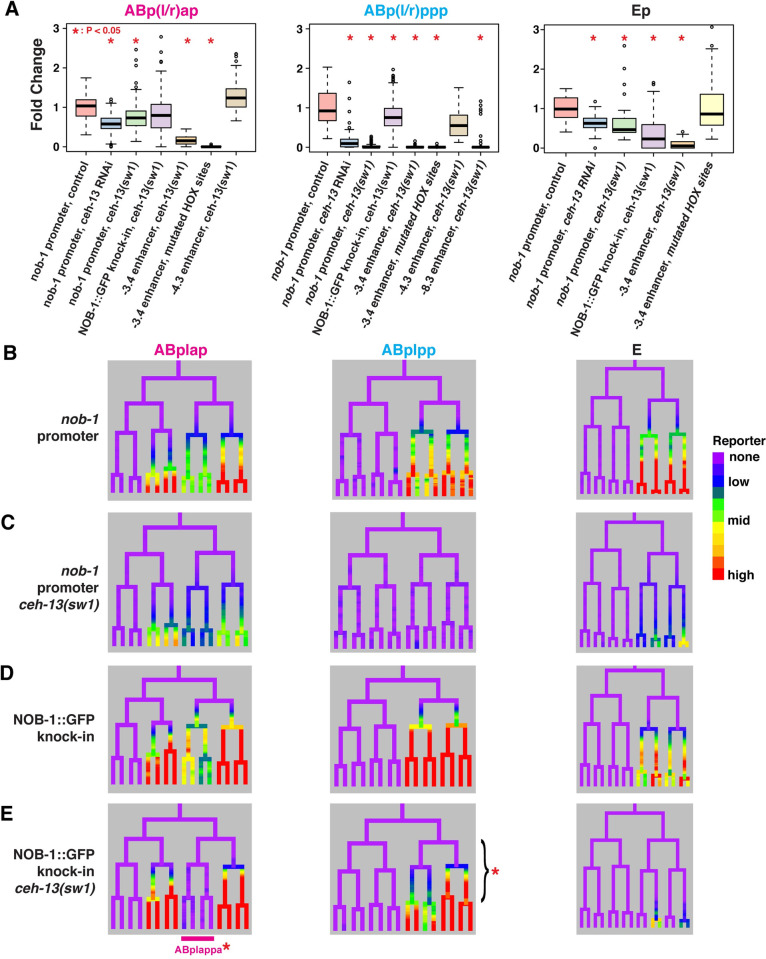
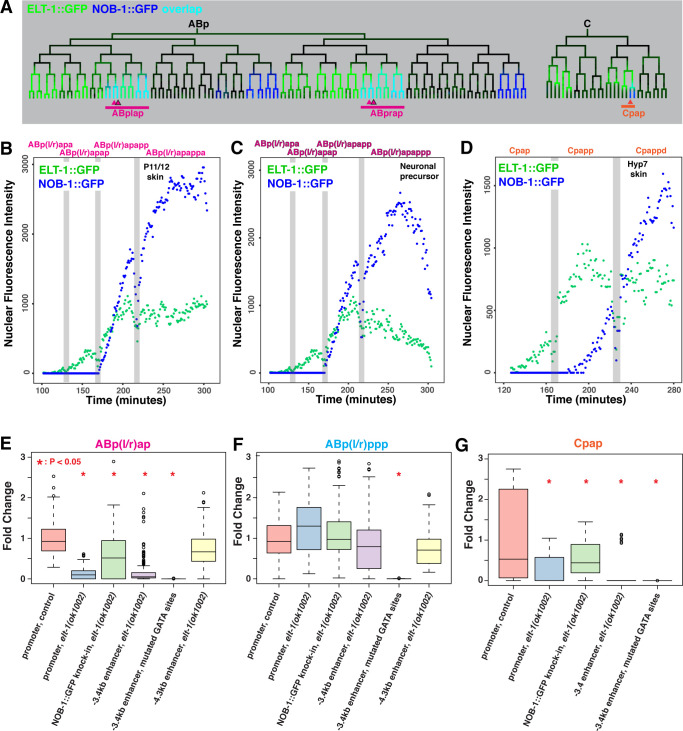
Hox transcription factors play a conserved role in specifying positional identity during animal development, with posterior Hox genes typically repressing the expression of more anterior Hox genes. Here, we dissect the regulation of the posterior Hox genes nob-1 and php-3 in the nematode C. elegans. We show that nob-1 and php-3 are co-expressed in gastrulation-stage embryos in cells that previously expressed the anterior Hox gene ceh-13. This expression is controlled by several partially redundant transcriptional enhancers. These enhancers act in a ceh-13-dependant manner, providing a striking example of an anterior Hox gene positively regulating a posterior Hox gene. Several other regulators also act positively through nob-1/php-3 enhancers, including elt-1/GATA, ceh-20/ceh-40/Pbx, unc-62/Meis, pop-1/TCF, ceh-36/Otx, and unc-30/Pitx. We identified defects in both cell position and cell division patterns in ceh-13 and nob-1;php-3 mutants, suggesting that these factors regulate lineage identity in addition to positional identity. Together, our results highlight the complexity and flexibility of Hox gene regulation and function and the ability of developmental transcription factors to regulate different targets in different stages of development.


Conflict of interest statement

The authors have declared that no competing interests exist.

Figures

Fig 1
Fig 1. ceh-13 and nob-1/php-3 are expressed broadly in an overlapping pattern in the early C. elegans embryo.
A) Time-lapse images of transgenic C. elegans embryos carrying two transgenes, a ubiquitous fluorescent histone to mark all nuclei (shown in green) and a reporter of interest (shown in red), which can be a cis-regulatory element driving a fluorescent histone (transcriptional) or a fluorescently tagged transcription factor protein (translational). Image analysis software identifies nuclei, and quantifies reporter intensity within the nuclei, which can be displayed as a lineage tree colored by expression as in (C). B) 3D projections of nuclei expressing endogenously tagged CEH-13::GFP (red) and endogenously tagged NOB-1::GFP and PHP-3::GFP (blue), with overlap shown in magenta, at 120 minutes (50 cell stage), 150 minutes (100 cell stage), and 280 minutes (400 cell stage) post fertilization. Endogenously tagged NOB-1::GFP and PHP-3::GFP were expressed in indistinguishable patterns (S1 Fig), but PHP-3::GFP was slightly brighter so is shown in the following panels. C) Lineage tree through the 100-cell stage, showing early expression of endogenously tagged CEH-13::GFP and PHP-3::GFP, colored as in (B). D) Expressing lineages showing endogenously tagged CEH-13::GFP and/or PHP-3::GFP expression to 350 minutes of development, colors as in (B). Note that CEH-13::GFP precedes PHP-3::GFP and NOB-1::GFP in all lineages except ABp(l/r)papppp (asterisk—expression is consistent in ABprpapppp and variable in ABplpapppp). (E-H) Quantitative detail for highlighted lineages, showing nuclear fluorescence intensity of CEH-13::GFP (fosmid) and NOB-1::GFP transgene reporters across developmental time for the cells leading to ABp(l/r)appaaa (E), ABp(l/r)appppp (F), ABp(l/r)ppppppp (G), and Ep(l/r)p (H). For cell labels, x = (l/r). Nuclear fluorescence intensity is in arbitrary units. Grey bars mark cell divisions.
Fig 2
Fig 2. Regions upstream of nob-1/php-3 can recapitulate its expression pattern.
A) Genome browser view of the nob-1/php-3 locus showing the genes (black), candidate enhancers tested (brown), sequence conservation with other nematodes (grey), and NHR-2 ChIP-seq trace (dark blue) from modENCODE [43] and ATAC-seq traces (red:ABa lineage, green: ABp lineage) from Charest et al, 2020 [66]. B) Schematics of the nob-1 reporter constructs examined, shown in alignment with (A). Enhancers were primarily tested in an orientation 5’ to the pes-10 minimal promoter, but a downstream orientation was also used for the -4.3 kb enhancer. C) Lineage trees colored to show expression patterns for the various reporters and tested enhancers with relevant reproducible activity, using a rainbow color scale to increase visible dynamic range. Major expressing lineages are underlined: ABp(l/r)ap: pink, ABp(l/r)ppp: cyan, Ep: black, Cpapp: orange, ectopic: purple. Note the changes in expression driven by the -4.3 kb enhancer depending on its position relative to the pes-10 minimal promoter. D) Average nuclear fluorescence values for cells in the ABp(l/r)ap (pink) and ABp(l/r)ppp (blue) lineages from at least four embryos, shown on a log scale (arbitrary units). E) Ratio of expression in average ABp(l/r)ap cell to the average ABp(l/r)ppp cell at the 350 cell stage for at least 4 embryos (n = 4–7). F) Lineage trees showing expression driven by the nob-1–5.3 kb upstream region reporter with the -3.4 kb and/or -4.3 kb enhancers are deleted. Lineages where expression is lost are underlined with colors as in (C).
Fig 3
Fig 3. Expression of cis-regulatory elements upstream of nob-1 and php-3 depends on ceh-13.
A) Fold change in expression level relative to mean wild-type control for nob-1 promoter, endogenously tagged NOB-1::GFP knock-in allele, and enhancer reporters in ceh-13 mutant and RNAi conditions. Number of biological replicates for each condition ranges from 3–16, however, since there are, for example, 36 nob-1 cells in the ABp(l/r)ap lineages, the number of points represented by the box plots is much greater. P values determined by Wilcoxon Ranked Sum Test, p<0.05 significant. B) Lineage view of wild-type nob-1–5.3kb upstream reporter (“promoter”) expression in specified lineages. C) -5.3kb nob-1 promoter reporter expression in ceh-13(sw1) null mutant. D) Lineage view of wild-type endogenously tagged NOB-1::GFP expression in specified lineages. E) Expression of endogenously tagged NOB-1::GFP in ceh-13(sw1) null mutant. Underlined lineages and bracketed early cells had specifically significantly lower NOB-1::GFP levels.
Fig 4
Fig 4. Hox co-factors precede nob-1 and regulate its expression.
A) Trees of NOB-1::GFP expressing lineages, ABp, E, and C, showing the expression of ceh-13 (fosmid) and nob-1 (GFP transgene) reporters, and fosmid GFP transgene reporters for the Hox co-factor genes, ceh-20, ceh-40 and unc-62. Color thresholds were adjusted for each reporter to show all expressing cells. Highlighted branches are shown in graphs B, C, and D. B-D) Average TF reporter nuclear fluorescence intensity across embryos (n ≥ 2) and for left/right symmetric cells across developmental time for the cells leading to B) ABp(l/r)appaa, C) ABp(l/r)pppaa and D) Cpapp. Fluorescence intensity is in arbitrary units and grey bars mark cell divisions. E,F) Fold change values for -5.3 kb nob-1 promoter expression in untreated (n = 5) and unc-62 RNAi treated (n = 7) (E) or ceh-40(gk159) mutant embryos treated with ges-1 (control, n = 5) or ceh-20 RNAi (n = 5) (F) in specified lineages. Significant changes (p<0.05) marked by asterisk; P values determined by Wilcoxon Ranked Sum Test.
Fig 5
Fig 5. elt-1 regulates nob-1 expression in ABp(l/r)ap lineage.
A) Partial lineage trees showing transgene expression patterns of ELT-1::GFP (green), NOB-1::GFP (blue) or overlapping (Cyan) expression in the ABp and C lineages. Arrowheads indicate branches shown in subsequent panels. B-D) Average transgenic ELT-1::GFP and NOB-1::GFP nuclear fluorescence intensity (arbitrary units) in cells leading to B) ABp(l/r)apappa (P11/12 blast, part of the ventral hypodermis in the embryo) C), ABp(l/r)apappp (neuroblast fate), and D) Cpappd (hypodermal fate). Grey bars mark cell divisions. E-G) Fold change values for the nob-1 promoter, endogenously tagged NOB-1::GFP, and -3.4 kb and -4.3 kb wild-type or mutated enhancer reporters in the ABp(l/r)ap lineage in the control and elt-1(ok1002) mutant conditions in the E) ABp(l/r)ap, F) ABp(l/r)ppp, and G) Cpap lineages. Number of biological replicates ranges from 4–6. Significant changes (p<0.05) marked by red asterisk; P values determined by Wilcoxon Ranked Sum Test.
Fig 6
Fig 6. Cell defects are observed in the posterior of both ceh-13 and nob-1 mutant embryos.
A) Lineage showing CEH-13::GFP expression with plots of frequency of cell cycle defects and cell position defects for each cell plotted below. Cells expressing CEH-13::GFP during their development are highlighted in pink (ABalap and ABalpp, which express very low levels of CEH-13::GFP, are denoted with lighter shading). Cell cycle defects are defined as missed, ectopic or significant change in division timing of at least 5 minutes and cell position defects are defined as significant deviation of at least 5 μm from the positions expected from wild-type (see methods). Defects are listed cumulatively for terminal cells, so defects in both a parent and daughter cell would be scored as two defects. B) Lineage showing NOB-1::GFP and PHP-3::GFP expression overlap with plots of frequency of cell cycle defects and cell position defects for each cell plotted below. Cells expressing both NOB-1::GFP and PHP-3::GFP are highlighted in cyan on the plots. C, D) Plot of mean deviation in microns vs. mean neighbor score for each cell in the embryo, colored by level of NOB-1::GFP expression, for nob-1(ct223) mutant which disrupts both nob-1 and php-3 (C) and wild-type (D) embryos. Neighbor score is a measure of whether a cell is close to its normal neighbors; values above 0.8 indicate aberrant neighbor relationships. E, F) Plot of mean deviation in microns vs. mean neighbor score for each cell in the embryo, colored by level of CEH-13::GFP expression, for ceh-13(sw1) mutant (E) and wild-type (F) embryos. (G-I) Three-dimensional plot of cell position deviations—arrows point from average wild-type location to average mutant location for each cell, colors indicate the level of NOB-1::GFP (G) or CEH-13::GFP(H-I) expression: G) nob-1(ct223) at 335 minutes of development. H) ceh-13(sw1) at 230 minutes of development) ceh-13(sw1) at 322 minutes of development. J) Wild-type and nob-1(ct223) mutant lineages for the ABp(l/r)ap and ABp(l/r)pp lineages, showing examples of cell division defects. Green stars indicate the normal divisions of neuroblasts, orange Xs indicate the failed divisions of these cells with the frequency observed noted below. Blue underline indicates the expression of NOB-1::GFP. K) Wild-type and ceh-13(sw1) mutant lineages for the ABarp lineage. Green stars indicate the normal development of ADEshL and H2L cells, orange Xs indicate the ectopic division of these cells with the frequency observed noted below. Red underline indicates the expression of CEH-13::GFP.

Similar articles

Cited by

References

    1. Duboule D, Morata G. Colinearity and functional hierarchy among genes of the homeotic complexes. Trends Genet TIG. 1994. Oct;10(10):358–64. - PubMed
    1. Noordermeer D, Duboule D. Chromatin architectures and Hox gene collinearity. Curr Top Dev Biol. 2013;104:113–48. - PubMed
    1. Gaunt SJ. Hox cluster genes and collinearities throughout the tree of animal life. Int J Dev Biol. 2018;62(11–12):673–83. - PubMed
    1. Bürglin TR, Ruvkun G, Coulson A, Hawkins NC, McGhee JD, Schaller D, et al.. Nematode homeobox cluster. Nature. 1991. Jun 27;351(6329):703. - PubMed
    1. Van Auken K, Weaver DC, Edgar LG, Wood WB. Caenorhabditis elegans embryonic axial patterning requires two recently discovered posterior-group Hox genes. Proc Natl Acad Sci U S A. 2000. Apr 25;97(9):4499–503. - PMC - PubMed

Publication types

MeSH terms

Substances