

doi: 10.2105/AJPH.2022.306769.
Epub 2022 May 2.
District-Level Universal Masking Policies and COVID-19 Incidence During the First 8 Weeks of School in Texas
Affiliations
- PMID: 35500198
- PMCID: PMC9137026
- DOI: 10.2105/AJPH.2022.306769
Item in Clipboard
District-Level Universal Masking Policies and COVID-19 Incidence During the First 8 Weeks of School in Texas
Am J Public Health.
2022 Jun.
Abstract
Texas discontinued state-sponsored business restrictions and mask mandates on March 10, 2021, and mandated that no government officials, including public school officials, may implement mask requirements even in areas where COVID-19 hospitalizations comprised more than 15% of hospitalizations. Nonetheless, some public school districts began the 2021-2022 school year with mask mandates in place. We used quasi-experimental methods to analyze the impact of school mask mandates, which appear to have resulted in approximately 40 fewer student cases per week in the first eight weeks of school. (Am J Public Health. 2022;112(6):871-875. https://doi.org/10.2105/AJPH.2022.306769).
Figures
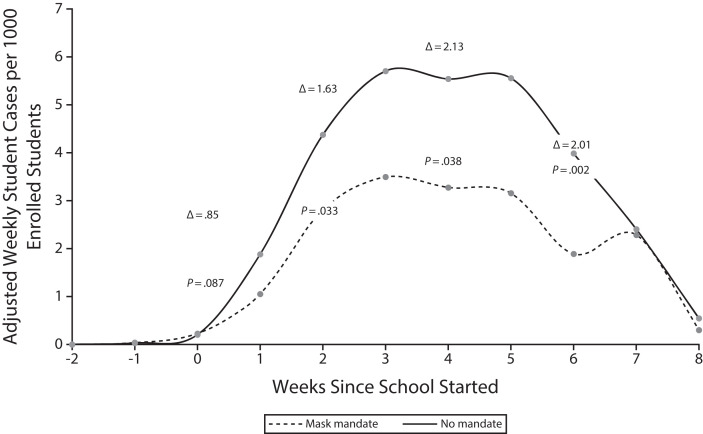
Average Number of Student COVID-19 Cases Reported to School Districts, by Mask Requirement: Texas, August 1–October 2, 2021 Note. Deltas (differences) represent weeks (with asterisks) where the case counts between districts with and without mask mandates were statistically significant at P < .05 (difference and P value shown on graph). Predicted mean cases per 1000 enrolled students were derived postestimation from a two-part model (logit in the first stage to predict nonzero cases, and then generalized linear model with log link), adjusting for the weekly case and vaccination rates in the district’s area, the vaccination rate in the week prior to school start, and per-student annual spending. Standard errors were clustered at the district level.
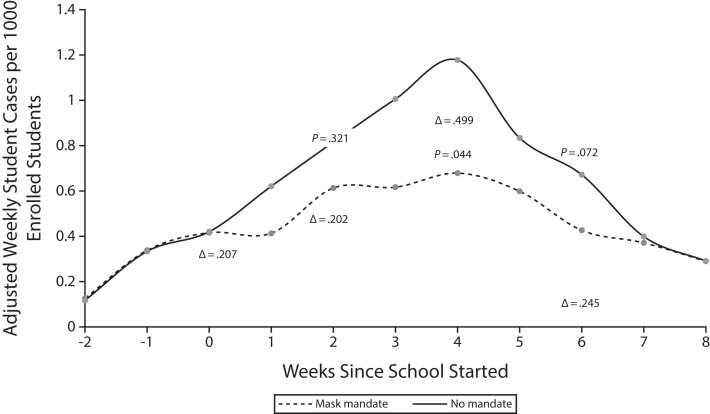
Average Number of Staff COVID-19 Cases Reported to School Districts, by Mask Requirement: Texas, August 1–October 2, 2021 Note. Deltas (differences) represent weeks (with asterisks) where the case counts between districts with and without mask mandates were statistically significant at P < .05 (difference and P value shown on graph). Predicted mean cases per 1000 enrolled students were derived postestimation from a two-part model (logit in the first stage to predict nonzero cases, and then generalized linear model with log link), adjusting for the weekly case and vaccination rates in the district’s area, the vaccination rate in the week prior to school start, and per-student annual spending. Standard errors were clustered at the district level.
References
-
- Centers for Disease Control and Prevention. 2021. https://www.cdc.gov/coronavirus/2019-ncov/community/schools-childcare/k-...
-
- Texas Center for Health Statistics. Texas public schools COVID-19 data. 2021. https://dshs.texas.gov/coronavirus/schools/ texas-education-agency
-
- Belotti F, Deb P, Manning WG, Norton EC. Twopm: two-part models. Stata J. 2015;15(1):3–20. doi: 10.1177/1536867X1501500102. - DOI
-
- Centers for Disease Control and Prevention. 2022. https://covid.cdc.gov/covid-data-tracker/#datatracker-home
Publication types
MeSH terms
LinkOut - more resources
Full Text Sources
Medical
