. 2022 Aug;48(5):e12818.
doi: 10.1111/nan.12818. Epub 2022 May 15.

Pathogenic variants of Valosin-containing protein induce lysosomal damage and transcriptional activation of autophagy regulators in neuronal cells

Affiliations

Pathogenic variants of Valosin-containing protein induce lysosomal damage and transcriptional activation of autophagy regulators in neuronal cells

Veronica Ferrari et al. Neuropathol Appl Neurobiol. 2022 Aug.

Abstract

Aim: Mutations in the valosin-containing protein (VCP) gene cause various lethal proteinopathies that mainly include inclusion body myopathy with Paget's disease of bone and frontotemporal dementia (IBMPFD) and amyotrophic lateral sclerosis (ALS). Different pathological mechanisms have been proposed. Here, we define the impact of VCP mutants on lysosomes and how cellular homeostasis is restored by inducing autophagy in the presence of lysosomal damage.

Methods: By electron microscopy, we studied lysosomal morphology in VCP animal and motoneuronal models. With the use of western blotting, real-time quantitative polymerase chain reaction (RT-qPCR), immunofluorescence and filter trap assay, we evaluated the effect of selected VCP mutants in neuronal cells on lysosome size and activity, lysosomal membrane permeabilization and their impact on autophagy.

Results: We found that VCP mutants induce the formation of aberrant multilamellar organelles in VCP animal and cell models similar to those found in patients with VCP mutations or with lysosomal storage disorders. In neuronal cells, we found altered lysosomal activity characterised by membrane permeabilization with galectin-3 redistribution and activation of PPP3CB. This selectively activated the autophagy/lysosomal transcriptional regulator TFE3, but not TFEB, and enhanced both SQSTM1/p62 and lipidated MAP1LC3B levels inducing autophagy. Moreover, we found that wild type VCP, but not the mutants, counteracted lysosomal damage induced either by trehalose or by a mutant form of SOD1 (G93A), also blocking the formation of its insoluble intracellular aggregates. Thus, chronic activation of autophagy might fuel the formation of multilamellar bodies.

Conclusion: Together, our findings provide insights into the pathogenesis of VCP-related diseases, by proposing a novel mechanism of multilamellar body formation induced by VCP mutants that involves lysosomal damage and induction of lysophagy.

Keywords: ALS; PQC; TFE3; lysosome; neurodegeneration; p97.


Conflict of interest statement

CONFLICT OF INTEREST

All authors declare no conflict of interest.

Figures
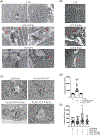
FIGURE 1
FIGURE 1
Abnormal lysosomal structures in tissues and cells expressing mutant valosin-containing proteins (VCPs). (A) Electron microscopy (EM) analysis of lysosomes in thoracic muscle of Drosophila melanogaster expressing either wild type (WT) (CTR) or R152H mutation. Scale bar, 600 nm. Red arrows evidence multilamellar bodies (MLBs). (B) EM analysis of lysosomes in quadriceps muscles of control (CTR) and transgenic R155H VCP mice. Scale bar, 1 or 2 μm. Red arrows evidence MLBs. (C) EM analysis of lysosomes in NSC-34 expressing WT or mutants FLAG-VCPs. Scale bar, 200 nm. (D) The bar graph represents lysosomal diameters measured on EM analysis of D. melanogaster expressing either WT (CTR) or R152H mutation; 32–42 lysosomes were analysed for each condition (Kruskal–Wallis test followed by Dunns multiple comparison test; ****p < 0.0001). (E) The bar graph represents lysosomal diameters measured on EM analysis of NSC-34 expressing WT or mutants FLAG-VCPs; 33–42 lysosomes were analysed for each condition (Kruskal–Wallis test followed by Dunns multiple comparison test; **p < 0.01)
FIGURE 2
FIGURE 2
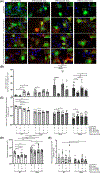
Valosin-containing protein (VCP) mutants aggregate and induce lysosomal damage in NSC-34. (A) Immunofluorescence (IF) microscopy analysis (63× magnification) on NSC-34 cells overexpressing wild type (WT) or mutants FLAG-VCPs. Nuclei were stained with 4′,6-diamidino-2-phenylindole (DAPI) (blue), whereas FLAG-VCP with the anti-FLAG antibody (red). Scale bar, 10 μm. (B) A representative western blotting (WB) analysis of phosphate-buffered saline (PBS) extracts of NSC-34 overexpressing WT or mutants FLAG-VCPs. To visualise total VCP, an anti-VCP antibody was used. To visualise exogenous FLAG-VCP, an anti-FLAG antibody was used. Glyceraldehyde-3-phosphate dehydrogenase (GAPDH) was used as loading control (upper inset). Optical densitometry quantification of VCP (middle inset) and FLAG-VCP (lower inset) in WB was computed over three independent biological samples for each condition (n = 3) SD (one-way analysis of variance [ANOVA] followed by Fisher’s least significant difference [LSD] test). (C,D) Filter trap assay (FTA) (upper inset) of PBS extracts of NSC-34 overexpressing WT or mutants FLAG-VCPs. To visualise total VCP, an anti-VCP antibody was used (C). To visualise exogenous FLAG-VCP, an anti-FLAG antibody was used (D). Bar graph represents FTA mean relative optical density computed over three independent biological samples for each condition (n = 3) SD (one-way ANOVA followed by Fisher’s LSD test; *p < 0.05, **p < 0.01, ***p < 0.001). (E) IF microscopy analysis (63× magnification) on NSC-34 cells overexpressing WT or mutants 6xHIS-VCPs and GFP-LAMP1. 6xHIS-VCPs were stained with an anti-6xHIS antibody (red), LAMP1 was visualised as GFP-LAMP1 (green) and nuclei were stained with DAPI (blue). A 2.5× magnification of selected areas is shown. Scale bar, 10 μm. (F) Stimulated emission depletion (STED) microscopy analysis on NSC-34 cells overexpressing WT or mutants 6xHIS-VCPs and GFP-LAMP1. 6xHIS-VCPs were stained with an anti-6xHIS antibody (red), and LAMP1 was visualised as GFP-LAMP1 (green). Scale bar, 5 μm. (G) Cytofluorimetric analysis performed on NSC-34 cells overexpressing WT or mutants FLAG-VCPs treated with Lysosome-Specific Self-Quenched Substrate. Mean fluorescence intensity was measured (n = 6) (one-way ANOVA followed by Fishers LSD test; ***p < 0.001). (H) IF microscopy analysis (40× magnification) on NSC-34 cells overexpressing WT or mutants FLAG-VCPs and GFP-LGALS3. FLAG-VCPs were stained with an anti-FLAG antibody (red), galectin-3 was visualised as GFP-LGALS3 (green) and nuclei were stained with DAPI (blue). A 2× magnification of selected areas is shown. Scale bar, 10 μm. (I) STED microscopy analysis on NSC-34 cells overexpressing WT or mutants 6xHIS-VCPs and GFP-LGALS3. 6xHIS tagged VCPs were detected using an anti-6xHIS antibody red and galectin-3 as GFP-LGALS3 (green). Scale bar, 5 μm. (J) The bar graph represents the quantification of the percentage of cells with >3 GFP-LGALS3 puncta after transfection with pCDNA3, WT or mutants FLAG-VCPs; the fields were randomly selected, and at least 100 cells for each sample were counted over 5 independent biological samples for each condition (n = 5) SD (one-way ANOVA followed by Fisher’s LSD test; *p < 0.05, ***p < 0.001)
FIGURE 3
FIGURE 3
Wild type (WT) valosin-containing protein (VCP) modulation decrease levels of chemically damaged lysosomes. (A) Immunofluorescence (IF) microscopy analysis (40× magnification) on NSC-34 cells overexpressing WT or mutants FLAG-VCPs and GFP-LGALS3 and treated with trehalose for different time points. FLAG-VCPs were stained with anti-FLAG antibody (red), galectin-3 was visualised as GFP-LGALS3 (green) and nuclei were stained with 4′,6-diamidino-2-phenylindole (DAPI) (blue). A 2× magnification of selected areas is shown. Scale bar, 10 μm. (B) The bar graph represents the quantification of percentage of cells with >3 GFP-LGALS3 puncta after transfection with pCDNA3, WT or mutants FLAG-VCPs and after trehalose treatment at different time points; the fields were randomly selected, and at least 100 cells for each sample were counted over 9 independent biological samples for each condition (n = 9) SD (two-way analysis of variance [ANOVA] with Fisher’s least significant difference [LSD] test; *p < 0.05, **p < 0.01, ****p < 0.0001; +p < 0.05, ++p < 0.01, +++p < 0.001, ++++p < 0.0001, vs NT; °p < 0.05, °°°p < 0.001, °°°°p < 0.0001, vs 2-h trehalose; ^^p < 0.01, ^^^p < 0.001, vs 6h trehalose). (C) The bar graph represents the quantification of the mean LysoTracker fluorescence intensity cytofluorimetric analysis performed on NSC-34 cells overexpressing WT or mutants FLAG-VCPs, treated with trehalose for different time periods and labelled with LysoTracker Green. Mean fluorescence intensity was measured (n = 4) (two-way ANOVA with Fisher’s LSD test; *p < 0.05, **p < 0.01; ++p < 0.01, ++++p < 0.0001, vs NT; °p < 0.05, °°°°p < 0.0001, vs 2-h trehalose; ^p < 0.05, ^^^p < 0.001, vs 6-h trehalose). (D) The bar graph represents the quantification of lysosomes volume of NSC-34 after transfection with pCDNA3, WT or mutants FLAG-VCPs and after 6-h trehalose treatment. The fields were randomly selected, and at least 50 cells for each sample were counted over 11 independent biological samples for each condition (n = 11) SD (two-way ANOVA with Fisher’s LSD test; *p < 0.05, **p < 0.01, ***p < 0.001, ****p < 0.0001). (E) The bar graph represents the number of lysosomes of NSC-34 after transfection with pCDNA3, WT or mutants FLAG-VCPs and after 6-h trehalose treatment. The fields were randomly selected, and at least 50 cells for each sample were counted over 11 independent biological samples for each condition (n = 11) SD (two-way ANOVA with Fisher’s LSD test; *p < 0.05, **p < 0.01)
FIGURE 4
FIGURE 4
Wild type (WT) valosin-containing protein (VCP) modulation decreases levels of lysosomal damage induced by SOD1 mutant. (A) Immunofluorescence (IF) microscopy analysis (63× magnification) on NSC-34 cells overexpressing WT SOD1 or G93A SOD1 and GFP-LGALS3. SOD1 was stained with an anti-SOD1 antibody (red), galectin-3 was visualised as GFP-LGALS3 (green) and nuclei were stained with 4′,6-diamidino-2-phenylindole (DAPI) (blue). A 2× magnification of selected areas is shown. Scale bar, 10 μm. (B) The bar graph represents the quantification of percentage of cells with >3 GFP-LGALS3 puncta after transfection with pCDNA3, WT SOD1 or G93A SOD1; the fields were randomly selected and at least 100 cells for each sample were counted over 5 independent biological samples for each condition (n = 5) ±SD (Unpaired t test with Welch’s correction; **p < 0.001) (C) The bar graph represents the quantification of percentage of cells with >3 GFP-LGALS3 puncta after transfection with pCDNA3, WT or mutants FLAG-VCPs and WT SOD1 or G93A SOD1; the fields were randomly selected, and at least 100 cells for each sample were counted over 9 independent biological samples for each condition (n = 9) ± SD (one-way analysis of variance [ANOVA] followed by Fisher’s least significant difference [LSD] test; *p < 0.05, ***p < 0.001). (D) The bar graph represents the quantification of the mean LysoTracker fluorescence intensity cytofluorimetric analysis performed on NSC-34 transfected with pCDNA3, WT or mutants FLAG-VCPs and WT SOD1 or G93A SOD1 and labelled with LysoTracker Green. Mean fluorescence intensity was measured (n = 4) (One-way ANOVA with Fisher’s LSD test; *p < 0.05, **p < 0.01, ***p < 0.001). (E) The bar graph represents the quantification of lysosome volume of NSC-34 transfected with pCDNA3, WT or mutants FLAG-VCPs and WT SOD1 or G93A SOD1. The fields were randomly selected, and at least 50 cells for each sample were counted over 11 independent biological samples for each condition (n = 11) ±SD (one-way ANOVA with Fisher’s LSD test; **p < 0.01) (F) The bar graph represents the number of lysosomes of NSC-34 after transfection pCDNA3, WT or mutants FLAG-VCPs and WT SOD1 or G93A SOD1. The fields were randomly selected, and at least 50 cells for each sample were counted over 11 independent biological samples for each condition (n = 11) ±SD (one-way ANOVA with Fisher’s LSD test)
FIGURE 5
FIGURE 5
Valosin-containing protein (VCP) mutants activate autophagy. (A) A representative western blotting (WB) of phosphate-buffered saline (PBS) extracts of NSC-34 overexpressing wild type (WT) or mutants FLAG-VCPs and treated with NH4Cl. To visualise FLAG-VCP, an anti-FLAG antibody was used. To visualise the autophagic markers MAP 1LC3B and SQSTM1/p62, an anti-MAP 1LC3B antibody and an anti-SQSTM1/p62 antibody were used respectively. Glyceraldehyde-3-phosphate dehydrogenase (GAPDH) was used as loading control. (B–E) Quantification of WB analysis presented in Figure A. (B) The bar graph represents the mean relative optical density quantification of SQSTM1/ p62 detected by WB using an anti-SQSTM1/p62 antibody. (C) The bar graph represents the mean relative optical density quantification of MAP 1LC3B-I detected by WB (upper lane considered) using an anti-MAP1LC3B antibody. (D) The bar graph represents the mean relative optical density quantification of MAP1LC3B-II detected by WB (lower lane considered) using an anti-MAP1LC3B antibody. (E) The bar graph represents the ratio of the mean relative optical density quantification of MAP1LC3B-II detected by WB (lower lane considered) and of the mean relative optical density quantification of MAP1LC3B-I detected by WB (upper lane) using an anti-MAP1LC3B antibody. All quantification histograms were calculated using the mean SD for n = 5 independent replicates. (Two-way analysis of variance [ANOVA] with Fisher’s least significant difference [LSD] test; *p < 0.05, **p < 0.01, ***p < 0.001, ****p < 0.0001). (F) A representative WB of PBS extracts of NSC-34 overexpressing WT or mutants FLAG-VCPs and treated with CQ. (G–L) Quantification of WB analysis presented in Figure F. (G) The bar graph represents the mean relative optical density quantification of SQSTM1/p62 detected by WB using an anti-SQSTM1/p62 antibody. (H) The bar graph represents the mean relative optical density quantification of MAP1LC3B-I detected by WB (upper lane considered) using an anti-MAP1LC3B antibody. (I) The bar graph represents the mean relative optical density quantification of MAP1LC3B-II detected by WB (lower lane considered) using an anti-MAP 1LC3B antibody. (L) The bar graph represents the ratio of the mean relative optical density quantification of MAP1LC3B-II detected by WB (lower lane considered) and of the mean relative optical density quantification of MAP1LC3B-I detected by WB (upper lane) using an anti-MAP1LC3B antibody. All quantification histograms were calculated using the mean SD for n = 5 independent replicates. (Two-way ANOVA with Fisher’s LSD test; *p < 0.05, **p < 0.01, ***p < 0.001, ****p < 0.0001). (M) Immunofluorescence (IF) microscopy analysis (63× magnification) of NSC-34 overexpressing WT or mutants FLAG-VCPs (upper inset). FLAG-VCP was stained with an anti-FLAG antibody (red), SQSTM1/p62 was stained with an anti-SQSTM1/p62 antibody (green) and nuclei were stained with DAPI (blue). An 8× magnification of selected areas is shown. Scale bar, 10 μm. The bar graph (lower inset) represents quantification of SQSTM1/p62 puncta average size per cell; 40 cells were analysed for each condition (two-way ANOVA with Dunnetts test and Šidáks test *p < 0.05, **p < 0.01, ***p < 0.001, ****p < 0.0001). (N) IF microscopy analysis (63× magnification) of NSC-34 overexpressing WT or mutants FLAG-VCPs (upper inset). FLAG-VCP was stained with an anti-FLAG antibody (red), MAP 1LC3B was stained with an anti-MAP1LC3B antibody (green) and nuclei were stained with DAPI (blue). An 8× magnification of selected areas is shown. Scale bar, 10 μm. The bar graph (lower inset) represents quantification of MAP1LC3B puncta average size per cell; 40 cells were analysed for each condition (two-way ANOVA with Dunnett’s test and Šidák’s test; **p < 0.01, ****p < 0.0001). (O) Real-time quantitative polymerase chain reaction (RT-qPCR) for SQSTM1/p62, MAP1LC3B, HSPB8, BAG3, ATG-10, ATG-12, BECN1 and LAMP1 mRNA normalised with Rplp0 mRNA levels. Data are means ± SD of 4 independent samples (one-way ANOVA with Fisher’s LSD test; *p < 0.05, **p < 0.01, ***p < 0.001 vs pCDNA3; °p < 0.05, °°°p < 0.001 vs WT VCP)
FIGURE 6
FIGURE 6
Valosin-containing protein (VCP) mutants specifically increase TFE3 nuclear levels. (A) A representative western blotting (WB) analysis of cytoplasmic (C) and nuclear (N) extracts of NSC-34 overexpressing wild type (WT) or mutants FLAG-VCPs. To visualise FLAG-VCP, an anti-FLAG antibody was used. To visualise transcription factors transcription factor EB (TFEB) and TFE3, an anti-TFEB antibody and an anti-TFE3 antibody were used, respectively. α-Tubulin (TUBA) was used as loading control of the cytoplasmic fraction. Histone 3 (H3) was used as loading control of the nuclear fraction. (B–G) Quantification of WB analysis presented in Figure A. (B) The bar graph represents the mean relative optical density quantification of cytoplasmic fraction of TFEB detected by WB using an anti-TFEB antibody. (C) The bar graph represents mean relative optical density quantification of nuclear TFEB detected by WB using an anti-TFEB antibody. (D) The bar graph represents the ratio of the mean relative optical density quantification of nuclear TFEB and the mean relative optical density quantification of cytoplasmic TFEB detected by WB using an anti-TFEB antibody. (E) The bar graph represents mean relative optical density quantification of cytoplasmic fraction of TFE3 detected by WB using an anti-TFE3 antibody. (F) The bar graph represents mean relative optical density quantification of nuclear TFE3 detected by WB using an anti-TFE3 antibody. (G) The bar graph represents the ratio of the mean relative optical density quantification of nuclear TFE3 and of the mean relative optical density quantification of cytoplasmic TFE3 detected by WB using an anti-TFE3 antibody. All quantification histograms were calculated using the mean ± SD for 5 independent samples (one-way analysis of variance [ANOVA] followed by Fisher’s least significant difference [LSD] test and the unpaired t test with Welch’s correction; *p < 0.05, **p < 0.01). (H) Upper inset shows fluorescence microscopy analysis (63× magnification) of NSC-34 overexpressing WT or mutants FLAG-VCPs and GFP-TFEB. TFEB was visualised as GFP-TFEB (green), and nuclei were stained with DAPI (blue). Scale bar, 10 μm. The bar graph (lower inset) represents the quantification of TFEB nuclear intensity; the fields were randomly selected, and at least 100 cells were analysed for each condition (one-way ANOVA with Fishers LSD test). (I) Upper inset shows fluorescence microscopy analysis (63× magnification) of NSC-34 overexpressing WT or mutants FLAG-VCPs and GFP-TFE3. TFE3 was visualised as GFP-TFE3 (green) and nuclei were stained with DAPI (blue). Scale bar, 10 μm. The bar graph (lower inset) represents the quantification of TFE3 nuclear intensity; the fields were randomly selected, and at least 100 cells were analysed for each condition (one-way ANOVA with Fisher’s LSD test; *p < 0.05, **p < 0.01).
FIGURE 7
FIGURE 7
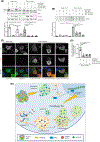
PPP3CB mediates TFE3 translocation induced by valosin-containing protein (VCP) mutants. (A) Real-time quantitative polymerase chain reaction (RT-qPCR) for PPP3CB mRNA normalised with Rplp0 mRNA levels. Data are means ± SD of 4 independent samples (unpaired student t test; ****p < 0.0001). (B) Fluorescence microscopy analysis (63× magnification) of NSC-34 overexpressing wild type (WT) or mutants FLAG-VCPs and transfected with PPP3CB or non-targeting siRNAs. TFE3 was visualised as GFP-TFE3 (green), and nuclei were stained with 4′,6-diamidino-2-phenylindole (DAPI) (blue). Scale bar, 10 μm. (C) The bar graph represents the quantification of TFE3 nuclear intensity; the fields were randomly selected, and at least 100 cells were analysed for each condition (two-way analysis of variance [ANOVA] with Fisher’s least significant difference [LSD] test; *p < 0.05, **p < 0.01, ****p < 0.0001)
FIGURE 8
FIGURE 8
Wild type (WT) and mutants valosin-containing proteins (VCPs) enhance G93A SOD1 clearance. (A) A representative western blotting (WB) (upper inset) of phosphate-buffered saline (PBS) extracts added with SDS, from NSC-34 cells overexpressing WT SOD1 or G93A SOD1 and WT or mutants FLAG-VCPs. To visualise exogenous human (upper lane) or endogenous murine (lower lane) SOD1, an anti-SOD1 antibody was used. To visualise total VCP, an anti-VCP antibody was used. To visualise overexpressed FLAG-VCPs, an anti-FLAG antibody was used. Glyceraldehyde-3-phosphate dehydrogenase (GAPDH) was used as loading control. The bar graph represents the optical densitometry quantification of SOD1 detected in WB (lower inset) (one-way analysis of variance [ANOVA] with Fisher’s least significant difference [LSD] test; *p < 0.05, **p < 0.01, ***p < 0.001). (B) Filter trap assay (FTA) (upper inset) of PBS extracts from NSC-34 cells overexpressing WT or G93A SOD1 and WT or mutants FLAG-VCPs. To visualise SOD1, an anti-SOD1 antibody was used. The bar graph represents the mean relative optical density quantification of FTA (lower inset) (one-way ANOVA with Fisher’s LSD test; ****p < 0.0001). (C) Immunofluorescence (IF) microscopy analysis (63× magnification) on NSC-34 overexpressing WT SOD1 or G93A SOD1 and WT or mutants FLAG-VCPs. SOD1 was stained with an anti-SOD1 antibody (green), FLAG-VCPs were stained with an anti-FLAG antibody (red) and nuclei were stained with DAPI (blue). A 4× magnification of selected areas is shown. Scale bar, 10 μm. (D) The bar graph represents the quantification of cells with aggregates/transfected cells ratio of NSC-34 transfected WT SOD1 or G93A SOD1 and WT or mutants FLAG-VCPs; the fields were randomly selected, and at least 50 cells for each sample were counted over 9 independent biological samples for each condition (n = 9) ± SD (one-way ANOVA followed by Fisher’s LSD test; ****p < 0.0001). (E) Proposed model for the pathological mechanism exerted by VCP mutants in neuronal cells. VCP mutants aggregate and cause lysosomal size and morphology alteration and damage. Lysosomal damage, via PPP3CB, specifically causes TFE3 dephosphorylation and nuclear translocation. Active TFE3 promotes autophagy activation, which results in an increased flux compared with basal conditions. The increased autophagic flux leads to the clearance of damaged lysosomes via lysophagy and eventually enhances the clearance of misfolded proteins (e.g., mutant SOD1). This figure was created using Servier Medical Art templates, which are licenced under a Creative Commons Attribution 3.0 Unported Licence; https://smart.servier.com

Similar articles

Cited by

References

    1. Koller KJ, Brownstein MJ. Use of a cDNA clone to identify a supposed precursor protein containing valosin. Nature. 1987;325(6104): 542–545. doi:10.1038/325542a0 - DOI - PubMed
    1. Moir D, Stewart SE, Osmond BC, Botstein D. Cold-sensitive cell-division-cycle mutants of yeast: isolation, properties, and pseudoreversion studies. Genetics. 1982;100(4):547–563. doi:10.1093/genetics/100.4.547 - DOI - PMC - PubMed
    1. Wang Q, Song C, Li CCH. Molecular perspectives on p97-VCP: progress in understanding its structure and diverse biological functions. J Struct Biol. 2004;146(1–2):44–57. doi:10.1016/j.jsb.2003.11.014 - DOI - PubMed
    1. Buchberger A, Schindelin H, Hänzelmann P. Control of p97 function by cofactor binding. FEBS Lett. 2015;589(19PartA):2578–2589. doi: 10.1016/j.febslet.2015.08.028 - DOI - PubMed
    1. Latterich M, Fröhlich KU, Schekman R. Membrane fusion and the cell cycle: Cdc48p participates in the fusion of ER membranes. Cell. 1995;82(6):885–893. doi:10.1016/0092-8674(95)90268-6 - DOI - PubMed

Publication types

MeSH terms

Substances