. 2022 Jun;32(6):1042-1057.
doi: 10.1101/gr.276193.121. Epub 2022 May 2.

Genetic, epigenetic, and environmental mechanisms govern allele-specific gene expression

Affiliations

Genetic, epigenetic, and environmental mechanisms govern allele-specific gene expression

Celine L St Pierre et al. Genome Res. 2022 Jun.

Abstract

Allele-specific expression (ASE) is a phenomenon in which one allele is preferentially expressed over the other. Genetic and epigenetic factors cause ASE by altering the final composition of a gene's product, leading to expression imbalances that can have functional consequences on phenotypes. Environmental signals also impact allele-specific expression, but how they contribute to this cross talk remains understudied. Here, we explored how genotype, parent-of-origin, tissue, sex, and dietary fat simultaneously influence ASE biases. Male and female mice from a F1 reciprocal cross of the LG/J and SM/J strains were fed a high or low fat diet. We harnessed strain-specific variants to distinguish between two ASE classes: parent-of-origin-dependent (unequal expression based on parental origin) and sequence-dependent (unequal expression based on nucleotide identity). We present a comprehensive map of ASE patterns in 2853 genes across three tissues and nine environmental contexts. We found that both ASE classes are highly dependent on tissue and environmental context. They vary across metabolically relevant tissues, between males and females, and in response to dietary fat. We also found 45 genes with inconsistent ASE biases that switched direction across tissues and/or environments. Finally, we integrated ASE and QTL data from published intercrosses of the LG/J and SM/J strains. Our ASE genes are often enriched in QTLs for metabolic and musculoskeletal traits, highlighting how this orthogonal approach can prioritize candidate genes. Together, our results provide novel insights into how genetic, epigenetic, and environmental mechanisms govern allele-specific expression, which is an essential step toward deciphering the genotype-to-phenotype map.


Figures

Figure 1.
Figure 1.
Evaluating ASE across tissues and environmental contexts. We partitioned ASE into its parent-of-origin and sequence effects, then compared ASE patterns across metabolic tissues, in response to dietary fat and between sexes. An example of parent-of-origin-dependent ASE is when the maternal allele (red) is preferentially expressed over the paternal allele (blue), regardless of which haplotype contributed it. An example of sequence-dependent ASE is when the LG/J allele is preferentially expressed over the SM/J allele, regardless of which parent contributed it.
Figure 2.
Figure 2.
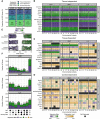
Both classes of ASE patterns are prevalent and distinct. (A) Venn diagram of all parent-of-origin-dependent ASE genes across tissues. (B) Number of significant parentally biased genes in each tissue-by-context analysis (maternal, red; paternal, blue): (All) all contexts; (H) high fat; (L) low fat; (F) females; (M) males; (HF) high fat females; (HM) high fat males; (LF) low fat females; and (LM) low fat males. (C) Summary of ASE biases across all analyses. (D) Proportions of gene classes in each tissue. (E) Venn diagram of all sequence-dependent ASE genes across tissues. (F) Number of significant sequence-biased genes in each tissue-by-context analysis (SM/J, purple; LG/J, green). (G) Summary of ASE biases across all analyses. (H) Proportions of gene classes in each tissue. (I) Parent-of-origin effect (POE) versus allelic genotype effect (AGE) scores in the “All” context of each tissue. Dots represent individual genes and are color coded by their ASE bias direction: (red) maternal; (blue) paternal; (purple) SM/J; (green) LG/J; and (yellow) both ASE classes. Most genes have no bias (gray). Dashed lines indicate significant score thresholds.
Figure 3.
Figure 3.
Parent-of-origin-dependent ASE patterns fall into three expression profiles. (A) Proportion of ASE genes per tissue with each parental bias profile. Heatmaps of ASE profiles across analyses: (B) tissue-independent, (C) tissue-dependent, and (D) context-dependent. A subset of the 271 genes is shown, including those validated with pyrosequencing. Genes are color coded by their expression pattern in each tissue-by-context analysis. Shades of red and blue indicate their degree of maternal or paternal bias, respectively (POE scores). If genes are not biased, shades of yellow indicate their biallelic expression levels (log-transformed total counts). Black indicates genes are not expressed. Bolded genes are canonically imprinted. The y-axis is grouped and sorted by chromosomal position. Supercolumns denote tissues: (HYP) hypothalamus; (WAT) white adipose; and (LIV) liver. Subcolumns denote environmental contexts: (All) all contexts; (H) high fat; (L) low fat; (F) females; (M) males; (HF) high fat females; (HM) high fat males; (LF) low fat females; and (LM) low fat males. (E) POE scores for each parental bias profile. Vertical lines indicate mean POE scores. Dots represent individual ASE genes. (F) UpSet plots of the significant sex, diet, and/or sex-by-diet effects of context-dependent genes in each tissue. Bar height and color indicate how many genes with each parental bias: (red) maternal; (blue) paternal; and (yellow) direction switching.
Figure 4.
Figure 4.
Sequence-dependent ASE patterns fall into three expression profiles. (A) Proportion of ASE genes per tissue with each sequence bias profile. Heatmaps of ASE profiles across analyses: (B) tissue-independent, (C) tissue-dependent, and (D) context-dependent. A subset of the 2673 genes are shown, including those validated with pyrosequencing. Genes are color coded by their expression pattern in each tissue-by-context analysis. Shades of purple and green indicate their degree of SM/J or LG/J bias, respectively (AGE scores). If genes are not biased, shades of yellow indicate their biallelic expression levels (log-transformed total counts). Black indicates genes are not expressed. The y-axis is grouped and sorted by chromosomal position. Supercolumns denote tissues: (HYP) hypothalamus; (WAT) white adipose; and (LIV) liver. Subcolumns denote environmental contexts: (All) all contexts; (H) high fat; (L) low fat; (F) females; (M) males; (HF) high fat females; (HM) high fat males; (LF) low fat females; and (LM) low fat males. (E) AGE scores for each sequence bias profile. Vertical lines indicate mean AGE scores. Dots represent individual ASE genes. (F) UpSet plots of the significant sex, diet, and/or sex-by-diet effects of context-dependent genes in each tissue. Bar height and color indicate how many genes with each sequence bias: (purple) SM/J; (green) LG/J; and (yellow) direction switching.
Figure 5.
Figure 5.
Forty-five ASE genes switch their sequence bias direction across conditions. Heatmap of ASE profiles for the 45 genes with significant sequence biases in opposite directions, including those validated with pyrosequencing. Genes are color coded by their expression pattern in each tissue-by-context analysis. Shades of purple and green indicate their degree of SM/J or LG/J bias, respectively (AGE scores). If genes are not biased, shades of yellow indicate their biallelic expression levels (log-transformed total counts). Black indicates genes are not expressed. The y-axis is grouped and sorted by chromosomal position. Supercolumns denote tissues: (HYP) hypothalamus; (WAT) white adipose; and (LIV) liver. Subcolumns denote environmental contexts: (All) all contexts; (H) high fat; (L) low fat; (F) females; (M) males; (HF) high fat females; (HM) high fat males; (LF) low fat females; and (LM) low fat males.
Figure 6.
Figure 6.
Integrating ASE and QTL data reveal Cidec as a candidate gene for insulin levels. (A) Breeding scheme for the LG/J x SM/J advanced intercross line. We calculated enrichment of tissue-specific ASE gene sets (x-axis) in trait-specific AIL QTL sets (y-axis) among sequence-dependent ASE genes in additive F16 QTL (top) and parent-of-origin-dependent ASE genes in imprinting F16 QTL (bottom) (B), and sequence-dependent ASE genes in additive F50–56 QTL (C). Circle color corresponds to the enrichment P-value. Numbers indicate the total overlapping ASE genes in each QTL set. (D,E) Tally of how many AIL QTLs contain each range of ASE genes: 0 (purple) to more than 10 (yellow). Pie charts match their adjacent ASE gene and QTL set intersections. (F) The AIL F16 QTL Ddiab6d showed context-dependent additive effects. Box plots of serum insulin levels across SNP rs6393943 genotypes in F16 mice (LL, LG/J homozygous; LS, heterozygous; SS, SM/J homozygous). The x-axis is grouped by diet-by-sex context: (HF) high fat females; (HM) high fat males; (LF) low fat females; and (LM) low fat males. Horizontal bars denote mean phenotypes. (***) P ≤ 0.001; assessed by Student's t-test. (G) Cidec had a context-dependent switch in sequence bias direction within LIV. ASE heatmap of Cidec across tissues-by-context analyses (for full description, see Fig. 4 or 5). (H) Cidec ASE biases had significant sex, diet, and diet-by-sex effects. Violin plots display individual AGE scores for Cidec (y-axis) across environmental contexts (x-axis). Horizontal bars denote mean AGE scores. Dots are color coded by their sequence bias. (**) P ≤ 0.01, (***) P ≤ 0.001; assessed by ANOVA (sex, diet) or Tukey's post hoc tests (diet-by-sex). (I) Cidec ASE profile in LIV and WAT was validated by pyrosequencing. Bar graphs denote mean allelic ratios (y-axis) in select cohorts (x-axis) and are color coded by allele (LG/J, green; SM/J, purple). (J) Cidec had significantly higher expression in HM. Violin plots of total expression levels in LIV (y-axis) for each diet-by-sex context (x-axis). (**) P ≤ 0.01; assessed by Student's t-test.

References

    1. Albrecht M, Choubey D, Lengauer T. 2005. The HIN domain of IFI-200 proteins consists of two OB folds. Biochem Biophys Res Commun 327: 679–687. 10.1016/j.bbrc.2004.12.056 - DOI - PubMed
    1. Andergassen D, Dotter CP, Wenzel D, Sigl V, Bammer PC, Muckenhuber M, Mayer D, Kulinski TM, Theussl HC, Penninger JM, et al. 2017. Mapping the mouse allelome reveals tissue-specific regulation of allelic expression. eLife 6: e25125. 10.7554/eLife.25125 - DOI - PMC - PubMed
    1. Babak T, DeVeale B, Tsang EK, Zhou Y, Li X, Smith KS, Kukurba KR, Zhang R, Li JB, van der Kooy D, et al. 2015. Genetic conflict reflected in tissue-specific maps of genomic imprinting in human and mouse. Nat Genet 47: 544–549. 10.1038/ng.3274 - DOI - PMC - PubMed
    1. Barlow DP, Bartolomei MS. 2014. Genomic imprinting in mammals. Cold Spring Harb Perspect Biol 6: a018382. 10.1101/cshperspect.a018382 - DOI - PMC - PubMed
    1. Bonasio R, Tu S, Reinberg D. 2010. Molecular signals of epigenetic states. Science 330: 612–616. 10.1126/science.1191078 - DOI - PMC - PubMed

Publication types