. 2022 Jun 1;42(22):4538-4554.
doi: 10.1523/JNEUROSCI.1750-21.2022.

In Vivo Multi-Day Calcium Imaging of CA1 Hippocampus in Freely Moving Rats Reveals a High Preponderance of Place Cells with Consistent Place Fields

Affiliations

In Vivo Multi-Day Calcium Imaging of CA1 Hippocampus in Freely Moving Rats Reveals a High Preponderance of Place Cells with Consistent Place Fields

Hannah S Wirtshafter et al. J Neurosci. .

Abstract

Calcium imaging using GCaMP indicators and miniature microscopes has been used to image cellular populations during long timescales and in different task phases, as well as to determine neuronal circuit topology and organization. Because the hippocampus (HPC) is essential for tasks of memory, spatial navigation, and learning, calcium imaging of large populations of HPC neurons can provide new insight on cell changes over time during these tasks. All reported HPC in vivo calcium imaging experiments have been done in mouse. However, rats have many behavioral and physiological experimental advantages over mice. In this paper, we present the first (to our knowledge) in vivo calcium imaging from CA1 HPC in freely moving male rats. Using the UCLA Miniscope, we demonstrate that, in rat, hundreds of cells can be visualized and held across weeks. We show that calcium events in these cells are highly correlated with periods of movement, with few calcium events occurring during periods without movement. We additionally show that an extremely large percent of cells recorded during a navigational task are place cells (77.3 ± 5.0%, surpassing the percent seen during mouse calcium imaging), and that these cells enable accurate decoding of animal position and can be held over days with consistent place fields in a consistent spatial map. A detailed protocol is included, and implications of these advancements on in vivo imaging and place field literature are discussed.SIGNIFICANCE STATEMENT In vivo calcium imaging in freely moving animals allows the visualization of cellular activity across days. In this paper, we present the first in vivo Ca2+ recording from CA1 hippocampus (HPC) in freely moving rats. We demonstrate that hundreds of cells can be visualized and held across weeks, and that calcium activity corresponds to periods of movement. We show that a high percentage (77.3 ± 5.0%) of imaged cells are place cells, and that these place cells enable accurate decoding and can be held stably over days with little change in field location. Because the HPC is essential for many tasks involving memory, navigation, and learning, imaging of large populations of HPC neurons can shed new insight on cellular activity changes and organization.

Keywords: Ca1; calcium imaging; hippocampus; miniscopes; place cells; rats.


Figures

Figure 1.
Figure 1.
GCaMP is expressed in the CA1 cell layer of rat HPC. a, Diagram showing injection locations of AAV9-Syn-GCaMP7c, right below the CA1 cell layer. There are four total injection sites, with 0.6 μl injected at each site (CC = corpus callosum, DG = dentate gyrus). b, Diagram showing level of aspiration in brain tissue. The entire corpus callosum is aspirated until the vertical striations of the alveus are visible. c, GCaMP expression in the HPC, taken with a confocal microscope. The CA1 cell layer is labeled. d, Cellular GCaMP expression is primarily localized to principal cells in the pyramidal call layer. All images are from the same section; arrow indicates a space in the tissue that was used for alignment and that can be followed in all images. Top, A comparison of GCaMP labeling (left) with cresyl violet staining (middle) performed sequentially in the same tissue slice. An overlay of the two images (right) shows that cellular GCaMP expression is highest in the pyramidal cell layer with some labeled dendrites and cell bodies extending into the stratum radiatum and oriens. The outlined area in the middle image roughly corresponds to the area imaged in the bottom panel. Bottom, GCaMP labeling (left) and labeling of PV+ interneurons using immunohistochemistry (center). The overlay (right) indicates only a minority of GCaMP cells in the stratum pyramidale expressed PV. The majority of PV+ cells appear to be located slightly ventral to the cellular GCaMP labeling. e, Diagram of linear track. The animal would run back and forth between the two sides to receive a pellet reward.
Figure 2.
Figure 2.
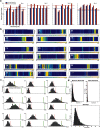
Hundreds of cells can be captured in a single Ca2+ imaging session. a, Examples of data from two (top and bottom rows) recording sessions. First column, Example image from preprocessing. Second column, Image postprocessing (see Materials and Methods). Third column. All cell extractions, before manual cell sorting. Fourth column, Postprocessing image overlayed with cell outlines identified after manual sorting. b, Example traces from 15 cells taken during 124 s of calcium imaging. c, Number of cells imaged per session for each rat. Dotted red line indicates the average for each animal. d, Histogram showing average rate (events/s) for individual cells. Dotted red line indicates the average (0.090 ± 0.019 events/s). e, The average calcium event rate (events/s) for individual rats (averages: 0.084 ± 0.024, 0.074 ± 0.026, 0.085 ± 0.020, and 0.116 ± 0.032 events/s). f, Correlation of average calcium event rate with average animal running speed. Average events per second in a session is positively correlated with the animal's average speed in that session (p < 0.05). g, An example from one session for the cross-correlation at different lags between the number of calcium events that occur in a second and the animal's speed. In this example, the maximum cross-correlation value at 0 s was ∼0.33, and the maximum value occurred at approximately 0.1 s. On average, the cross-correlation at a lag of 0 s was 1.8 ± 0.08, although the average maximum cross-correlation was 0.2 ± 0.7 at an average lag of +0.47 ± 0.54 s, indicating that calcium events reliably followed changes in speed, as opposed to vice versa.
Figure 3.
Figure 3.
Calcium events are correlated with periods of movement. a, Raster plot of cell firing during linear track running. Top, The animal's speed. Bottom, Raster of peak calcium transients of 352 identified cells. b, Graph showing an example of speed (plotted in black) overlayed with event rate (in blue). Bottom panel is a zoom in on a smaller time period. c, An example logarithmic correlation of animal speed against calcium events/s.
Figure 4.
Figure 4.
A high percentage of place cells are recorded on the linear track using Ca2+ imaging. a, Graph showing the percentage of place cells per session for each rat (blue). Analysis was repeated including only cells with a firing rate >0.01 Hz during movement (red). Dotted lines indicate the average for each animal. b, Nine example place cells. A firing rate map in both directions of travel is provided for each cell, with the top map corresponding with running to the right, and the bottom map corresponding with running to the left. Note the colorbar scales may be different for each direction of travel. The difference in MI scores between the cell and the top 95% of shuffled data (actual MI-shuffled MI) is indicated in the left corner. If the actual MI was >95% of shuffled data, the number is printed in bold white. c, Distribution of directional MI scores after shuffling cells seen in Figure 3b. Event data were shuffled 500 times and the top 95% of MI scores were determined from shuffled data (red dotted line). If the actual MI score (green line) was greater than the upper 95% MI score of shuffled data, the cell was considered to be a place cell. d, Top left, Place field maximum event rate during movement (dotted red line indicates average of 0.15 events/s). Top right, Average firing rate during movement (red line is average at 0.02 events/s). Bottom, Increase from average to maximum rate (max/mean). On average, cells increased firing 7.4× from their average firing rate during movement to their maximum firing rate (dotted red line indicates average).
Figure 5.
Figure 5.
Place cells are sufficient to decode the animal's position. a, Four decoding examples as the animal traverses the track. Black line indicates the animal's actual position, with the stars indicated sample point. The colored circles connected by the red line indicate decoded position. The color of the circles indicates decoding certainty. b, Same as a, but decoding is using shuffled units. Decoding is much less accurate using shuffled data.
Figure 6.
Figure 6.
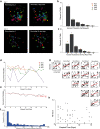
Individual cells and their place fields can be maintained across sessions. a, Cells can be maintained across sessions weeks apart. Examples from two animals of data taken on the first and final days of recording. Cells are color-matched from the first to last day. Cells in gray represent cells with no matches between the 2 d. Of note, while the camera was placed in the same approximate position each day, thus allowing landmarks (such as blood vessels) to be followed throughout the study, we did not attempt to perfectly align landmarks or focal planes across days; instead recordings each day were made to optimize total cell number in each day as proof of method. b, Percent of cells that appeared in different numbers of sessions. Symbols represent averages for individual animals. There was no significant difference in distribution of values between animals (nonparametric k-sample Anderson–Darling test, rank statistic: −1.48, p > 0.05). c, Percent of cells that had place fields in different numbers of sessions. Symbols represent averages for individual animals. There was no significant difference in distribution of values between animals (nonparametric k-sample Anderson–Darling test, rank statistic: −1.59, p > 0.05). d, The recurrence probability of a cell based on the number of days between recordings. Recordings from rat 3 were from found to be from two different focal planes. e, Average recurrence probability across days, excluding rat 3. For every day passing, a cell has a 0.43% less chance of reoccurring. f, Change in place field location between recording sessions. Included all sessions recorded for an animal; sessions did not need to be adjacent. g, A comparison of place field locations for one rat across all six recording sessions (15 comparisons). For all 15 comparisons using this animal, place field locations were highly correlated between the sessions. Each point indicates the place field of a single cell identified in the two sessions indicated. Red lines on the graphs indicate a p < 0.05 using an F test. Across all four animals, we found field locations to be consistently correlated, with 93% of session comparisons having a significantly positive correlation between place field locations (F test, p < 0.05). h, There was no correlation (p > 0.05) between r2 value of place field correlations and days elapsed between sessions.

Similar articles

Cited by

References

    1. Ahanonu B (2018) CIAtah: a software package for analyzing one- and two-photon calcium imaging datasets, v1.0.0 Edition. Zenodo.
    1. Aharoni D, Hoogland TM (2019) Circuit investigations with open-source miniaturized microscopes: past, present and future. Front Cell Neurosci 13:141. 10.3389/fncel.2019.00141 - DOI - PMC - PubMed
    1. Aharoni D, Khakh BS, Silva AJ, Golshani P (2019) All the light that we can see: a new era in miniaturized microscopy. Nat Methods 16:11–13. 10.1038/s41592-018-0266-x - DOI - PMC - PubMed
    1. Aika Y, Ren JQ, Kosaka K, Kosaka T (1994) Quantitative analysis of GABA-like-immunoreactive and parvalbumin-containing neurons in the CA1 region of the rat hippocampus using a stereological method, the disector. Exp Brain Res 99:267–276. 10.1007/BF00239593 - DOI - PubMed
    1. Andrzejewski ME, Ryals C (2016) Dissociable hippocampal and amygdalar D1-like receptor contribution to discriminated Pavlovian conditioned approach learning. Behav Brain Res 299:111–121. 10.1016/j.bbr.2015.11.034 - DOI - PMC - PubMed

LinkOut - more resources