. 2022 May 2;13(1):2374.
doi: 10.1038/s41467-022-29841-0.

Mre11-Rad50 oligomerization promotes DNA double-strand break repair

Affiliations

Mre11-Rad50 oligomerization promotes DNA double-strand break repair

Vera M Kissling et al. Nat Commun. .

Abstract

The conserved Mre11-Rad50 complex is crucial for the detection, signaling, end tethering and processing of DNA double-strand breaks. While it is known that Mre11-Rad50 foci formation at DNA lesions accompanies repair, the underlying molecular assembly mechanisms and functional implications remained unclear. Combining pathway reconstitution in electron microscopy, biochemical assays and genetic studies, we show that S. cerevisiae Mre11-Rad50 with or without Xrs2 forms higher-order assemblies in solution and on DNA. Rad50 mediates such oligomerization, and mutations in a conserved Rad50 beta-sheet enhance or disrupt oligomerization. We demonstrate that Mre11-Rad50-Xrs2 oligomerization facilitates foci formation, DNA damage signaling, repair, and telomere maintenance in vivo. Mre11-Rad50 oligomerization does not affect its exonuclease activity but drives endonucleolytic cleavage at multiple sites on the 5'-DNA strand near double-strand breaks. Interestingly, mutations in the human RAD50 beta-sheet are linked to hereditary cancer predisposition and our findings might provide insights into their potential role in chemoresistance.


Conflict of interest statement

The authors declare no competing interests.

Figures

Fig. 1
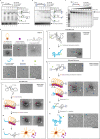
Fig. 1. MR oligomerizes via head domain and forms nucleolytically active assemblies on DNA.
a TEM of S. cerevisiae Mre11-Rad50 dimers (M2R2) and oligomers (M2R2)n with open (i, ii) or closed (iii) Rad50 coiled-coils. MR oligomerization via head domains (arrows in ii, iii; gray cartoon lines in iii, iv) and further interaction through coiled-coil tethering (arrows in iv). (v) Larger MR oligomers at 30 °C with co-factors ATPγS, Mg2+, and Mn2+ (Supplementary Fig. 1a–c). Images representative of n = 3. b TEM of MR binding to plasmid DNA at 30 °C with co-factors as above. (i) M2R2 binding the DNA end. (ii, iii) MR dimers oligomerizing on DNA and some MR molecules forming “pearls-on-a-string”-like structures (zoom-insets of examples with cartoons), irrespective of DNA ends (Supplementary Fig. 1e, f). n = 3. c EMSA of MR binding to plasmid DNA (i) and quantification (ii; Supplementary Fig. 1g). Mean ± SEM, n = 3 or n = 4 independent experiments, sigmoidal fit. d (i) Resection assay with probe (green box in cartoon) binding to the 3′-overhang produced. n = 2. (ii) TEM of (i) without pSae2 but with ATPγS to stabilize MR on DNA. n = 3. Large MR oligomers still catalyze resection with pSae2 and ATP. e Quantification of EMSAs as in Supplementary Fig. 2a with oligonucleotides of different lengths (100 nM base pairs). KD as MR concentration at 50% DNA binding ± SEM of n20,31bp = 4, n70,100,197bp = 3, unpaired two-tailed t-test. f Molecular mass distributions from mass photometry show better MRwt binding to longer oligonucleotides (100 nM base pairs). Cartoons illustrate species in peaks. Measured molecular weight (MW, kDa) ± SD in gray. Zoom insets show MW range where a peak of two MR dimers bound to one DNA molecule would be expected and was fitted where possible (Supplementary Fig. 3c). n = 3 independent experiments. g Model illustrating that in the presence of DNA, MR oligomers dissociate to dimers which then oligomerize again via head domain interactions at DNA ends or internally to “pearls-on-a-string”-like assemblies and larger clusters. Substrate compaction suggests DNA loop formation and coiled-coil tethering. Scale bars: 100 nm (a, b, d).
Fig. 2
Fig. 2. MR oligomerization on DNA accompanies end resection.
a Short-range end resection of MR-pSae2 and handover to Exo1 for long-range resection (10 min, +) on plasmid DNA with free ends. Resection detection with probe (green box see cartoons) binding to the 3′-overhang produced. Image is representative of n = 4 experiments. b As a, but plasmid DNA with streptavidin-blocked ends (Supplementary Fig. 4a, b). n = 4. c Stepwise resection by MR-pSae2 (small black arrows) on the 5′-terminated DNA strand. Red star marks the position of the radio-label. n = 2. d Representative TEM images visualizing short- and long-range end resection by MR-pSae2 and Exo1 on plasmid DNA with free (i, ii) and streptavidin-blocked ends (iii) under conditions comparable to a and b, n = 3. Scale bars: 100 nm. Legend shows cartoons, indicative arrows, and corresponding micrographs of the reaction components. Schematic cartoons in (i–iii) illustrate adjacent micrographs of the different reactions. Due to the resolution of the negative staining images, the number of molecules or their orientation drawn in the cartoons may not exactly correspond to the assembly in the micrographs. (i, I) Linear plasmid substrate shows no significant stretches of RPA-coated, single-stranded DNA in the absence of MR-pSae2 or Exo1. (II–IV) MR-pSae2 oligomerize on DNA (magenta arrows and labels; Supplementary Fig. 4c) and produce short resected, RPA-coated single-stranded DNA overhangs in 2.5 h, before dissociating from DNA and likely forming their respective oligomers. (ii) Exo1 can resect entire plasmid substrates with free ends in 5 min. (iii) Plasmid DNA with two streptavidin blocks per end can only be resected by Exo1 if pSae2-MR oligomers process these DNA substrates beforehand. pSae2-MR clusters (magenta arrows and labels) can harbor several streptavidin-blocked DNA substrates (II, left) and execute short-range resection on one DNA end within 2.5 h, resulting in short resected, RPA-coated single-stranded DNA overhangs (II, right). Exo1 can then fully resect the DNA substrates within 10 min (III–IV).
Fig. 3
Fig. 3. Mutagenesis of conserved Rad50 interface regulates MR oligomerization.
a Crystal structure of two C. thermophilum (Ct) Rad50 dimers bound to one oligonucleotide molecule each (PDB: 5DAC, 10.2210/pdb5dac/pdb) used to generate a plausible interaction model as guide for validation by mutagenesis. Possible interactions of adjacent Rad50 dimers on DNA via a small beta-sheet (β) and its connecting loop (L) protruding from the Rad50 head domain (rectangle), especially if bound DNA was continuous. Zoom-inset shows red/blue residues mutated in the S. cerevisiae (Sc) Mre11-Rad50ho/lo variants. Gray dotted line: salt bridge between E125 and R126 residues of adjacent CtRad50 dimers (spacing 3.8 Å within crystal). Red dotted line: repulsive E125 residues of adjacent CtRad50 dimers are spaced by 4.8 Å within the crystal, but could come closer on continuous DNA and in solution. b Sequence alignment of the Ct, Sc, and H. sapiens Rad50 beta-sheet motifs. Color code as in a. * indicates germline point mutations listed on ClinVar/MedGen for cancer-predisposed humans. Cartoons show multiple point mutations introduced in ScRad50 to disrupt electrostatic (Rad50ho) or hydrophobic (Rad50lo) interactions (Supplementary Fig. 5a). c Thioflavin T (ThT) fluorescence of ScMRwt indicates beta-sheet rich higher-order structures (Supplementary Fig. 5e). Mean ± SEM, n = 4 independent experiments, unpaired two-tailed t-test, a.u., arbitrary units. d (i) Representative TEM of ScMRwt/ho/lo as in Fig. 1a–v. (ii) Quantification of mean head domain diameters ± SEM of ScMRwt/ho/lo oligomers from (i) along their longest axis. nMR-wt = 30 molecules, nMR-ho = 72, and nMR-lo = 46. Gray area indicates diameter range of ~8–14 nm measured for ScMRwt dimers. Scale bar: 100 nm. e Molecular mass distributions from mass photometry show better ScMRho binding to longer oligonucleotides (100 nM base pairs). Cartoons illustrate species in peaks. Measured molecular weight (MW, kDa) ± SD in gray. Zoom-insets show MW range where a peak of two MR dimers bound to one DNA molecule would be expected and was fitted where possible (Supplementary Fig. 3b). n = 3 independent experiments. f Quantification of ScMRwt/ho pelleting assays at 4 or 42 °C (see Supplementary Fig. 5c). Sup. supernatant. Higher temperature promotes oligomerization. Mean ± SEM, n = 3, unpaired two-tailed t-tests.
Fig. 4
Fig. 4. MR oligomerization influences DNA binding behavior and endonuclease activity.
a Quantification of EMSAs of MRwt/ho/lo binding to 100 bp-long DNA as in Supplementary Figs. 2a and 5f. Mean ± SEM, n = 3 independent experiments, sigmoidal fit. b TEM of MRho/lo binding to plasmid DNA. Images representative of n = 3 experiments. MRlo binds dispersedly on DNA without oligomerization, while MRho dimers oligomerize on DNA to a denser “worm”-like structure compared to the “pearls-on-a-string” assembly of MRwt (Fig. 1b-ii) at similar conditions (see “Methods”). c TEM of Mre11wt and Rad50wt/ho/lo binding to plasmid DNA. n = 3. In contrast to purified Mre11wt, Rad50wt forms “pearls-on-a-string”-like structures on linear plasmid DNA. Rad50lo fails to oligomerize, thus binds dispersedly on DNA, while Rad50ho clusters into large oligomers on DNA, similarly to MRho. d, e Endonuclease assays of MRwt/ho/lo-pSae2 (d, Supplementary Fig. 6a) with quantification (e). Images representative of n = 3 experiments. Mean ± SEM, unpaired two-tailed t-tests. Red star marks the position of the radio-label. f, g Representative endonuclease activity kinetics of MRwt/ho-pSae2 (f) with quantification (g). Mean ± SEM, n = 3 independent experiments. Red star marks the position of the radio-label. h Representative resection assay of MRho with probe (green box in cartoon) binding to the 3′-overhang produced. n = 2. Note that the large MRho oligomers in Fig. 4b are active in resection. i Interaction assay of MRwt/ho/lo with the C-terminal part of pSae2 (pSae2 N169). Ponceau and anti-MBP western blot indicate elution of MBP-tagged pSae2 N169. The anti-Rad50 western blot shows interaction of pSae2 N169 with Rad50 in MRwt/ho/lo. One out of two independent experiments is shown. Scale bars: 100 nm (b, c).
Fig. 5
Fig. 5. Foci formation and DNA repair require MRX oligomerization in vivo.
a Serial dilution of exponentially growing S. cerevisiae rad50 cells expressing Rad50wt/ho/lo-yEVenus, spotted on agar plates (YPD) +/− DNA damage-inducing camptothecin (CPT) or hydroxyurea (HU), and incubated for 2 days at 30 °C. n = 3. b Doubling times of exponentially growing rad50 cells and rad50 strains expressing Rad50wt/ho/lo-yEVenus +/− CPT treatment. Mean and minimum to maximum values shown, n = 3 independent experiments. c Anti-Rad50 western blot showing galactose-induced overexpression of untagged Rad50wt/ho/lo in wild-type cells (+Gal-OE). Center panel is contrast-enhanced to show endogenous Rad50wt levels (wild-type, −Gal-OE). α-Tubulin controls equal loading. n = 3. d Serial dilution of exponentially growing wild-type cells expressing galactose-inducible Rad50wt/ho/lo, spotted on SD-URA agar plates with glucose (−) or galactose (+ variant overexpression), and incubated at 30 °C for 2 days. Before overexpression, cells carrying Rad50wt/ho/lo were similarly resistant to DNA damage as wild-type cells due to endogenous Rad50wt (−, top). n = 3. e Representative live-cell images of untreated or CPT-treated rad50 cells expressing Rad50wt/ho/lo-yEVenus with histone Hta2-mCherry as nuclear marker. Arrows indicate nuclear Rad50 foci (Supplementary Fig. 7a). f Anti-Rad50 western blot showing expression levels of Rad50wt/ho/lo-yEVenus in rad50 cells before (−) and after (+) CPT treatment. α-Tubulin controls equal loading. n = 3. g Quantification of live-cell imaging in e. The percentage of cells with nuclear Rad50-yEVenus foci (arrows in e) is shown for untreated and CPT-treated rad50 cells expressing Rad50wt/ho/lo-yEVenus. Mean ± SD, n = 3 independent experiments, unpaired two-tailed t-test. Scale bars: 5 µm.
Fig. 6
Fig. 6. DNA damage checkpoint activation and telomere maintenance.
a Activation of the Rad50wt/ho/lo-mediated DNA damage checkpoint, monitored by HU-induced Rad53 phosphorylation (α-Rad53). In contrast to untagged Rad50wt/ho, the upshift of the phosphorylated Rad53 band is reduced in rad50 and Rad50lo-expressing cells (see also Supplementary Fig. 7b). α-Pgk1 controls equal loading. n = 2. b Representative telomeric PCR analysis for telomere 6Y′ in two clones per genotype. PCRs were performed with oligonucleotides oBL361 and oBL359 (see also “Methods” and Supplementary Fig. 7c). n = 4. c Quantification of telomeric PCR analysis of telomere 6Y′ in b. Fragment length was determined by using the 100 bp DNA ladder as size reference. n = 4 for each genotype; mean ± SD. Note that rad50 and Rad50lo-expressing cells have shorter telomeres than cells with Rad50wt/ho.

Similar articles

Cited by

References

    1. Bian L, Meng Y, Zhang M, Li D. MRE11-RAD50-NBS1 complex alterations and DNA damage response: implications for cancer treatment. Mol. Cancer. 2019;18:169. doi: 10.1186/s12943-019-1100-5. - DOI - PMC - PubMed
    1. Chaudhuri AR, et al. Replication fork stability confers chemoresistance in BRCA-deficient cells. Nature. 2016;535:382–387. doi: 10.1038/nature18325. - DOI - PMC - PubMed
    1. Schlacher K, et al. Double-strand break repair-independent role for BRCA2 in blocking stalled replication fork degradation by MRE11. Cell. 2011;145:529–542. doi: 10.1016/j.cell.2011.03.041. - DOI - PMC - PubMed
    1. Reginato G, Cejka P. The MRE11 complex: a versatile toolkit for the repair of broken DNA. DNA Repair. 2020;91–92:102869. doi: 10.1016/j.dnarep.2020.102869. - DOI - PubMed
    1. Oh J, Symington LS. Role of the Mre11 complex in preserving genome integrity. Genes. 2018;9:589. doi: 10.3390/genes9120589. - DOI - PMC - PubMed

Publication types

MeSH terms