. 2022 May 2;13(5):426.
doi: 10.1038/s41419-022-04872-z.

The dual role of glioma exosomal microRNAs: glioma eliminates tumor suppressor miR-1298-5p via exosomes to promote immunosuppressive effects of MDSCs

Affiliations

The dual role of glioma exosomal microRNAs: glioma eliminates tumor suppressor miR-1298-5p via exosomes to promote immunosuppressive effects of MDSCs

Yanhua Qi et al. Cell Death Dis. .

Abstract

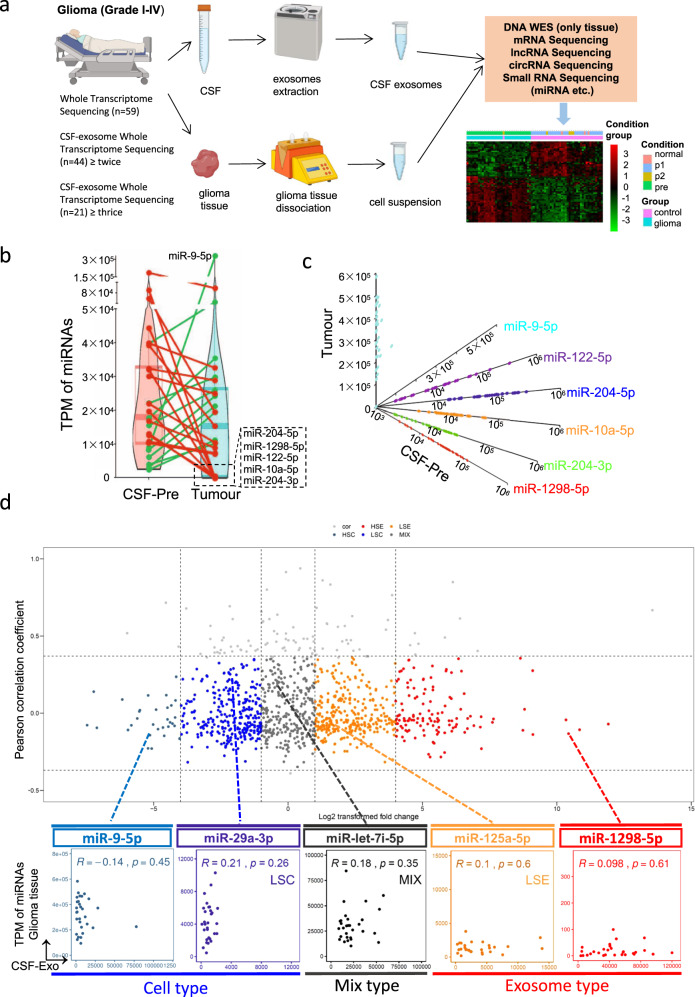
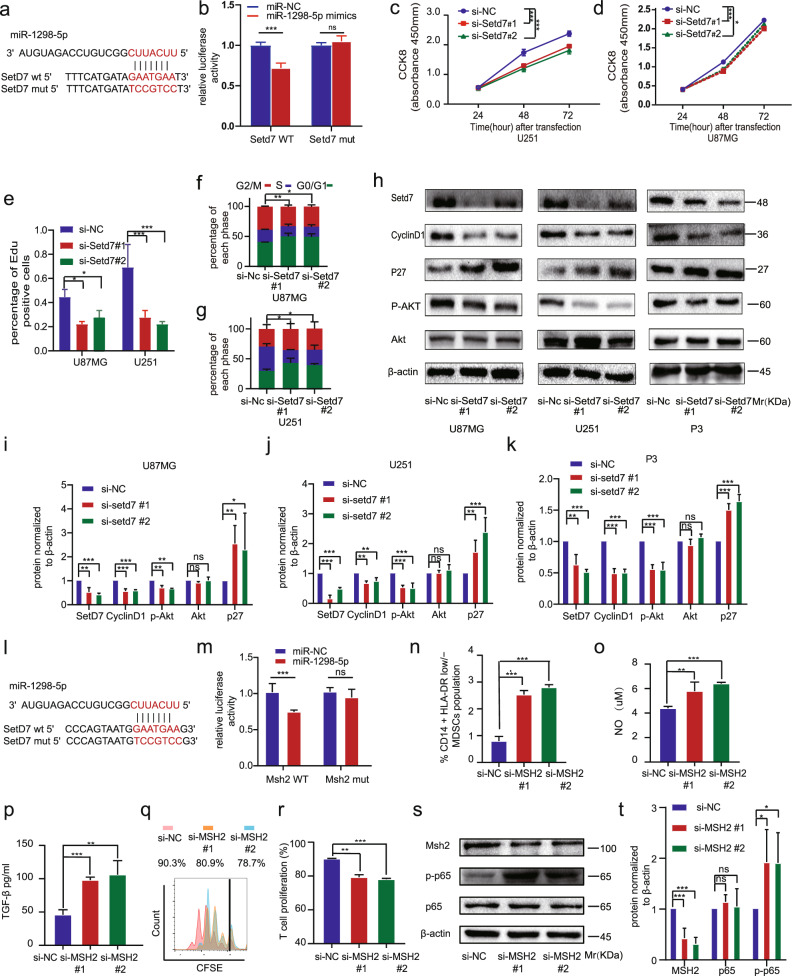
Clear evidence shows that tumors could secrete microRNAs (miRNAs) via exosomes to modulate the tumor microenvironment (TME). However, the mechanisms sorting specific miRNAs into exosomes are still unclear. In order to study the biological function and characterization of exosomal miRNAs, we performed whole-transcriptome sequencing in 59 patients' whole-course cerebrospinal fluid (CSF) small extracellular vesicles (sEV) and matched glioma tissue samples. The results demonstrate that miRNAs could be divided into exosome-enriched miRNAs (ExomiRNAs) and intracellular-retained miRNAs (CLmiRNAs), and exosome-enriched miRNAs generally play a dual role. Among them, miR-1298-5p was enriched in CSF exosomes and suppressed glioma progression in vitro and vivo experiments. Interestingly, exosomal miR-1298-5p could promote the immunosuppressive effects of myeloid-derived suppressor cells (MDSCs) to facilitate glioma. Therefore, we found miR-1298-5p had different effects on glioma cells and MDSCs. Mechanically, downstream signaling pathway analyses showed that miR-1298-5p plays distinct roles in glioma cells and MDSCs via targeting SETD7 and MSH2, respectively. Moreover, reverse verification was performed on the intracellular-retained miRNA miR-9-5p. Thus, we confirmed that tumor-suppressive miRNAs in glioma cells could be eliminated through exosomes and target tumor-associated immune cells to induce tumor-promoting phenotypes. Glioma could get double benefit from it. These findings uncover the mechanisms that glioma selectively sorts miRNAs into exosomes and modulates tumor immunity.


Conflict of interest statement

The authors declare no competing interests.

Figures

Fig. 1
Fig. 1. The CSF sEV miRNAs efflux.
a Flowchart of our CSF sEV cohort study in 44 CSF sEV samples available patients with glioma from 148 WHO grade I–IV individuals. All 44 patients in this study were treated with surgery, and the tumor was totally removed under a surgical microscope. At the same time, multiple CSF specimens were obtained by a lumbar puncture at pre-operation and post-operation. Among them, the CSF specimens of 19 patients were further collected during the follow-up. These tumor specimens were undergoing whole exon and whole-transcriptome sequencing, and the CSF samples were extracting sEV for following whole-transcriptome sequencing. b Violin-plot showing pair-wise comparison of high-expressed miRNAs (TPM > 10000) expression in pre-operation CSF sEV and glioma tissues. At left: each point represents the mean value of high-expressed miRNAs in pre-operation CSF sEV. At right: each point represents the mean value of high-expressed miRNAs in glioma tissues. Points of same miRNAs at left and right were link together. c A combination of scatter diagram of miR-9-5p, miR-122-5p, miRNA-204-5p, miR-10a-5p, miR-204-3p, miR-1298-5p. d Fold change and pair-wise Pearson Correlation Coefficient of miRNA expression between pre-operation CSF sEV and glioma tissues were calculated. miRNAs were divided into five types: high-selective sEV type (HSE), low-selective sEV type (LSE), mix type (MIX), low-selective cell type (LSC), and high-selective cell type (HSC). For each type, a scatter diagram of representative miRNA is displayed.
Fig. 2
Fig. 2. miR-1298-5p inhibited the proliferation of glioma in vitro and vivo.
a, b Cell cycle analysis for U87MG and U251 cells transfected with miR-1298-5p mimics and a control sequence. The percentage of cells arrested in the G1/S phase is analyzed in a histogram (right panels). cf The protein level of proliferation markers cyclinD1, P27, CDK6, and the AKT pathway in U87MG, U251 and P3 cells transfected with miR-1298-5p mimics and a control sequence were assessed by western blotting. Amounts of protein determined by densitometry of protein bands from three experiments.β-actin was the loading control. gj The proliferation capacity of U87MG and U251 cells transfected with miR-1298-5p mimics were assessed using CCK8 assay and Edu assay. k In vivo bioluminescent imaging analysis of tumor growth in xenograft nude mice at day 10. l Quantification of luminescent signals in the Lenti-NC and OV-miR-1298-5p mice. m Survival analysis of nude mice orthotopically implanted with U87MG cells transfected with lentivirus overexpressing the control sequence or miR-1298-5p. (P = 0.0180 by log-rank analysis; data from 5 animals/group). n H&E staining of xenograft sections from miR-1298-5p-overexpressing or negative control U87MG cell tissues on the same day of execution. Data are shown as the mean ± SD of three independent experiments. Statistical significance was determined using one-way ANOVA test (*P < 0.05; **P < 0.01; ***P < 0.001).
Fig. 3
Fig. 3. miR-1298-5p promoted the immunosuppressive effects of MDSCs.
a, b Flow cytometry assay showed that GDEs overexpressing miR-1298-5p displayed a stronger MDSC induction ability than the PBS and GDEs. c, d Flow cytometry assay showed that miR-1298-5p upregulated the proportion of CD14+/HLA-DR low/-MDSCs population. e, f qRT-PCR demonstrated that miR-1298-5p increased the expression of NOS2 and TGF-β in MDSCs. g, h qRT-PCR demonstrated that GDEs overexpressing miR-1298-5p increased the expression of NOS2 and TGF-β in MDSCs. i, j NO and TGF-β in the supernatants of MDSCs were measured. k, l GDEs overexpressing miR-1298-5p increased the content of NO and TGF-β in the supernatants of MDSCs. m, n CD8 + T cell proliferation was determined by flow cytometry three days later with CFSE dilution. o, p The protein level of the NF-κB pathway in MDSCs transfected with miR-1298-5p mimics and a control sequence were assessed by western blotting. Amounts of protein determined by densitometry of protein bands from three experiments. β-actin was the loading control. q The expression of miR-1298-5p in MDSCs of patents was higher than health donors. Data are shown as the mean ± SD of three independent experiments. Statistical significance was determined using one-way ANOVA test (*P < 0.05; **P < 0.01; ***P < 0.001).
Fig. 4
Fig. 4. miR-1298-5p was sorted into exosomes via hnRNPA2B1.
a Sequence motifs of hnRNPA2B1 binding site predicted by POSTAR2. b, c qRT-PCR assay analyzed the exo/cell ratio of miR-1298-5p in U87MG and P3 after knocking down hnRNPA2B1. d RNA pull-down and western blot with U87MG lysate confirmed that miR-1298-5p was associated with hnRNPA2B1. e RIP analysis using the anti-hnRNPA2B1 antibody revealed that miR-1298-5p interacted with hnRNPA2B1 in U87MG cells. The negative control, IgG. f Schematic graph of in vitro coculture system. g Internalization of Cy3-labeled miR-1298-5p by MDSCs. h, i hnRNPA2B1 was knocked down in U87MG. Internalization of Cy3-labeled miR-1298-5p by MDSCs was assessed by flow cytometry after coculture for 24 h. j, k Cultured MDSCs with U87MG and P3 knocking down hnRNPA2B1 and analyzed the ratio of CD14 + HLA-DR low/− MDSCs population using Flow cytometry assay. Statistical significance was determined using one-way ANOVA test (*P < 0.05; **P < 0.01; ***P < 0.001).
Fig. 5
Fig. 5. miR-1298-5p targeted SETD7 in glioma and MSH2 in MDSCs.
a Construction of wild type (WT) and mutant type (MUT) luciferase reporter vectors based on the predicted binding site of miR-1298-5p in SETD7. b 293 T cells were co-transfected with the reporter vectors and miR-1298-5p or miR-Nc. Luciferase activity was assessed 48 h after transfection. c, d The proliferation capacity of U87MG and U251 cells after SETD7 knockdown were assessed using CCK8 assay. e The proliferation capacity of U87MG and U251 cells after SETD7 knockdown were assessed using the Edu assay. f, g Cell cycle analysis for U87MG and U251 cells knocking down SETD7. The percentage of cells arrested in the G1/S phase is analyzed in a histogram. hk The protein level of SETD7, cyclinD1, P27, p-Akt, Akt in U87MG, U251, and P3 cells knocking down SETD7 were assessed by western blotting. Amounts of protein determined by densitometry of protein bands from three experiments. β-actin was the loading control. l Construction of wild type (WT) and mutant type (MUT) luciferase reporter vectors based on the predicted binding site of miR-1298-5p in MSH2. m 293 T cells were co-transfected with the reporter vectors and miR-1298-5p or miR-Nc. Luciferase activity was assessed 48 h after transfection. n Flow cytometry assay showed that MSH2 knockdown upregulated the proportion of CD14 + HLA-DR low/− MDSCs population. o, p NO and TGF-β in the supernatants of MDSCs were measured after MSH2 knockdown. q, r CD8 + T cell proliferation was determined by flow cytometry 3 days later with CFSE dilution. s, t The protein level of p65 and p-p65 in MDSCs transfected with MSH2 siRNAs were accessed by western blotting. Amounts of protein determined by densitometry of protein bands from three experiments. β-actin was the loading control. Data are shown as the mean ± SD of three independent experiments. Statistical significance was determined using one-way ANOVA test (*P < 0.05; **P < 0.01; ***P < 0.001).
Fig. 6
Fig. 6. The effects of miR-1298-5p overexpression in glioma could be partially attenuated by SETD7 overexpression.
a Protein level of SETD7, cyclinD1, P27, p-Akt, Akt in U87MG, U251, and P3 cells transfected with miR-1298-5p mimics and pcDNA3.1-SETD7 or pcDNA3.1 were assessed by western blotting. β-actin was used as the control for normalization. b Cell cycle analysis for U87MG and U251 cells. c–e Amounts of protein determined by densitometry of protein bands from three experiments. β-actin was the loading control. f, g The percentage of cells transfected with miR-1298-5p mimics arrested in the G1/S phase can be attenuated by SETD7 overexpression. hk The proliferation capacity of U87MG and U251 cells treated as described above were assessed using CCK8 assay and EDU assay. Data are shown as the mean ± SD of three independent experiments. Statistical significance was determined using one-way ANOVA test (*P < 0.05; **P < 0.01; ***P < 0.001).
Fig. 7
Fig. 7. The effects of miR-1298-5p overexpression in MDSCs could be partially attenuated by MSH2 overexpression.
a, b MDSCs transfected with miR-1298-5p mimics and pcDNA3.1-MSH2 or pcDNA3.1 were assessed by Flow cytometry assay. c, d The protein level of MSH2, p-p65 and p65 in MDSCs treated as described above were assessed by western blotting. Amounts of protein determined by densitometry of protein bands from three experiments. β-actin was the loading control. e The qRT-PCR assay showed the change of the expression of NOS2 and TGF-β in MDSCs treated as described above. f, g NO and TGF-β in the supernatants of MDSCs treated as described above. h, i CD8 + T cell proliferation was determined by flow cytometry 3 days later with CFSE dilution. j Schematic model showing that glioma selectively sorted oncosuppressor miR-1298-5p into exosomes and exosomal miR-1298-5p could promote the Immunosuppressive effects on of MDSCs. Moreover, miR-9-5p could promote glioma progression and induce M1 polarization of macrophages. Therefore, miR-9-5p was trapped inside cells. Data are shown as the mean ± SD of three independent experiments. Statistical significance was determined using one-way ANOVA test (*P < 0.05; **P < 0.01; ***P < 0.001).

Similar articles

Cited by

References

    1. Reifenberger G, Wirsching HG, Knobbe-Thomsen CB, Weller M. Advances in the molecular genetics of gliomas—implications for classification and therapy. Nat Rev Clin Oncol. 2017;14:434–52. doi: 10.1038/nrclinonc.2016.204. - DOI - PubMed
    1. Lim M, Xia Y, Bettegowda C, Weller M. Current state of immunotherapy for glioblastoma. Nat Rev Clin Oncol. 2018;15:422–42. doi: 10.1038/s41571-018-0003-5. - DOI - PubMed
    1. Galon J, Bruni D. Tumor immunology and tumor evolution: intertwined histories. Immunity. 2020;52:55–81. - PubMed
    1. Quail D, Joyce JJCC. The microenvironmental landscape of brain tumors. Cancer Cell. 2017;31:326–41. doi: 10.1016/j.ccell.2017.02.009. - DOI - PMC - PubMed
    1. Sampson J, Gunn M, Fecci P, Ashley DJNRC. Brain immunology and immunotherapy in brain tumours. Nat Rev Cancer. 2020;20:12–25. doi: 10.1038/s41568-019-0224-7. - DOI - PMC - PubMed

Publication types

MeSH terms