. 2022 May 2;13(1):2365.
doi: 10.1038/s41467-022-29697-4.

The 4D Nucleome Data Portal as a resource for searching and visualizing curated nucleomics data

Affiliations

The 4D Nucleome Data Portal as a resource for searching and visualizing curated nucleomics data

Sarah B Reiff et al. Nat Commun. .

Erratum in

Abstract

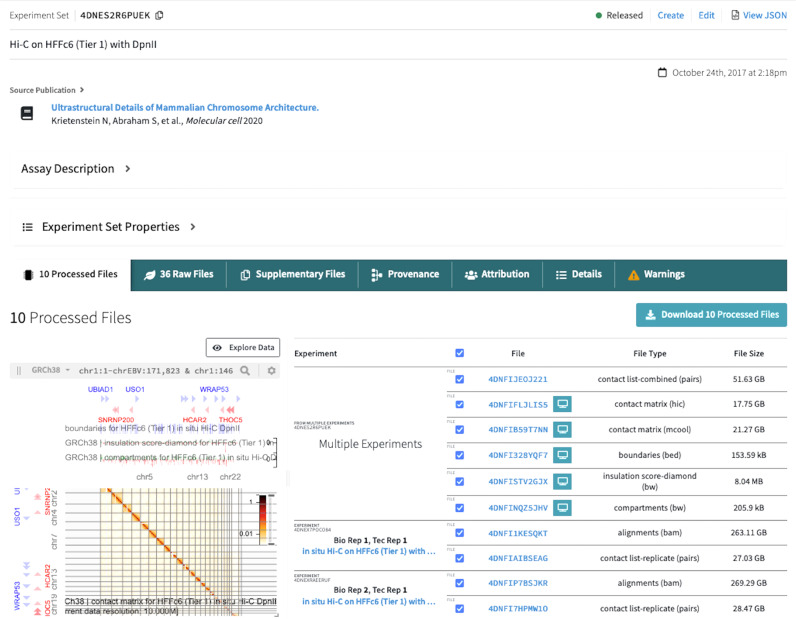
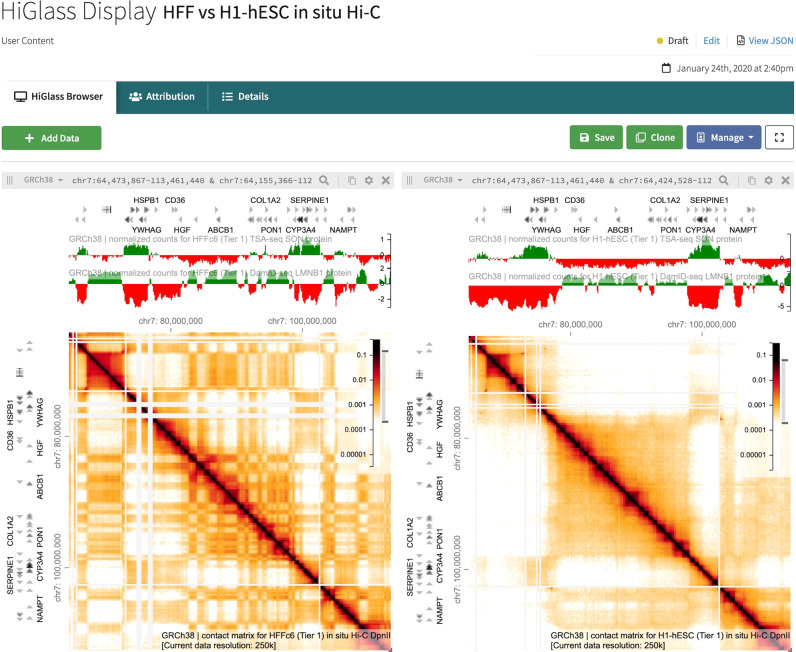
The 4D Nucleome (4DN) Network aims to elucidate the complex structure and organization of chromosomes in the nucleus and the impact of their disruption in disease biology. We present the 4DN Data Portal ( https://data.4dnucleome.org/ ), a repository for datasets generated in the 4DN network and relevant external datasets. Datasets were generated with a wide range of experiments, including chromosome conformation capture assays such as Hi-C and other innovative sequencing and microscopy-based assays probing chromosome architecture. All together, the 4DN data portal hosts more than 1800 experiment sets and 36000 files. Results of sequencing-based assays from different laboratories are uniformly processed and quality-controlled. The portal interface allows easy browsing, filtering, and bulk downloads, and the integrated HiGlass genome browser allows interactive visualization and comparison of multiple datasets. The 4DN data portal represents a primary resource for chromosome contact and other nuclear architecture data for the scientific community.


Conflict of interest statement

The authors declare no conflict of interest.

Figures

Fig. 1
Fig. 1. Browsing 4DN experiment sets.
The browse view features a table of experiment sets, the second of which can be seen expanded here to show additional metadata and information about files. On the left are a number of properties that can be used to filter the results; here “in situ Hi-C” is selected as well as Tier 1 samples. The top two experiment sets in the table are also shown with their checkboxes checked so that the “Download Files” button above the table can be used.
Fig. 2
Fig. 2. Item page for a replicate set of Hi-C experiments.
A source publication is shown near the top of the page, when available. Below these are two dropdown boxes: the first, titled Assay Description, can be expanded for an explanation of the assay, and the second, titled Experiment Set Properties, contains a selection of basic metadata fields. Below is a window with several tabs. The selected tab shows the processed files associated with the experiment. The .mcool contact matrix file is visualized on the left using the integrated HiGlass browser as a 2D track, with TAD boundaries, insulation scores, and compartments as 1D tracks above it. This display can be expanded for further data exploration. Scrolling down on this page would reveal the quality control metrics associated with the processed data.
Fig. 3
Fig. 3. HiGlass Display containing 2D and 1D Genomic Tracks.
The display shows a visualization of an HFF in situ Hi-C contact matrix on the left, and one for H1 hESCs on the right. Above each 2D contact matrix visualization are 1D tracks from a TSA-seq experiment (topmost) and a DamID-seq experiment (second from top), in the cell type that matches the corresponding matrix. The “Add Data” button in the top left gives the user the option to add more files to the visualization display; on the top right, the user has the ability to save the display, clone the display to create a new item, or to manage permissions of who can view the display.
Fig. 4
Fig. 4. Microscopy experiment set item page.
Item pages for microscopy experiment sets are similar to those for genomics, but with a few important differences. The sample image field contains an image preview, which can be clicked for a popup containing an interactive image viewer. Beside the sample image is a field called “Imaging Paths”, which describes what is imaged in each channel for the experiments, including the biological target and the antibodies or probes used.
Fig. 5
Fig. 5. 4DN Data Portal architecture.
Metadata is submitted by users via spreadsheet forms and gets loaded into the database, while associated files are uploaded into cloud storage. Once metadata and files are in place, automated processing pipelines can be run on AWS using the Tibanna pipeline runner. All metadata can then be searched via the data portal website, where files can also be visualized with HiGlass. The data portal website is accessible to external users, who can also login in order to download files.

References

    1. Dekker J, et al. The 4d nucleome project. Nature. 2017;549:219–226. - PMC - PubMed
    1. Lieberman-Aiden E, et al. Comprehensive mapping of long-range interactions reveals folding principles of the human genome. Science. 2009;326:289–293. - PMC - PubMed
    1. Hansen RS, et al. Sequencing newly replicated DNA reveals widespread plasticity in human replication timing. Proc. Natl. Acad. Sci. USA. 2010;107:139–144. - PMC - PubMed
    1. van Steensel B, Henikoff S. Identification of in vivo DNA targets of chromatin proteins using tethered dam methyltransferase. Nat. Biotechnol. 2000;18:424–428. - PubMed
    1. Skene PJ, Henikoff S. An efficient targeted nuclease strategy for high-resolution mapping of DNA binding sites. eLife. 2017;6:e21856. - PMC - PubMed

Publication types