. 2022 May 2;13(1):2387.
doi: 10.1038/s41467-022-29942-w.

Transcription Factor 4 loss-of-function is associated with deficits in progenitor proliferation and cortical neuron content

Affiliations

Transcription Factor 4 loss-of-function is associated with deficits in progenitor proliferation and cortical neuron content

Fabio Papes et al. Nat Commun. .

Erratum in

Abstract

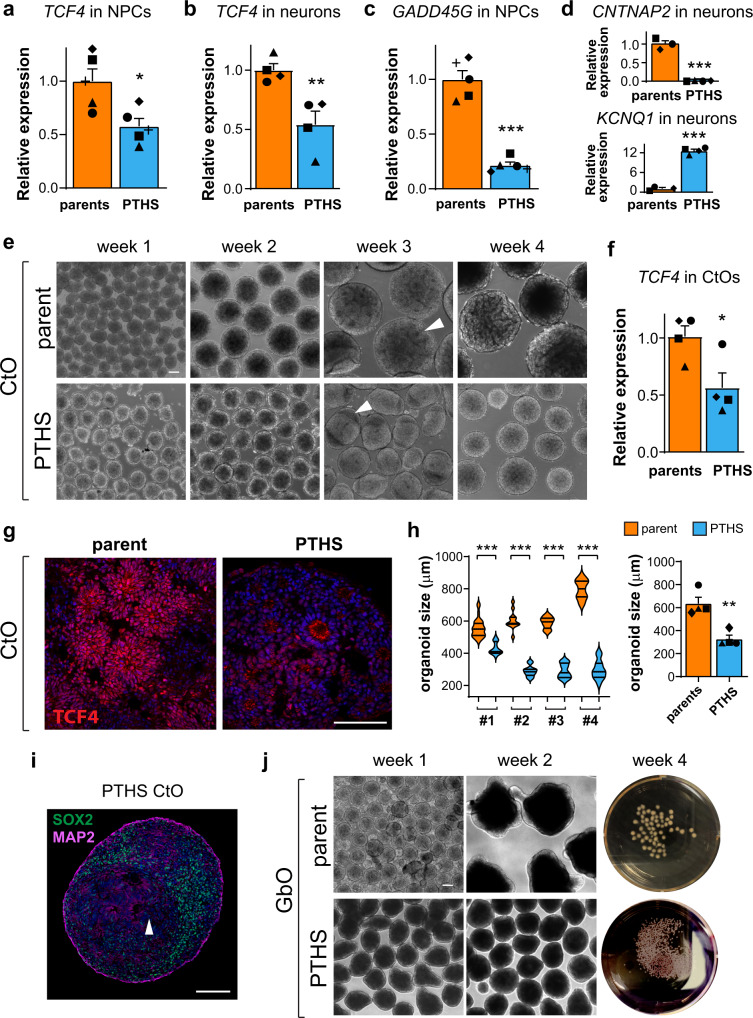
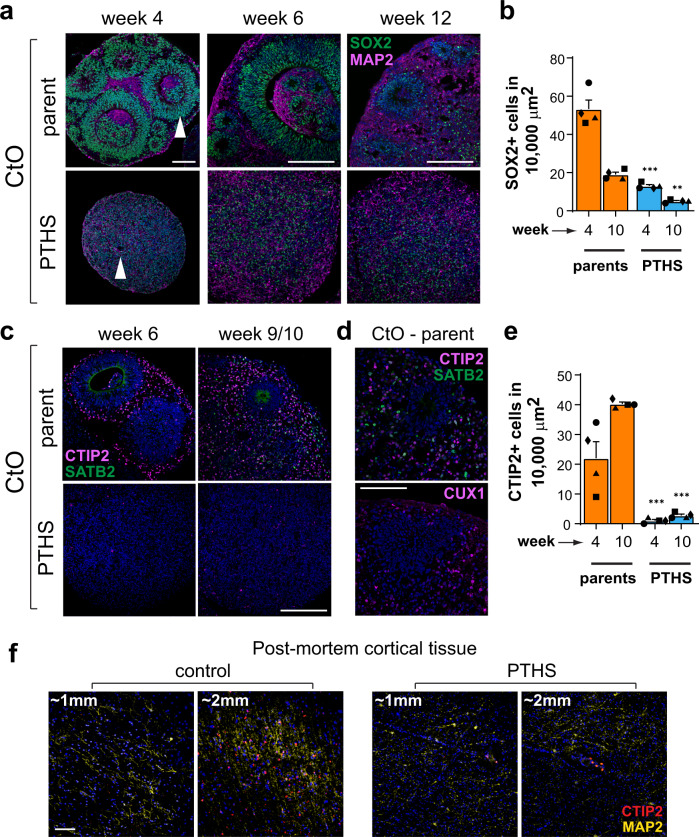
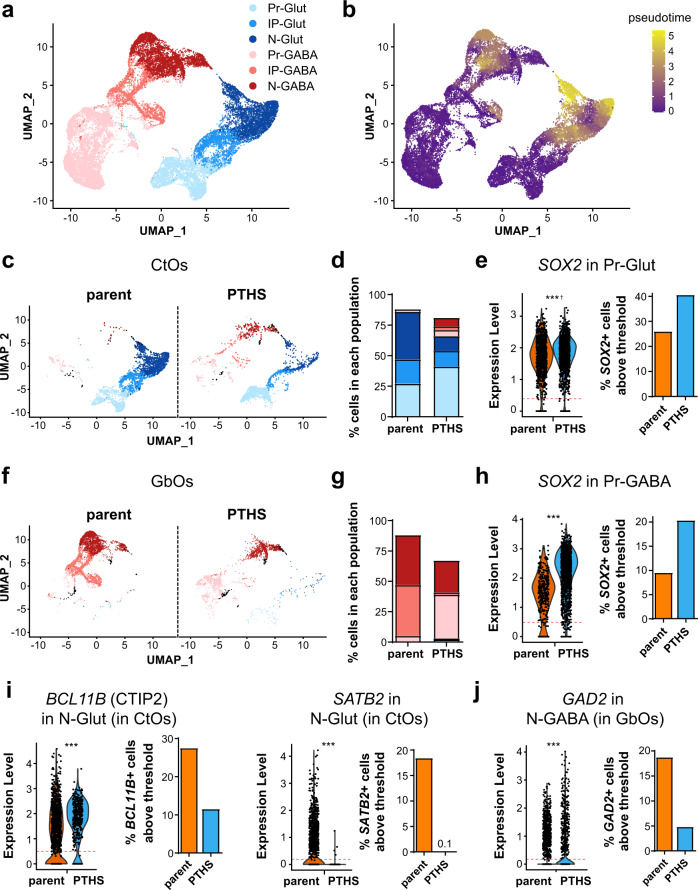
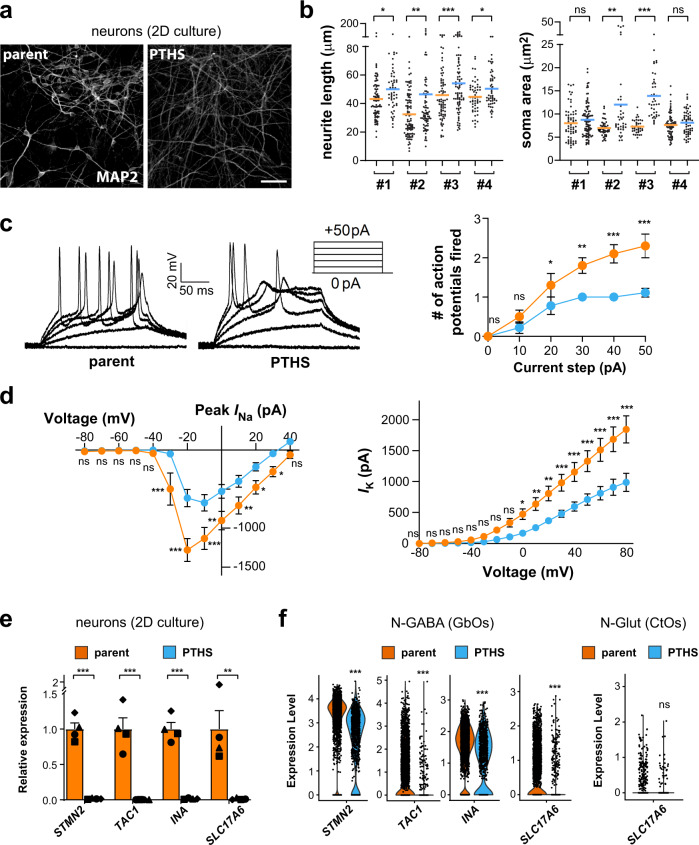
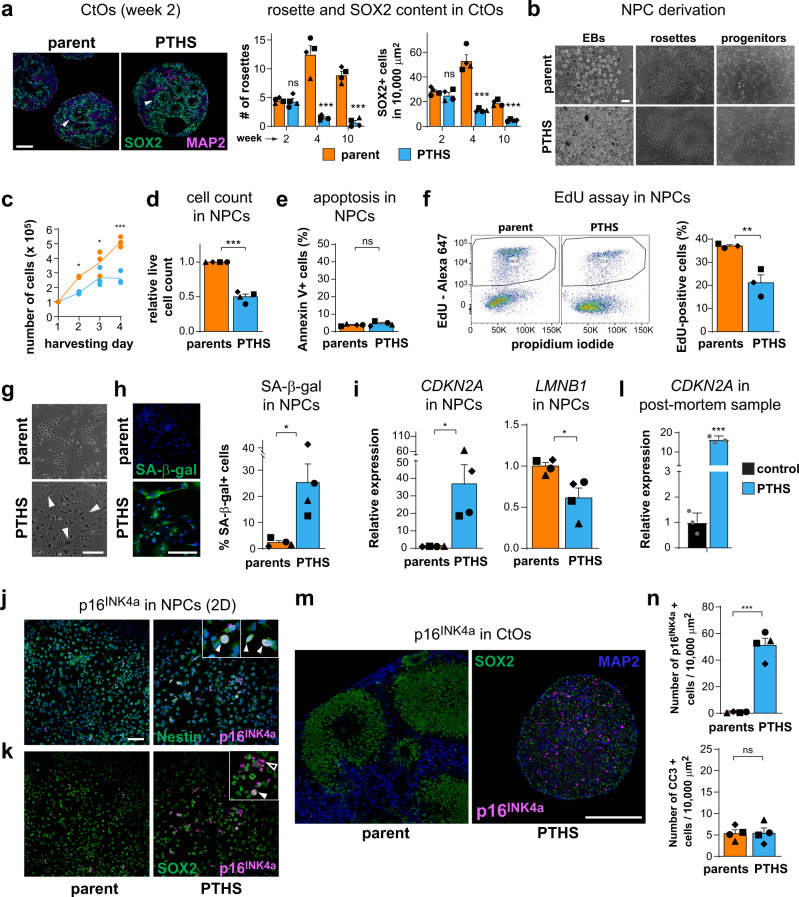
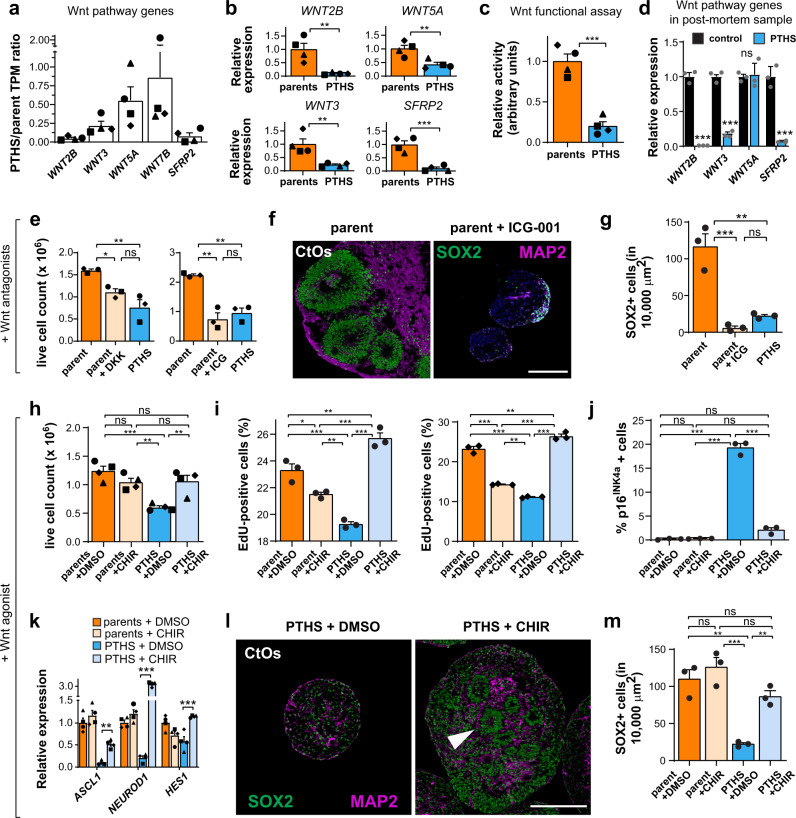
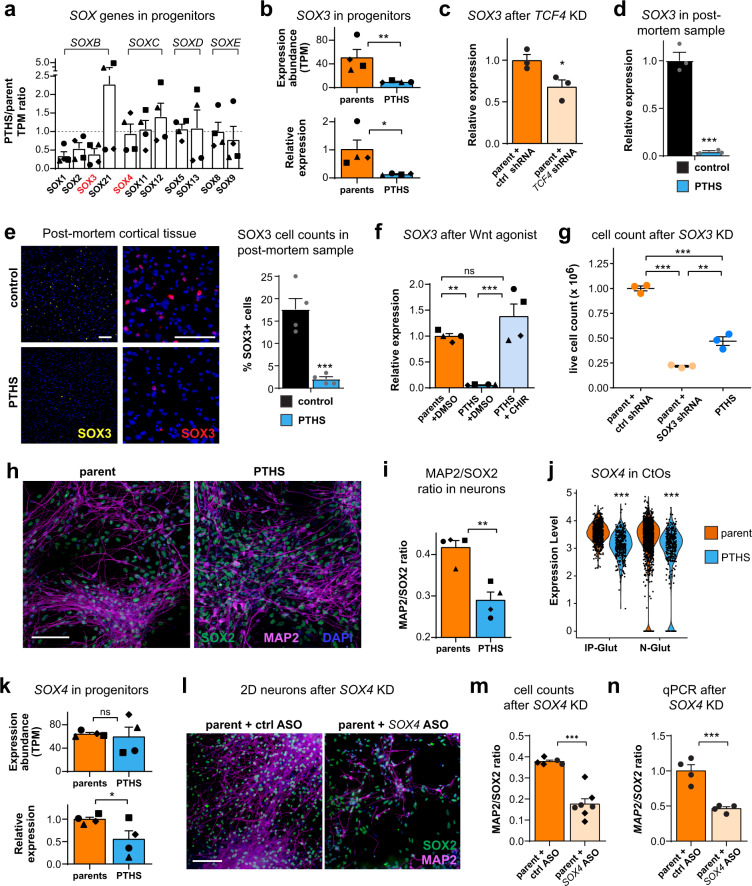
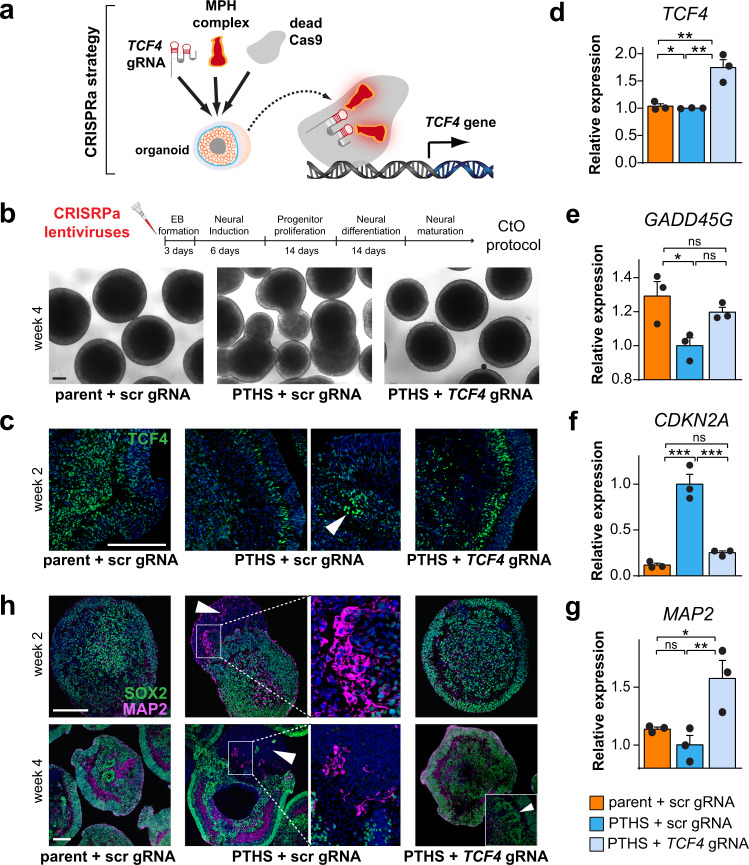
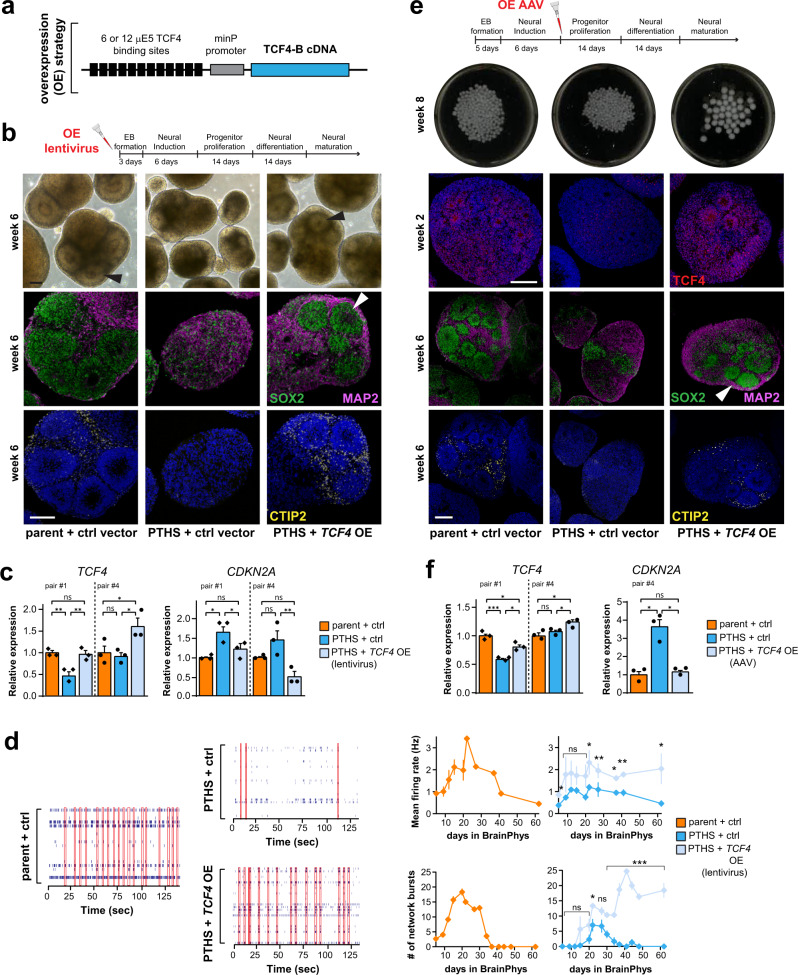
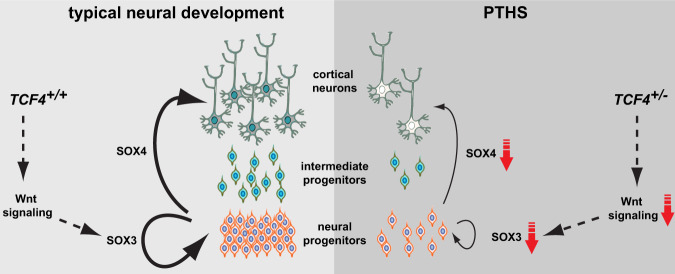
Transcription Factor 4 (TCF4) has been associated with autism, schizophrenia, and other neuropsychiatric disorders. However, how pathological TCF4 mutations affect the human neural tissue is poorly understood. Here, we derive neural progenitor cells, neurons, and brain organoids from skin fibroblasts obtained from children with Pitt-Hopkins Syndrome carrying clinically relevant mutations in TCF4. We show that neural progenitors bearing these mutations have reduced proliferation and impaired capacity to differentiate into neurons. We identify a mechanism through which TCF4 loss-of-function leads to decreased Wnt signaling and then to diminished expression of SOX genes, culminating in reduced progenitor proliferation in vitro. Moreover, we show reduced cortical neuron content and impaired electrical activity in the patient-derived organoids, phenotypes that were rescued after correction of TCF4 expression or by pharmacological modulation of Wnt signaling. This work delineates pathological mechanisms in neural cells harboring TCF4 mutations and provides a potential target for therapeutic strategies for genetic disorders associated with this gene.


Conflict of interest statement

Dr. Muotri is the co-founder of and has an equity interest in TISMOO, a company dedicated to genetic analysis and human brain organogenesis, focusing on therapeutic applications customized to autism spectrum disorders and other neurological diseases. The terms of this arrangement have been reviewed and approved by the University of California San Diego, in accordance with its conflict-of-interest policies. UCSD has filed a patent application (WO2022072709A1), in which F.P. and A.R.M. are inventors, containing some results regarding the TCF4 correction overexpression strategy described in this paper. The patent was published on 04-07-2022. Other authors declare no competing interests.

Figures

Fig. 1
Fig. 1. PTHS organoids display aberrant development.
a Relative expression (RT-qPCR) of TCF4 in parent and PTHS NPCs in 2D culture. N = 5 subjects per group (symbols; PTHS #1 to #5 in Supplementary Table 1). b Relative expression of TCF4 in parent and PTHS neurons in 2D culture, after 3 months in neuronal medium. N = 4 subjects (symbols). c Relative expression of GADD45G in parent and PTHS NPCs in 2D culture. N = 5 subjects (symbols). d Relative expression of CNTNAP2 (top) and KCNQ1 (bottom) in parent and PTHS 2D neuronal cultures. N = 3 (control) or 4 (PTHS) subjects (symbols). e Bright-field microscopy images of parent and PTHS pallial cortical organoids (CtO) over 4 weeks of culture in vitro. Arrowhead in top row shows neural rosette. Arrowhead in bottom row indicates polarized phenotype. f Relative expression of TCF4 in parent and PTHS CtOs evaluated at 4 weeks in vitro. N = 4 subjects (symbols). g Fluorescence images after TCF4 immunostaining (red) in parent and PTHS organoids at 4 weeks in vitro. h Left: CtO size distribution at 4 weeks in vitro, for 4 parent–child pairs (#1 to #4). Right: Mean CtO size at 4 weeks. N = 4 subjects per group (symbols). i Example of polarized phenotype (arrowhead) in PTHS CtO at 3 weeks in vitro after staining for SOX2 (green) and MAP2 (magenta). j Microscopy images of control and PTHS GABAergic-enriched organoids (GbOs) over 4 weeks of culture in vitro. Symbols in bar graphs indicate parent-patient identities: diamonds, pair #1; squares, pair #2; triangles, pair #3; circles, pair #4; crosses, pair #5. Colors in bar graphs and violin plots represent the parents (orange) or PTHS (blue) groups. Bar graphs represent mean + SEM. *p < 0.05, **p < 0.01, ***p < 0.001; two-sample ANOVA followed by Tukey-Kramer post-hoc test (left panel in h) or two-sample Welch’s t test assuming unequal variances (ad, f, and right panel in h). The mean expression in the parental control group was normalized to 1 in (ad and f). Blue staining is DAPI nuclear staining. Scale bars are 100 μm. See Supplementary Data 1 for statistical test results, including sample sizes, numbers of replicates, exact p-values, and effect sizes.
Fig. 2
Fig. 2. PTHS organoids display altered content of neural progenitors and cortical neurons.
a Fluorescence microscopy images of parent and PTHS CtOs at different developmental stages after immunostaining for neural progenitor marker SOX2 and neuronal marker MAP2. Arrowheads indicate rosettes. b Quantification of SOX2+ cell density (cells in 100 × 100 μm area) at two stages of CtO development. N = 4 subjects (symbols), 3 batches per subject, 6 organoids per batch, 4 random 100 ×100 μm regions of interest (ROI) per organoid. See Supplementary Fig. 2c for quantification of SOX2+ cells in GbOs. c Immunostaining of parent and PTHS CtOs for cortical neuron subtype markers CTIP2 and SATB2 at two developmental stages. d Parent CtOs at 12 weeks in vitro after immunolabeling for CTIP2, SATB2, and CUX1. e Quantification of content of cortical neurons expressing CTIP2, at two stages of CtO development. N = 4 subjects (symbols), 3 batches per subject, 6 organoids per batch, 4 random ROIs per organoid. See Supplementary Fig. 2e for quantification of SATB2+ cells in CtOs. f Immunostaining for CTIP2 and MAP2 on post-mortem PTHS brain cortex tissue. Two ROIs are shown, at 2 mm cortical depth (equivalent to layer V in the control) and at 1 mm depth (equivalent to layer III). See Supplementary Fig. 2i for quantification of CTIP2+ cells at various cortical depths. Symbols in bar graphs indicate parent-patient identities: diamonds, pair #1; squares, pair #2; triangles, pair #3; circles, pair #4. Colors in bar graphs represent the parents (orange) or PTHS (blue) groups. Bar graphs represent mean + SEM. **p < 0.01, ***p < 0.001; one-way ANOVA followed by Tukey–Kramer’s HSD post-hoc test (b and e). Blue staining is DAPI nuclear staining. Scale bars are 100 μm. See Supplementary Data 1 for sample and effect sizes and exact p-values.
Fig. 3
Fig. 3. PTHS organoids have increased percentage of neural progenitors and decreased percentage of neurons.
a Uniform Manifold Approximation and Projection (UMAP) bidimensional reduction of scRNA-Seq profiling of CtOs and GbOs at 8 weeks in vitro, integrating data from eight libraries: 3 libraries of parent #4 CtOs and 1 library each of PTHS #4 CtOs, parent #4 GbOs, PTHS #4 GbOs, CHIR99021-treated PTHS #4 CtOs, and CHIR99021-treated PTHS #4 GbOs, with pooled cells from 15 organoids per library. Color code represents 6 annotated subpopulations: Pr-Glut: neural progenitors in glutamatergic lineage; IP-Glut: intermediate progenitors in glutamatergic lineage; N-Glut: glutamatergic neurons; Pr-GABA: neural progenitors in inhibitory lineage; IP-GABA: intermediate progenitors in inhibitory lineage; N-GABA: neuronal population containing GABAergic interneurons. Minority subpopulations exist (‘Others’ in Supplementary Fig. 3) but were not the focus of our study. b Trajectory analysis indicating the existence of separate cell differentiation lineages in CtOs and GbOs. c Diversity of cell types (color-coded as in a) between parent and PTHS CtOs at 8 weeks in vitro. Black dots represent ‘Others’ group. d Percentages of cells in each CtO subpopulation (color code as in a). See Supplementary Table 2 for ‘Others’ and apoptotic subpopulations. e Left: Log-transformed expression abundance of SOX2 (per cell basis) in the Pr-Glut subpopulation of CtOs; each dot represents a single cell. Right: Percentages of cells expressing SOX2 above threshold (red line in violin plot, corresponding to 40% of overall average SOX2 expression; see “Methods” for details). N = 959 (parent) and 1230 (PTHS) cells. f Diversity of cell types between parent and PTHS GbOs at 8 weeks in vitro. g Percentages of cells in each GbO subpopulation (color code as in a). h Left: Expression of SOX2 in Pr-GABA cells of GbOs. Right: Percentages of SOX2+ cells above threshold (red line). N = 346 (parent) and 1376 (PTHS) cells. i, j Expression of CTIP2 and SATB2 (i) or GAD2 (j) in N-Glut cells of CtOs (i) or N-GABA cells of GbOs (j). N = 1401 (parent) and 380 (PTHS) N-Glut (i), or N = 2661 (parent) and 988 (PTHS) N-GABA cells (j). Data are from scRNA-Seq analysis of parent #4 and PTHS #4 samples. ***p < 0.001; Kruskal–Wallis H test (left panels in e, h, i, and j). Cross symbol indicates that mean expression log2 fold change is lower than 0.5. Colors in bar graphs (except in d and g) and violin plots represent the parent (orange) or PTHS (blue) groups.
Fig. 4
Fig. 4. PTHS neurons exhibit abnormal electrophysiological properties and gene-expression program.
a Neurons in 2D culture (3 months in neuronal medium) after MAP2 immunostaining (white). b Neurite length and soma area quantification in parent and PTHS neurons in 2D culture. N = 4 patients and respective controls (#1 to #4 pairs indicated below the graphs); 37-94 neurons per group (dots). Means are indicated by the colored lines. c Patch-clamp electrophysiological interrogation of parent and PTHS neurons, showing reduction in spike rate in PTHS neurons after 3 months in neuronal medium (right). Representative traces are shown on the left. N = 10 (parent) or 9 (PTHS) neurons from pair #4. d Sodium (left) and potassium (right) currents in parent (orange) and PTHS (blue) neurons. N = 10 (parent) or 9 (PTHS) neurons. e Relative expression (RT-qPCR) of selected neuronal genes in neurons in 2D culture (2 months in neuronal medium). N = 4 subjects per group (symbols). These genes were selected among the most differentially expressed in N-Glut and N-GABA neurons between parent and PTHS organoids (see Supplementary Data 3 for list of DE genes). f Left: Expression of the same genes shown in (e) in neurons of GbOs, at 8 weeks in vitro. N = 2661 (parent) and 988 (PTHS) cells. Right: For comparison with GbOs, the expression of SLC17A6 (vGLUT2) in CtO neurons is also shown. N = 1401 (parent) and 380 (PTHS). Cells are from pair #4. Symbols in bar graphs indicate parent-patient identities: diamonds, pair #1; squares, pair #2; triangles, pair #3; circles, pair #4. Colors in the figure represent parent (orange) or PTHS (blue) groups. Bar graphs represent mean + SEM. n.s., not statistically significantly different, *p < 0.05, **p < 0.01, ***p < 0.001; one-way ANOVA with Geisser-Greenhouse correction for repeated measures followed by LSD post-hoc test (b), one-way ANOVA followed by HSD post-hoc test (c and d), two-sample Welch’s t test (e), or Kruskal–Wallis H test (f). Scale bar is 100 μm. See Supplementary Data 1 for sample and effect sizes and exact p-values.
Fig. 5
Fig. 5. PTHS neural progenitors proliferate at a lower rate.
a Left: CtOs at 2 weeks in vitro after staining for SOX2 and MAP2. Arrowheads mark neural rosettes. Middle: Number of rosettes in parent and PTHS CtOs at different organoid developmental stages in vitro. Right: Density of SOX2+ cells in CtOs. N = 4 parent–patient pairs (symbols). b Derivation of NPCs from iPSCs. c Example of growth curves for NPCs in 2D culture, for parent #4 (orange) and PTHS #4 (blue). N = 3 experiments (replicates) per time point. d Live cell counts for parent and PTHS NPCs in 2D culture. N = 4 pairs (symbols). e Quantification of Annexin V+ (apoptotic) NPCs in 2D culture. N = 4 pairs (symbols). f Left: Representative assessment of EdU+ (dividing) NPCs in 2D culture, for pair #1. Right: Percentage of EdU+ NPCs in parent and PTHS 2D cultures. N = 3 pairs (symbols). g Flat enlarged cells (arrowheads) in PTHS NPC 2D culture. h Left: Staining for senescence-associated β-galactosidase (SA-β-gal) activity (green) in NPCs in 2D culture (quantification on the right). N = 4 pairs (symbols). i Relative expression of CDKN2A (left) and LMNB1 (right) in NPCs in 2D culture. N = 4 pairs (symbols). j Immunostaining of parent and PTHS NPCs for Nestin (green) and p16INK4a (magenta; colocalization in insets). k Immunostaining of parent and PTHS NPCs for SOX2 and p16INK4a (filled arrowhead: colocalization; open arrowhead: absence of co-staining). l Relative expression of CDKN2A in post-mortem PTHS brain cortex sample (PTHS #6). N = 3 replicates per group. m Immunostaining of parent and PTHS CtOs for SOX2 (green), MAP2 (blue), and senescence marker p16INK4a (magenta), at 6 weeks in vitro. n Quantification of p16INK4a+ (top) and apoptotic (Cleave Caspase 3, CC3+; bottom) cells in CtOs at 6 weeks in vitro. N = 4 pairs (symbols). Symbols in bar graphs indicate parent-patient identities: diamonds, pair #1; squares, pair #2; triangles, pair #3; circles, pair #4; gray dots, post-mortem samples. Colors in bar and line graphs represent parents (orange), PTHS (blue), or control post-mortem sample (black) groups. Bar graphs represent mean + SEM. n.s. = not significant. *p < 0.05, **p < 0.01, ***p < 0.001; one-way ANOVA (c) or two-sample Welch’s t test in remaining comparisons. DAPI nuclear staining in blue (except in m). Scale bars are 100 μm. See Supplementary Data 1 for sample and effect sizes and exact p-values.
Fig. 6
Fig. 6. Manipulation of Wnt signaling rescues proliferation of PTHS neural progenitors.
a Ratio of TPM expression abundances for selected Wnt genes between parent and PTHS NPCs in 2D culture. N = 4 parent–child pairs (symbols). b Relative expression of Wnt genes in NPCs. N = 4 pairs (symbols). c Reduced Wnt signaling activity in PTHS NPCs in 2D culture (TOP-Flash assay). N = 4 pairs (symbols). d Relative expression of selected Wnt genes in post-mortem PTHS cortex sample (PTHS #6). N = 3 replicates per group. e Treatment of control NPCs with Wnt pathway antagonists DKK-1 and ICG-001 (yellow bars) phenocopies proliferation deficit in PTHS progenitors. N = 3 pairs (symbols). f Parent CtOs at 4 weeks in vitro after treatment with ICG-001, stained for SOX2 and MAP2. g ICG-001 treatment of CtOs phenocopies low neural progenitor content (SOX2) of PTHS organoids. N = 3 replicates (circles) with pair #4 cells. h Live cell count after treatment of NPCs in 2D culture with Wnt pathway agonist CHIR99021. N = 4 pairs (symbols). i EdU assay in NPCs treated with CHIR99021. Left graph represents data for pair #4, and right graph shows data for pair #1. N = 3 replicates. j Quantification of p16INK4a+ (senescent) cells in NPCs in 2D culture treated with CHIR99021. Data shown are for pair #4 (see graph in Supplementary Fig. 8g for pair #1). N = 3 replicates. k CHIR99021 rescues expression of proliferation genes in treated PTHS NPCs in 2D culture. N = 4 pairs (symbols). See pairwise comparisons in Supplementary Data 1. l PTHS CtOs at 4 weeks in vitro after treatment with CHIR99021, showing marked increase in abundance of NPCs (SOX2; green) and neurons (MAP2) as well as reappearance of neural rosettes (arrowhead). m Quantification of SOX2+ cells after treatment of PTHS CtOs with CHIR99021. N = 3 replicates (circles) with PTHS #4 cells. Symbols in bar graphs indicate parent-patient identities: diamonds, pair #1; squares, pair #2; triangles, pair #3; circles, pair #4; gray dots, post-mortem samples. Colors in bar graphs represent parents (orange), pharmacologically treated parents (yellow), PTHS (blue), pharmacologically treated PTHS (light blue), or control post-mortem sample (black) groups. Bar graphs represent mean + SEM. n.s., not significant; *p < 0.05, **p < 0.01, ***p < 0.001; two-sample Welch’s t test (in bd) or one-way ANOVA followed by Tukey’s HSD post-hoc test in remaining panels. Scale bars are 100 μm. See Supplementary Data 1 for sample and effect sizes and exact p-values.
Fig. 7
Fig. 7. Aberrant expression of SOX genes in PTHS cells and organoids.
a Ratio of TPM abundances for SOX genes in NPCs in 2D culture. N = 4 pairs (symbols). SOX gene subfamilies are shown above. b Top: SOX3 TPM expression in NPCs. Bottom: SOX3 relative expression (RT-qPCR). N = 4 pairs (symbols). c SOX3 is downregulated after TCF4 knockdown in NPCs in 2D culture. N = 3 replicates (circles), with parent #4 cells. d SOX3 relative expression in post-mortem PTHS cortex sample (PTHS #6). N = 3 replicates per group. e Left: Immunostaining for SOX3 in post-mortem PTHS cortex sample (higher magnification images on the right, showing colocalization with DAPI). Right: Quantification of SOX3+ cells in post-mortem PTHS sample. N = 4 sections per group. f Treatment of PTHS NPCs in 2D culture with CHIR99021 rescues SOX3 expression. N = 4 pairs (symbols). g SOX3 knockdown reduces NPC proliferation in 2D culture. N = 3 replicates (circles), with pair #4 cells. h Immunostaining for SOX2 and MAP2 in neurons in 2D culture (2 months in neuronal medium). i Ratio between neurons (MAP2+) and NPCs (SOX2+) in neuronal 2D cultures. N = 4 pairs (symbols). j SOX4 expression is reduced in IP-Glut and N-Glut cells of PTHS CtOs at 8 weeks in vitro. N = 717 (parent) and 382 (PTHS) IP-Glut cells, or 1401 (parent) and 380 (PTHS) N-Glut neurons from pair #4. k SOX4 expression is reduced in PTHS NPCs in 2D culture. Top: TPM expression. Bottom: Relative expression (RT-qPCR). N = 4 pairs (symbols). l Immunostaining for SOX2 and MAP2 in differentiating neuronal 2D cultures after SOX4 knockdown (2 months in neuronal medium). m Ratio between MAP2+ and SOX2+ after SOX4 knockdown in differentiating neuronal 2D cultures. N = 6 (parent) or 7 (PTHS) replicates, with cells from pairs #1 and #4 (symbols). n Ratio between MAP2 and SOX2 gene-expression levels after SOX4 knockdown in differentiating neuronal 2D cultures. N = 4 replicates, with cells from pair #4. Symbols in bar graphs indicate parent-patient identities: diamonds, pair #1; squares, pair #2; triangles, pair #3; circles, pair #4; gray dots, post-mortem samples. Colors in bar graphs, dot or violin plots represent parents (orange), genetically manipulated parents (yellow), PTHS (blue), pharmacologically treated PTHS (light blue), or control post-mortem sample (black) groups. Bar graphs represent mean + SEM. n.s., not significant; *p < 0.05; **p < 0.01; ***p < 0.001; one-way ANOVA (f, g), Kruskal–Wallis H test (j), or two-sample Welch’s t test in remaining panels. Scale bars are 100 μm. DAPI nuclear staining in blue. See Supplementary Data 1 for sample and effect sizes and exact p-values.
Fig. 8
Fig. 8. Reversal of abnormal phenotypes in PTHS organoids after trans-epigenetic correction of TCF4 expression.
a Schematic representation of CRISPR-based trans-epigenetic correction of TCF4 expression using constructs for guide RNA (gRNA), transcriptional activation module MPH, and dead Cas9 (see “Methods” for details). b Top: Virus application regimen. Bottom: Brightfield images of PTHS brain organoids at 4 weeks in vitro after correction of TCF4 expression (PTHS + TCF4 gRNA), compared with controls transduced with scrambled gRNA (scr gRNA). c Fluorescence microscopy images of transduced organoids at 2 weeks in vitro after immunostaining for TCF4 (green). Clustered TCF4+ cells (arrowhead) can be seen in aberrant outgrowth in image on the right in PTHS + scr gRNA condition. See Supplementary Fig. 12d, e for quantification of number of TCF4+ cells and mean TCF4 staining pixel intensity in transduced organoids. d Increase in TCF4 expression levels after CRISPR-mediated trans-epigenetic TCF4 correction in organoids at 2 weeks in vitro. N = 3 replicates per group (circles). eg Expression levels of GADD45G (e), CDKN2A (f), and MAP2 (g) in organoids at 4 weeks in vitro after trans-epigenetic TCF4 expression correction. N = 3 replicates per group (circles). Organoids are from parent–patient pair #4. h Transduced organoids stained for MAP2 (magenta) and SOX2 (green), at two developmental time points. Arrowheads in middle panels: polarized PTHS organoids. High mag insets: clustered abnormally shaped MAP2+ cells in polarized organoid outgrowth. Arrowhead in right panel: neural rosettes. Experiments were conducted with organoids from parent-patient pair #4 (circle symbols in bar graphs). Colors in bar graphs represent parents (orange), PTHS (blue), or genetically manipulated PTHS (light blue) groups. Error bars represent SEM. n.s., not significant; *p < 0.05; **p < 0.01; ***p < 0.001; one-way ANOVA followed by Tukey’s HSD post-hoc test in bar plots. Scale bars are 100 μm. DAPI nuclear staining in blue. See Supplementary Data 1 for sample and effect sizes and exact p-values. Attribution of DNA image in a: Ioana Davies/Shutterstock.com.
Fig. 9
Fig. 9. Reversal of PTHS abnormal phenotypes after TCF4 over-expression in organoids.
a Over-expression construct, with TCF4-B under the control of varying numbers of TCF4 binding sites (μE5 boxes). b Top: Virus application regimen. Bottom: Microscopy images showing general morphology of CtOs at 6 weeks in vitro after transduction with TCF4 OE vector or a control vector (ctrl; see “Methods” for details) (first line), immunostaining for SOX2 and MAP2 (second line), and immunostaining for CTIP2 (third line). Arrowhead: neural rosette. c Relative expression (RT-qPCR) of TCF4 and CDKN2A in CtOs subjected to lentivirus-mediated TCF4 OE at the beginning of the derivation protocol and evaluated at 2 weeks in vitro. N = 3 biological replicates per subject, with organoids from parent-patient pairs #1 and #4. See Supplementary Fig. 13c for densities of SOX2+ and CTIP2+ cells. d Left: Raster plots showing electrical activity of transduced CtOs (parent-patient pair #1) at 2 to 3 months in vitro subjected to multi-electrode array (MEA) analysis. Each row of spikes represents an electrode. Vertical red rectangles represent events of network bursts of electrical activity. Right: Quantification of mean firing rate (top) in transduced organoids (see Supplementary Fig. 13d for raster plots), and number of network bursts (bottom). N = 3 independent replicates per group, 10 seeded organoids per replicate/group. e Top: Virus application regimen. Bottom: Fluorescence microscopy images of transduced CtOs after immunostaining for TCF4 (first line; 2 weeks in vitro), SOX2 and MAP2 (second line; 6 weeks in vitro), or CTIP2 (third line; 6 weeks in vitro). Arrowhead, neural rosette. f Top: Relative expression of TCF4 and CDKN2A in CtOs subjected to AAV-mediated TCF4 OE after the end of the neural induction phase and evaluated at 2 weeks in vitro. N = 3 replicates per subject, for organoids from parent/child pairs #1 or #4. See Supplementary Fig. 13f for densities of SOX2+ and CTIP2+ cells. Symbols in bar graphs indicate parent-patient identities: diamonds, pair #1; circles, pair #4. Colors in bar and line graphs represent parents (orange), PTHS (blue), or genetically manipulated PTHS (light blue) groups. Error bars represent SEM. ns, non-significant; *p < 0.05; **p < 0.01; ***p < 0.001; one-way ANOVA followed by Tukey’s HSD post-hoc test. Scale bars are 100 μm. DAPI nuclear staining in blue. See Supplementary Data 1 for sample and effect sizes and exact p-values.
Fig. 10
Fig. 10. Model of dysregulated pathways underlying PTHS pathophysiology.
Mechanistic model to explain aberrant cellular phenotypes in PTHS neural structures. Due to TCF4 loss-of-function in PTHS, Wnt signaling activity diminishes, in turn leading to decreased SOX3 expression in NPCs, impairing proliferation. Moreover, we observed that SOX4 is also downregulated in PTHS cells, which we suggest impairs neuronal differentiation and content in the PTHS neural tissue.

References

    1. Kim, H., Berens, N. C., Ochandarena, N. E. & Philpot, B. D. Region and cell type distribution of TCF4 in the postnatal mouse brain. Front. Neuroanat. 14, (2020). - PMC - PubMed
    1. de Pontual, L. et al. Mutational, functional, and expression studies of the TCF4 gene in Pitt-Hopkins syndrome. Hum. Mutat.30, 669–676 (2009). - PubMed
    1. Jung, M. et al. Analysis of the expression pattern of the schizophrenia-risk and intellectual disability gene TCF4 in the developing and adult brain suggests a role in development and plasticity of cortical and hippocampal neurons. Mol. Autism9, 1–15 (2018). - PMC - PubMed
    1. Sepp, M., Kannike, K., Eesmaa, A., Urb, M. & Timmusk, T. Functional diversity of human basic helix-loop-helix transcription factor TCF4 isoforms generated by alternative 5′ exon usage and splicing. PLoS ONE6, e22138 (2011). - PMC - PubMed
    1. Chen, E. S. et al. Molecular convergence of neurodevelopmental disorders. Am. J. Hum. Genet.95, 490–508 (2014). - PMC - PubMed

Publication types