. 2022 May;25(5):596-606.
doi: 10.1038/s41593-022-01052-2. Epub 2022 May 2.

Maladaptive myelination promotes generalized epilepsy progression

Affiliations

Maladaptive myelination promotes generalized epilepsy progression

Juliet K Knowles et al. Nat Neurosci. 2022 May.

Abstract

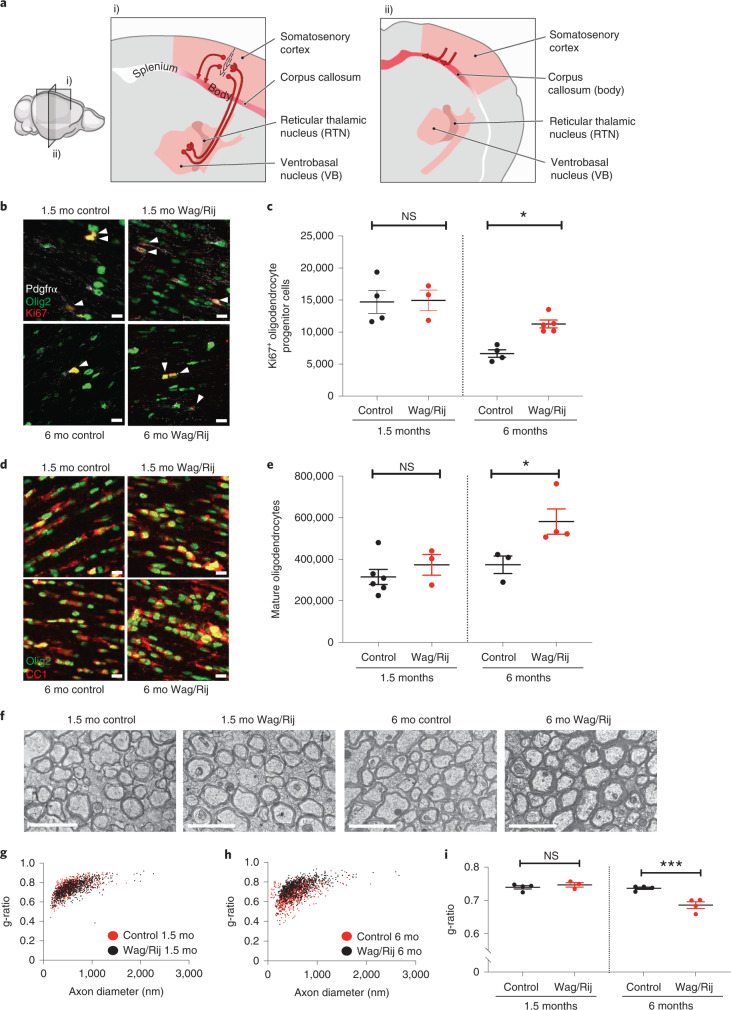
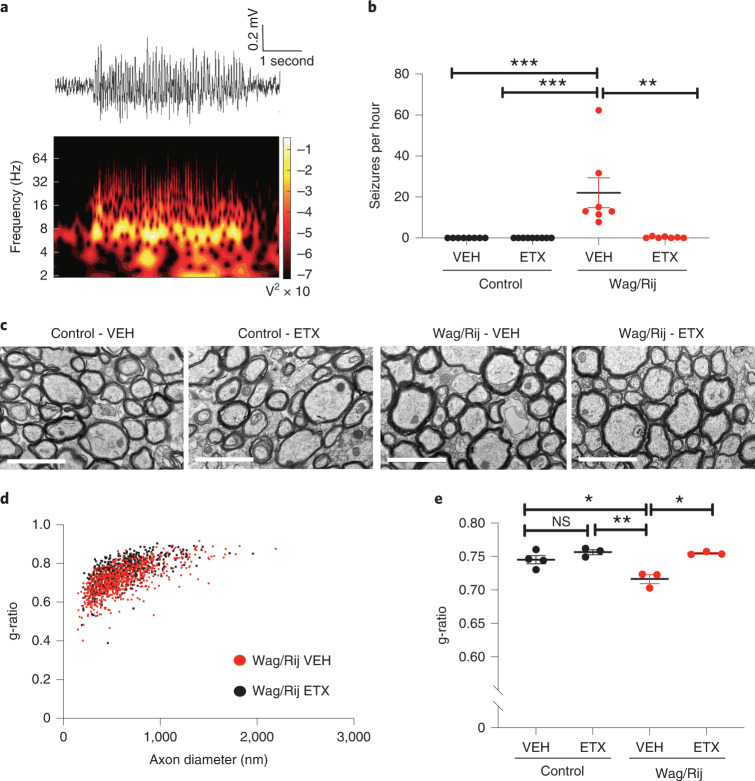
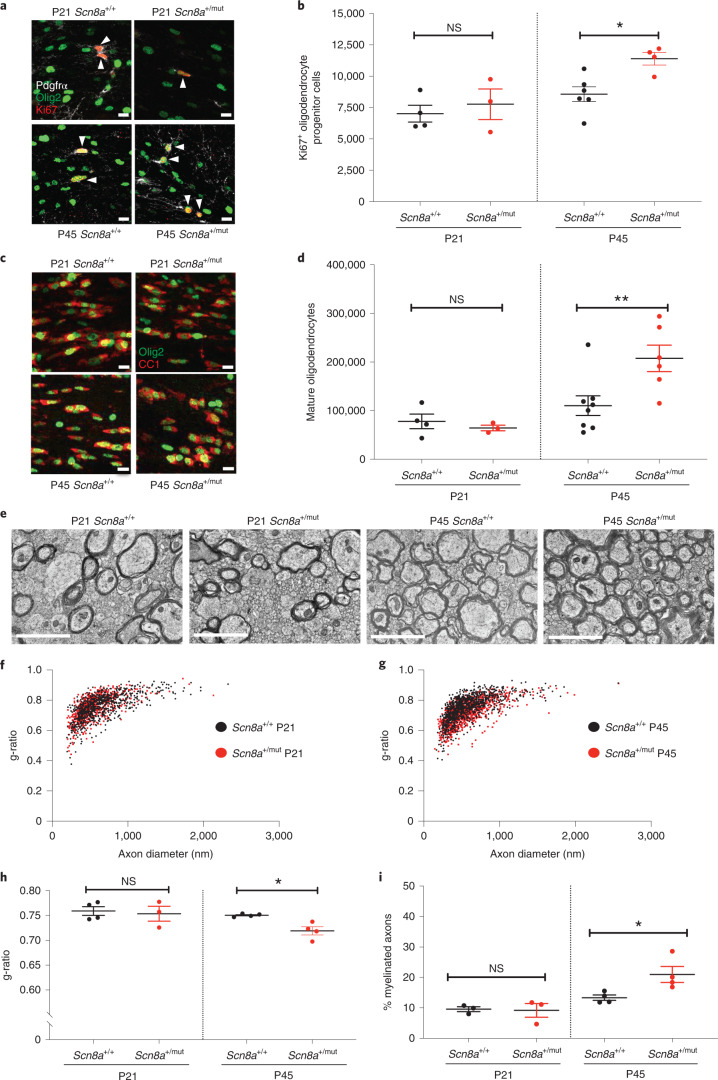
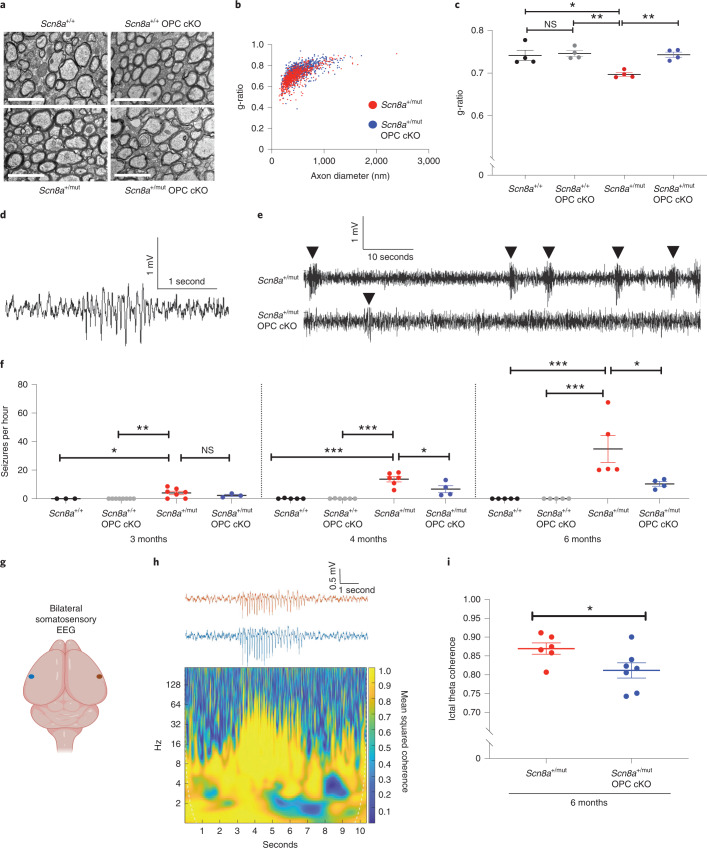
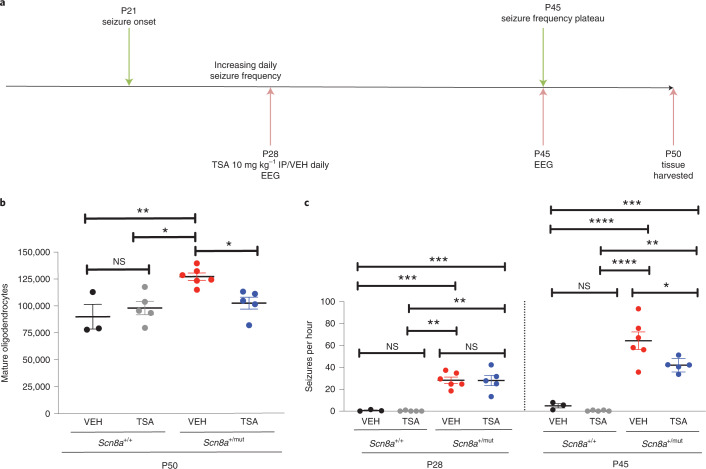
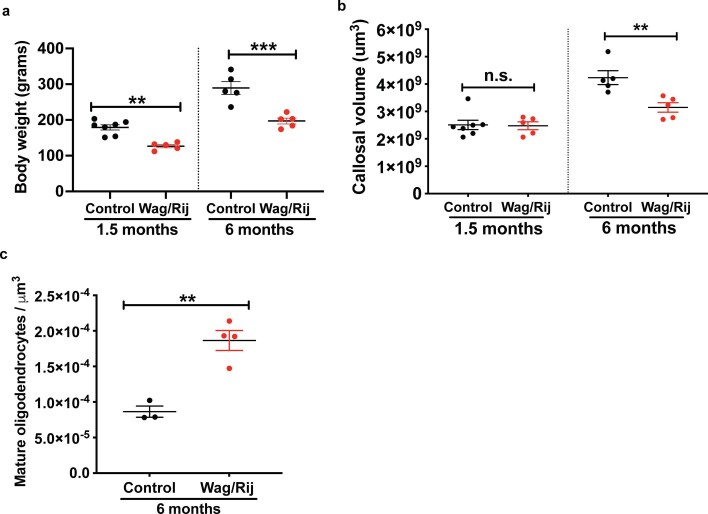
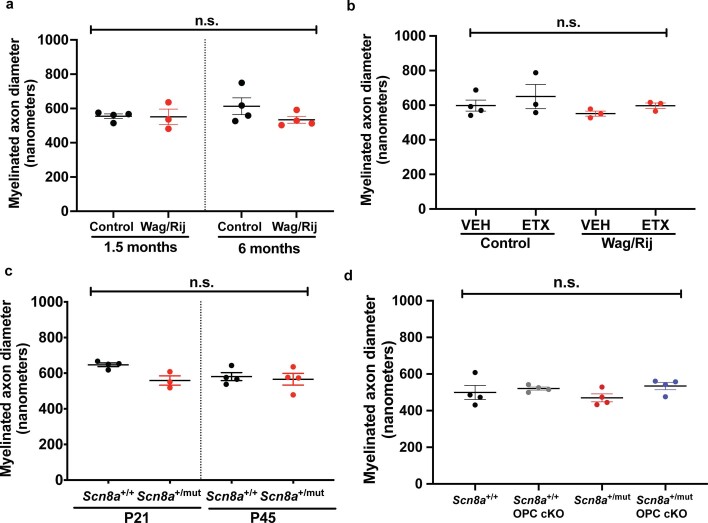
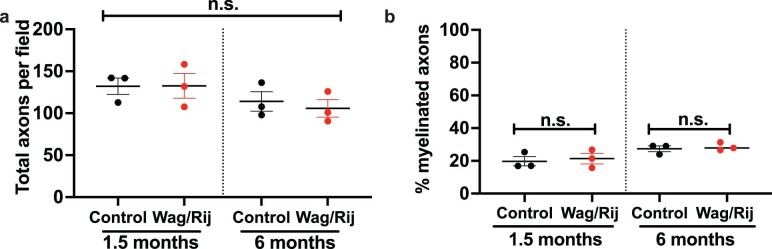
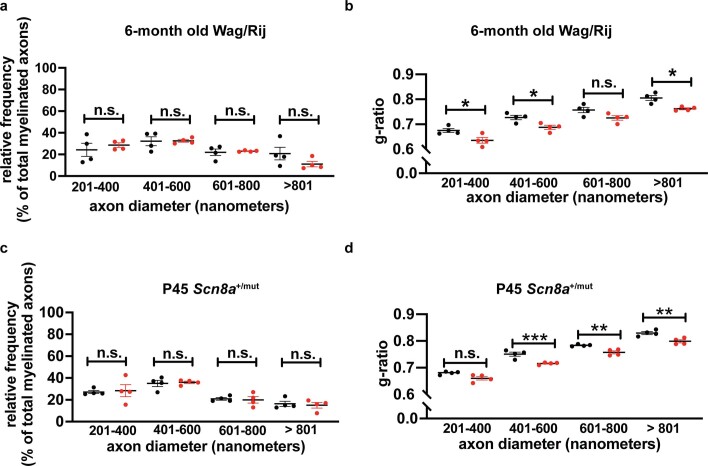
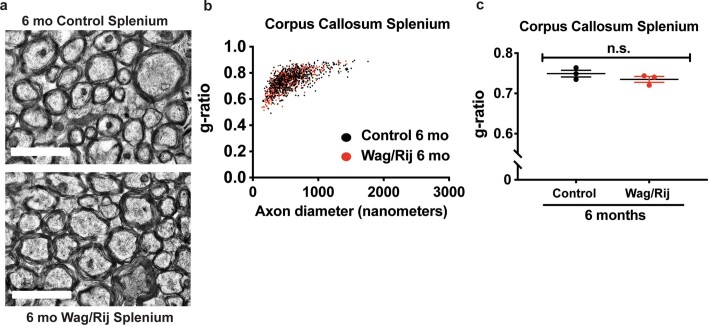
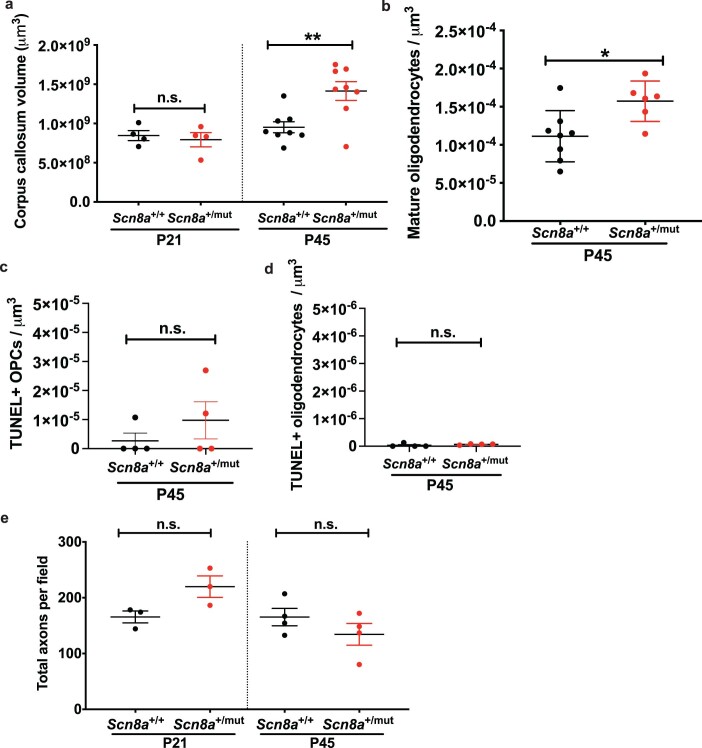
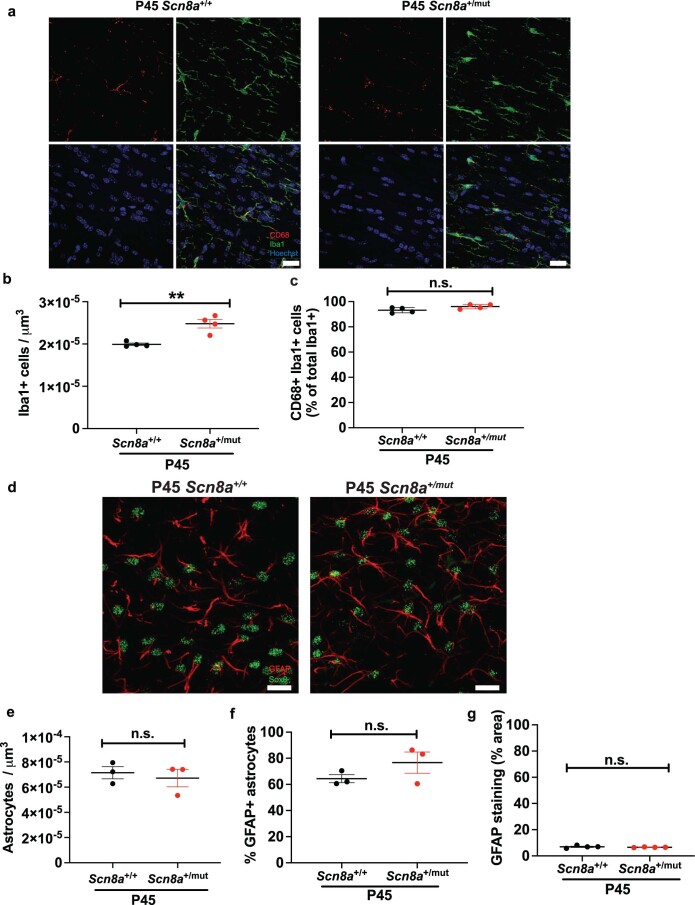
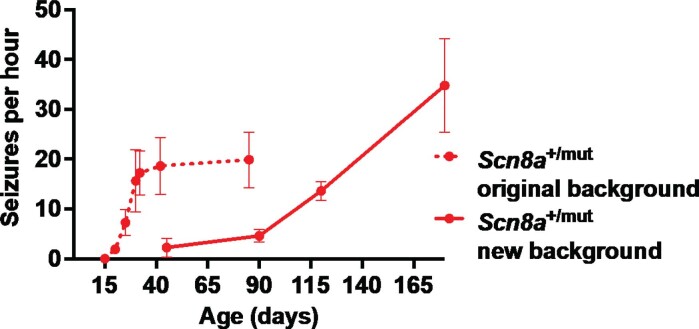
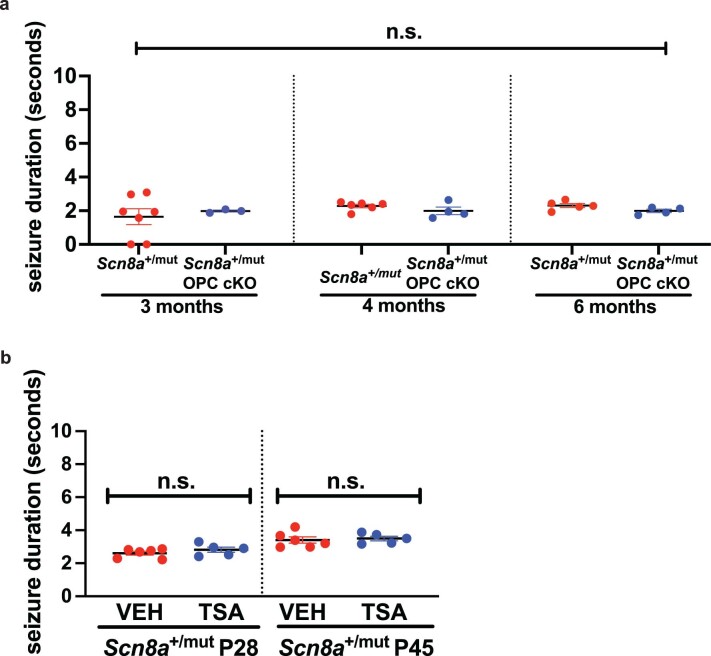
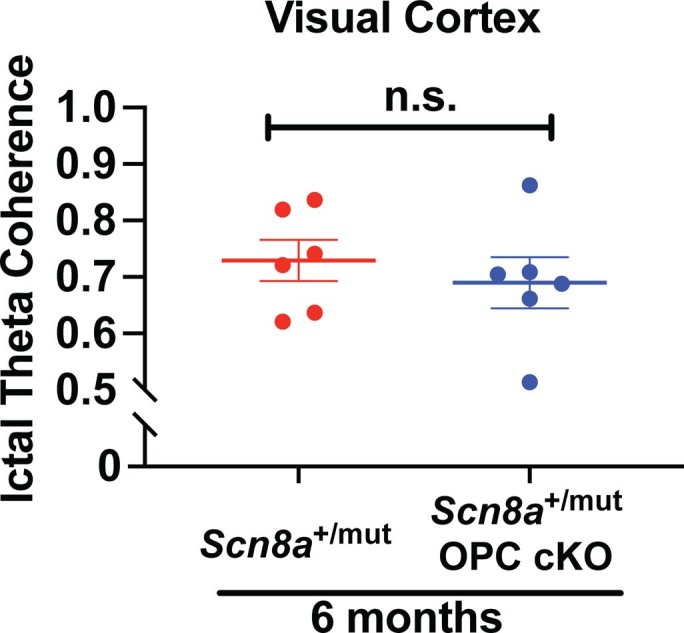
Activity-dependent myelination can fine-tune neural network dynamics. Conversely, aberrant neuronal activity, as occurs in disorders of recurrent seizures (epilepsy), could promote maladaptive myelination, contributing to pathogenesis. In this study, we tested the hypothesis that activity-dependent myelination resulting from absence seizures, which manifest as frequent behavioral arrests with generalized electroencephalography (EEG) spike-wave discharges, promote thalamocortical network hypersynchrony and contribute to epilepsy progression. We found increased oligodendrogenesis and myelination specifically within the seizure network in two models of generalized epilepsy with absence seizures (Wag/Rij rats and Scn8a+/mut mice), evident only after epilepsy onset. Aberrant myelination was prevented by pharmacological seizure inhibition in Wag/Rij rats. Blocking activity-dependent myelination decreased seizure burden over time and reduced ictal synchrony as assessed by EEG coherence. These findings indicate that activity-dependent myelination driven by absence seizures contributes to epilepsy progression; maladaptive myelination may be pathogenic in some forms of epilepsy and other neurological diseases.


Conflict of interest statement

M.M. is on the Scientific Advisory Board of Cygnal Therapeutics. The authors declare no other competing interests.

Figures

Fig. 1
Fig. 1. Increased oligodendrogenesis and myelination within the absence seizure network after epilepsy onset in Wag/Rij rats.
a, Sagittal (i) and coronal (ii) views of the absence seizure network (pink/red). Absence seizures are maximal in ventrobasal and reticular thalamic nuclei and somatosensory cortices and propagate across the corpus callosum body, with little involvement of occipital cortices and corpus callosum splenium. Illustration by Sigrid Knemeyer at SciStories. b, Representative photomicrographs of dividing callosal OPCs expressing Olig2 (green), PDGFRα (white) and Ki67 (red), indicated with arrowheads. Scale bars, 10 μm. c, Total Ki67+ OPCs at 1.5 months and 6 months in control and Wag/Rij rats. 1.5 months, n = 4 control and 3 Wag/Rij rats; 6 months, n = 4 control and 5 Wag/Rij rats. One-way ANOVA: F3,12 = 10.43, P = 0.0012. Post hoc Sidak’s test comparing Ki67+ OPCs in Wag/Rij versus controls at 6 months: P = 0.025, and at 1.5 months: P = 0.99. d, Representative photomicrographs of callosal mature oligodendrocytes of 1.5-month-old and 6-month-old control or Wag/Rij rats, co-expressing Olig2 (green) and CC1 (red). Scale bars, 10 μm. e, Total callosal oligodendrocytes in control and Wag/Rij rats. 1.5 months, n = 6 control and 3 Wag/Rij rats; 6 months, n = 3 control and 4 Wag/Rij rats. One-way ANOVA: F3,12 = 6.558, P = 0.0071. Post hoc Sidak’s test comparing oligodendrocyte quantity in 6-month-old Wag/Rij rats versus controls: P = 0.029; 1.5-month-old: P = 0.65. f, Representative transmission electron micrographs of axon cross-sections in the mid-sagittal corpus callosum body. Scale bar, 2 μm. Scatter plots of individual axon g-ratios from 1.5-month-old (g) and 6-month-old (h) rats; each dot represents the g-ratio of one axon. i, Mean g-ratios for each rat; 1.5 months: n = 4 control and 3 Wag/Rij rats; 6 months: n = 4 control and 4 Wag/Rij rats. One-way ANOVA, F3,11 = 17.09, P = 0.0002. Post hoc Sidak’s test, control versus Wag/Rij at 1.5 months, P = 0.72, and 6 months, P = 0.0004. Each dot represents one rat (c, e, i); data are shown with group mean ± s.e.m. Black dots, control; red dots, Wag/Rij. *P < 0.05, **P < 0.01, ***P < 0.001, NS, non-significant (P > 0.05). Source data
Fig. 2
Fig. 2. Seizures are necessary for aberrant callosal myelination.
a, Representative spike-wave discharge seizure from a 6.5-month-old VEH-treated Wag/Rij rat (upper panel); spectral analysis demonstrating that the predominant seizure frequency is ~8 Hz (lower panel). b, Mean seizures per hour for each rat. Control-VEH, n = 8 rats; Control-ETX, n = 9 rats; Wag/Rij-VEH, n = 7 rats; Wag/Rij-ETX, n = 7 rats. Kruskal–Wallis analysis revealed significant variance in seizure burden (seizures per hour) between groups (Kruskal–Wallis statistic, 25.14, P < 0.0001). Dunn’s post hoc testing: Control-VEH versus Wag/Rij-VEH, P < 0.0001, Control-ETX versus Wag/Rij-VEH, P < 0.0001, Wag/Rij-VEH versus Wag/Rij-ETX, P = 0.0099. c, Representative transmission electron micrographs from the mid-sagittal body of the corpus callosum of 7-month-old rats. Scale bars, 2 μm. d, Scatter plots of g-ratios in 7-month-old VEH-treated or ETX-treated Wag/Rij rats. Each dot represents the g-ratio of one axon. e, Mean g-ratios for each 7-month-old Wag/Rij rat and control rat from measurements shown in d. Control-VEH, n = 4 rats; Control-ETX, n = 3 rats; Wag/Rij-VEH, n = 3 rats; Wag/Rij-ETX, n = 3 rats. One-way ANOVA revealed significant variance in group g-ratios F3,9 = 11.36, P = 0.0021. Tukey testing with corrections for multiple comparisons revealed decreased g-ratio (increased myelin thickness) in Wag/Rij-VEH rats with seizures compared to control rats (Control-VEH versus Wag/Rij-VEH, P = 0.015, and Control-ETX versus Wag/Rij-VEH, P = 0.0028). This increase in myelin sheath thickness was prevented with seizure blockade by ETX (Wag/Rij-VEH versus Wag/Rij-ETX, P = 0.0038), which normalized g-ratios (Control-VEH versus Wag/Rij-ETX, P = 0.5841, and Control-ETX versus Wag/Rij-ETX, P = 0.9952). ETX treatment did not alter g-ratios in control rats (Control-VEH versus Control-ETX, P = 0.4492). Each dot represents the mean for one rat (b, e) shown with group means ± s.e.m.; control rats are represented with black dots, and Wag/Rij rats are represented with red dots. *P < 0.05, **P < 0.01, ***P < 0.001, NS, non-significant (P > 0.05). VEH, vehicle; ETX, ethosuximide. Source data
Fig. 3
Fig. 3. Increased oligodendrogenesis and myelination in Scn8a+/mut mice after epilepsy onset.
a, Representative photomicrographs of dividing callosal OPCs (Ki67: red, PDGFRα: white, Olig2: green), indicated with arrowheads. Scale bars, 10 μm. b, Total callosal Ki67+ OPCs in Scn8a+/+ and Scn8a+/mut mice. P21, Scn8a+/+ n = 4 mice; Scn8a+/mut n = 3. P45, Scn8a+/+ n = 6 mice; Scn8a+/mut n = 4. One-way ANOVA: F3,13 = 6.684; P = 0.0057. Post hoc Sidak’s test, Ki67+ OPCs in Scn8a+/mut versus Scn8a+/+ at P45: P = 0.021; at P21: P = 0.76. c, Representative photomicrographs of callosal mature oligodendrocytes expressing CC1 (red) and Olig2 (green). Scale bars, 10 μm. d, Total callosal oligodendrocytes in Scn8a+/+ and Scn8a+/mut mice. P21, Scn8a+/+ n = 4 mice; Scn8a+/mut n = 3 mice. P45, Scn8a+/+ n = 8 mice; Scn8a+/mut n = 6 mice. One-way ANOVA: F3,17 = 7.382; P = 0.0022. Post hoc Sidak’s test, Scn8a+/mut versus Scn8a+/+ mice at P45: P = 0.0069; at P21, P = 0.94. e, Representative transmission electron micrographs of callosal axons in P21 and P45 Scn8a+/+ and Scn8a+/mut mice. Scale bar, 2 μm. f, g, Scatter plots of individual axon g-ratios from P21 (f) and P45 (g) mice. Each dot represents the g-ratio of one axon. h, Mean g-ratios from Scn8a+/+ and Scn8a+/mut mice. P21, Scn8a+/+ n = 4 mice; Scn8a+/mut n = 3 mice. P45, Scn8a+/+ n = 4 mice; Scn8a+/mut n = 4 mice. One-way ANOVA: F3,11 = 4.471; P = 0.028. Post hoc Sidak’s test: g-ratios in Scn8a+/mut versus Scn8a+/+ at P45, P = 0.046; at P21, P = 0.89. i, Percentage of total callosal axons that are myelinated in Scn8a+/+ and Scn8a+/mut mice. P21: Scn8a+/+ n = 3; Scn8a+/mut n = 3. P45: Scn8a+/+ n = 4, Scn8a+/mut n = 4. One-way ANOVA: F3,10 = 8.565, P = 0.0041. Post hoc Sidak’s test: percent myelination in Scn8a+/+ versus Scn8a+/mut at P21, P = 0.9897; at P45, P = 0.0248. Each dot represents the mean for one mouse (b, d, h, i) shown with group means ± s.e.m.; Scn8a+/+ mice are represented by black dots, and Scn8a+/mut mice are represented with red dots. *P < 0.05, **P < 0.01, ***P < 0.001, NS, non-significant (P > 0.05). Source data
Fig. 4
Fig. 4. Activity-dependent myelination contributes to generalized epilepsy progression.
a, Representative transmission electron micrographs from corpus callosum body of 6-month-old mice. Scale bar, 2 μm. b, g-ratios from 6-month-old Scn8a+/mut and Scn8a+/mut OPC cKO mice. Each dot represents the g-ratio for one axon. c, Mean g-ratios for each mouse. Scn8a+/+, n = 4 mice; Scn8a+/+ OPC cKO, n = 4 mice; Scn8a+/mut, n = 4 mice; Scn8a+/mut OPC cKO, n = 4 mice. One-way ANOVA, F3,12 = 8.753, P = 0.0024. Post hoc Tukey’s test: Scn8a+/mut versus Scn8a+/+, P = 0.0085, Scn8a+/mut versus Scn8a+/+ OPC cKO, P = 0.0042. Scn8a+/mut OPC cKO mice versus Scn8a+/+, P > 0.99. Scn8a+/mut OPC cKO mice versus Scn8a+/+ OPC cKO, P > 0.99. Scn8a+/mut OPC cKO versus Scn8a+/mut mice, P = 0.0066. Scn8a+/+ versus Scn8a+/+ OPC cKO, P = 0.9756. d, Representative seizure in a Scn8a+/mut mouse. e, Continuous EEG recordings showing decreased incidence of seizures (arrowheads) in Scn8a+/mut OPC cKO mice at 6 months. f, Mean seizures per hour for each mouse. 3 months: Scn8a+/+, n = 3 mice; Scn8a+/+ OPC cKO, n = 8 mice; Scn8a+/mut, n = 7, Scn8a+/mut OPC cKO, n = 3 mice. One-way ANOVA: F3,17 = 5.814, P = 0.0063. Post hoc Tukey’s test: Scn8a+/+ versus Scn8a+/mut, P = 0.045. Scn8a+/mut versus Scn8a+/mut OPC cKO, P = 0.6. 4 months: Scn8a+/+, n = 5 mice; Scn8a+/+ OPC cKO, n = 6 mice; Scn8a+/mut, n = 6 mice, Scn8a+/mut OPC cKO, n = 4 mice. One-way ANOVA: F3,17 = 23.05, P < 0.0001. Tukey’s test: Scn8a+/+ versus Scn8a+/mut, P < 0.0001. Scn8a+/mut versus Scn8a+/mut OPC cKO, P = 0.0193. 6 months: Scn8a+/+, n = 5 mice; Scn8a+/+ OPC cKO, n = 5 mice; Scn8a+/mut, n = 5 mice; Scn8a+/mut OPC cKO, n = 4 mice. One-way ANOVA: F3,15 = 11.13, P = 0.0004. Tukey’s test: Scn8a+/+ versus Scn8a+/mut, P = 0.0008. Scn8a+/mut versus Scn8a+/mut OPC cKO, P = 0.0218. g, Schematic of recording electrodes over somatosensory cortices, created with BioRender. h, Representative seizure from a 6-month-old Scn8a+/mut mouse with coherence plot. i, Ictal theta band coherence. Scn8a+/mut, n = 6 mice, Scn8a+/mut OPC cKO, n = 7 mice. Two-tailed t-test: P = 0.047. Each dot represents the mean for one animal (c, f, i), with group means ± s.e.m. Scn8a+/+, black dots; Scn8a+/+ OPC cKO, gray dots; Scn8a+/mut, red dots; Scn8a+/mut OPC cKO, blue dots. *P < 0.05, **P < 0.01, ***P < 0.001, NS, non-significant (P > 0.05). Source data
Fig. 5
Fig. 5. Pharmacological blockade of oligodendrogenesis decreases generalized epilepsy progression.
a, Vehicle (VEH) or TSA HDAC inhibitor treatments were initiated at P28 (~1 week after seizure onset); EEG was recorded at P28 and P45. b, Total callosal oligodendrocytes for each mouse. Scn8a+/+-VEH, n = 3 mice; Scn8a+/+-TSA, n = 5 mice; Scn8a+/mut-VEH, n = 6 mice, Scn8a+/mut-TSA, n = 5 mice. One-way ANOVA: F3,15 = 7.433, P = 0.0028. Post hoc Tukey testing: VEH-treated Scn8a+/mut mice oligodendrocyte number versus Scn8a+/+-VEH (P = 0.0055) and Scn8a+/+-TSA (P = 0.011); TSA-treated Scn8a+/mut mice had fewer mature oligodendrocytes than Scn8a+/mut VEH-treated mice (P = 0.031), equivalent to Scn8a+/+-VEH (P = 0.59). c, Mean seizures per hour for each mouse. P28 time point: Scn8a+/+-VEH, n = 3 mice; Scn8a+/+-TSA n = 5 mice; Scn8a+/mut-VEH n = 6 mice; Scn8a+/mut-TSA n = 5 mice. One-way ANOVA: F3,15 = 25.95, P < 0.0001. Tukey testing at P28 showed no pre-treatment difference in seizure burden (seizures per hour) between Scn8a+/mut-VEH and Scn8a+/mut-TSA groups (P > 0.99). Scn8a+/mut-VEH versus Scn8a+/+-VEH, P = 0.0002; Scn8a+/mut-VEH versus Scn8a+/+-TSA, P < 0.0001; Scn8a+/mut-TSA versus Scn8a+/+-VEH, P = 0.0003; Scn8a+/mut-TSA versus Scn8a+/+-TSA, P < 0.0001. P45 time point: Scn8a+/+-VEH n = 3 mice; Scn8a+/+-TSA n = 5 mice; Scn8a+/mut-VEH n = 6 mice; Scn8a+/mut-TSA n = 5 mice. One-way ANOVA: F3,15 = 33.25, P < 0.0001. Tukey testing revealed increased seizures in Scn8a+/mut groups (Scn8a+/mut-VEH versus Scn8a+/+-VEH, P < 0.0001; Scn8a+/mut-VEH versus Scn8a+/+-TSA, P < 0.0001; Scn8a+/mut-TSA versus Scn8a+/+-VEH, P = 0.0032; Scn8a+/mut-TSA versus Scn8a+/+-TSA, P = 0.0003); however, Scn8a+/mut-TSA treated mice had fewer seizures than Scn8a+/mut-VEH (P = 0.032). Scn8a+/+-VEH versus Scn8a+/+-TSA: P28, P > 0.99; P45, P = 0.95. Each dot represents the mean for one mouse; group means ± s.e.m. are shown. Scn8a+/+-VEH, black dots; Scn8a+/+-TSA, gray dots; Scn8a+/mut-VEH, red dots; Scn8a+/mut-TSA, blue dots. *P < 0.05, **P < 0.01, ***P < 0.001, NS, non-significant (P > 0.05). Source data
Extended Data Fig. 1
Extended Data Fig. 1. Callosal oligodendroglial cell density increases with absence seizures in Wag/Rij rats.
(a) Control and Wag/Rij rat body weights. 1.5-month timepoint: control =7 rats; Wag/Rij =5 rats. 6-month timepoint: control=5 rats, Wag/Rij=5 rats. One-way ANOVA: F(3, 18)=39.83, p<0.0001. Sidak’s post-hoc testing: Wag/Rij vs. Wistar at 1.5-months, p=0.0032; at 6-months, p<0.0001. (b) Callosal volumes for each rat. 1.5-month timepoint: control=7 rats; Wag/Rij =5 rats. 6-month timepoint: control=5 rats, Wag/Rij=5 rats. One-way ANOVA: F(3, 18)=18.28, p<0.0001. Sidak’s post-hoc testing: Wag/Rij vs Wistar at 6-months: p=0.0022, at 1.5-months: p=0.9910. (c) Oligodendrocyte densities for each rat. Control=3 rats, Wag/Rij=4 rats. Two-tailed t-test, Wag/Rij vs control: p=0.0025. Each dot represents the mean for one rat, shown with group means ± SEM; control rats are represented with black dots and Wag/Rij rats are represented with red dots. *p<0.05, **p<0.01, ***p<0.001, n.s.=nonsignificant (p>0.05). Source data
Extended Data Fig. 2
Extended Data Fig. 2. Myelinated axon diameters do not contribute to g-ratio differences in Wag/Rij rats and Scn8a+/mut mice.
(a) Mean diameters of myelinated axons for each rat. 1.5-month timepoint, n=4 control (black dots), 3 Wag/Rij (red dots); 6-month timepoint, n=4 control, 4 Wag/Rij rats. One-way ANOVA: F(3,11)=1.065, p=0.4033. (b) Myelinated axon diameter in the body of the corpus callosum at 7-months of age in control (black dots) and Wag/Rij (red dots) rats treated with vehicle (VEH) or ethosuximide (ETX). (Control-VEH, n=4 rats; Control-ETX, n=3 rats; Wag/Rij-VEH, n=3 rats; Wag/Rij-ETX, n=3 rats). One-way ANOVA: F(3,9)=0.9890, p=0.44. (c) Mean myelinated axon diameters for Scn8a+/+ (black dots) and Scn8a+/mut (red dots) mice. P21, Scn8a+/+ n=4 mice; Scn8a+/mut n=3 mice. P45, Scn8a+/+ n=4 mice; Scn8a+/mut n=4 mice. One-way ANOVA: F(3,11)=2.822, p=0.088. (d) Myelinated axon diameters in the body of the corpus callosum in 6-month-old Scn8a+/+ (black dots, n=4 mice), Scn8a+/+ OPC cKO (gray dots, n=4 mice), Scn8a+/mut (red dots, n=4 mice) and Scn8a+/mut OPC cKO mice (blue dots, n =4 mice). One-way ANOVA: F(3,12) =1.324, p=0.31. Each dot represents the mean for one rat or mouse, shown with group means ± SEM. *p<0.05, **p<0.01, ***p<0.001, n.s.=nonsignificant (p>0.05). Source data
Extended Data Fig. 3
Extended Data Fig. 3. Percent axonal myelination and total axon number are similar in control and Wag/Rij rats.
(a) Total number of axons per electron micrograph (field), for each rat (1.5-month timepoint: control=3 rats; Wag/Rij=3 rats. 6-month timepoint: control=3 rats, Wag/Rij=3 rats). One-way ANOVA: F(3, 8)=1.302, p=0.3388. (b) Percent of total callosal axons (myelinated + unmyelinated) that are myelinated in control and Wag/Rij rats. 1.5-month timepoint: control=3 rats; Wag/Rij=3 rats. 6-month timepoint: control=3 rats, Wag/Rij=3 rats. One-way ANOVA: F(3, 8)=3.337, p=0.0768. Sidak’s post-hoc test, percent myelination in Wag/Rij vs control rats at 1.5-months (p=0.8764), and at 6-months (p=0.9283). Each dot represents the mean for one rat, shown with group means ± SEM; control rats are represented with black dots and Wag/Rij rats are represented with red dots. *p<0.05, **p<0.01, ***p<0.001, n.s.=nonsignificant (p>0.05). Source data
Extended Data Fig. 4
Extended Data Fig. 4. Increased myelin sheath thickness across axon diameters in Wag/Rij rats and Scn8a+/mut mice.
(a) Relative frequency of myelinated axons across axon diameters in 6-month old Wag/Rij (red dots) and control rats (black dots). N=4 control rats and 4 Wag/Rij rats. One-way ANOVA: F(7,24)=3.566, p = 0.009. Post-hoc Sidak’s testing, control vs. Wag/Rij: 201-400 nm, p=0.88; 401-600 nm, p=0.99; 601-800 nm, p=0.99; >801 nm p=0.27. (b) g-ratios in axon populations sorted by diameter. N=4 control rats and 4 Wag/Rij rats. One-way ANOVA: F(7,24)=36.79, p<0.0001. Sidak’s testing, control vs. Wag/Rij: 201-400 nm, p=0.0186; 401-600 nm, p=0.0194; 601-800 nm, p=0.0759; >801 nm p=0.0095. (c) Relative frequency of myelinated axons across axon diameters in P45 Scn8a+/+ mice (black dots) compared to Scn8a+/mut (red dots). N=4 Scn8a+/+ and 4 Scn8a+/mut mice. One-way ANOVA: F(7,24)=8.067, p<0.0001. Post-hoc analysis with Sidak’s testing, Scn8a+/+ vs. Scn8a+/mut mice: 201-400 nm, p=0.9971; 401-600 nm, p=0.9988; 601-800 nm, p=0.9990; >801 nm p=0.9954. (d) g-ratios from Scn8a+/+ and Scn8a+/mut mice, sorted by axon diameter (N=4 Scn8a+/+ and 4 Scn8a+/mut mice). One-way ANOVA: F(7,24)=126.2, p<0.0001. Sidak’s test, Scn8a+/+ vs. Scn8a+/mut g-ratios: 201-400 nm, p=0.0509; 401-600 nm, p=0.0003; 601-800 nm, p=0.0059; >801 nm p=0.0013. Each dot represents the mean for one rat or mouse, shown with group means ± SEM. *p<0.05, **p<0.01, ***p<0.001, n.s.=nonsignificant (p>0.05). Source data
Extended Data Fig. 5
Extended Data Fig. 5. Increased myelination is specific to the absence seizure network.
(a) Representative transmission electron micrographs showing similar appearing myelinated axons in the splenium of a 6-month-old control rat (upper panel) and a Wag/Rij rat (lower panel). Scale bar=2 μm. (b) Scatterplot of g-ratios showing overlap between control and Wag/Rij rats’ g-ratios. Each data point represents one axon’s g-ratio, with control g-ratios in black and Wag/Rij g-ratios in red. n=3 control, 3 Wag/Rij rats. (c) Each dot represents the mean g-ratio for one rat. n=3 control, 3 Wag/Rij rats. Data are shown with group means ± SEM and were analyzed with a two-tailed t-test (n.s., non-significant, p=0.27). Source data
Extended Data Fig. 6
Extended Data Fig. 6. Increased callosal oligodendroglial cell density and equivalent callosal axon density in Scn8a+/mut mice.
(a) Callosal volumes for Scn8a+/+ and Scn8a+/mut mice. P21: Scn8a+/+=4 mice; Scn8a+/mut=4 mice. P45: Scn8a+/+=8 mice, Scn8a+/mut=8 mice. One-way ANOVA: F(3,20)=8.443; p=0.0008. Sidak’s post-hoc test, Scn8a+/mut vs Scn8a+/+ at P45, p=0.0027. At P21, p=0.94. (b) Oligodendrocytes in the body of the corpus callosum in P45 mice, normalized to callosal volume (Scn8a+/+ n=8 mice; Scn8a+/mut n=6 mice). Two-tailed t-test, p=0.017. Apoptotic OPCs (c) and apoptotic mature oligodendrocytes (d) in P45 Scn8a+/+ and Scn8a+/mut were labeled with TUNEL staining. (c) Scn8a+/+ n=4 mice, Scn8a+/mut n=4 mice, two-tailed t-test: p=0.3471. (d) Scn8a+/+ n=4 mice, Scn8a+/mut n=4 mice, two-tailed t-test: p=0.3625. (e) Total number of callosal axons (myelinated and unmyelinated) per electron micrograph (field) in Scn8a+/+ and Scn8a+/mut mice. P21: Scn8a+/+=3 mice; Scn8a+/mut=3 mice. P45: Scn8a+/+=4 mice; Scn8a+/mut=4 mice. One-way ANOVA revealed no significant variance in total axon number among the four groups, F(3, 10)=4.047, p=0.04. Sidak’s post-hoc test, Scn8a+/mut vs Scn8a+/+ at P45, p=0.37. At P21, p=0.13. Scn8a+/+ mice are indicated by black dots and Scn8a+/mut mice are indicated by red dots. Data are shown with group means ± SEM. *p<0.05, **p<0.01, ***p<0.001, n.s.=nonsignificant (p>0.05). Source data
Extended Data Fig. 7
Extended Data Fig. 7. Increased callosal microglial density in Scn8a+/mut mice.
(a) Representative photomicrographs of callosal microglia co-labeled for Iba1 (green), CD68 (red) and nuclear Hoescht staining (blue), from P45 Scn8a+/+ and Scn8a+/mut mice. Scale bars=20 μm. (b) Density of Iba1-expressing microglia for each mouse. Scn8a+/+ n=4 mice; Scn8a+/mut n=4 mice. Data were analyzed with two-tailed t-test, p=0.0035. (c) The percent of Iba1+ microglia co-expressing CD68 appears to be relatively high in C3H/FeJ mice, but was not significantly different in Scn8a+/+ (n=4 mice) and Scn8a+/mut (n=4 mice); two-tailed t-test, p=0.0806. (d) Representative photomicrographs of callosal astrocytes co-labeled for Sox9 (green) and GFAP (red), from P45 Scn8a+/+ and Scn8a+/mut mice. Scale bars=20 μm. (e) Total astrocyte density (GFAP and Sox9- and Sox9-only expressing astrocytes). Scn8a+/+, n=3 mice and Scn8a+/mut, n=3 mice; two-tailed t-test, p=0.6390. (f) The percentage of GFAP positive astrocytes was equivalent (Scn8a+/+, n=3 mice and Scn8a+/mut, n=3 mice; two-tailed t-test, p=0.2286). (g) Astrocyte size as assessed by % area occupied by GFAP staining was equivalent between Scn8a+/+ and Scn8a+/mut (Scn8a+/+, n=4 mice and Scn8a+/mut, n=4 mice; two-tailed t-test, p=0.4844). Each dot represents the mean for one mouse; group means ± SEM are shown. Scn8a+/+ mice are shown in black and Scn8a+/mut are shown in red. *p<0.05, **p<0.01, ***p<0.001, n.s.=nonsignificant (p>0.05). Source data
Extended Data Fig. 8
Extended Data Fig. 8. Timing and kinetics of seizure onset and epilepsy progression in Scn8a+/mut mice on original (C3HeB/FeJ) and new (C3HeB/FeJ/C57/BL6) genetic backgrounds.
To genetically block activity-dependent myelination in Scn8a+/mut mice (originally on a C3HeB/FeJ background), we generated Scn8a+/mut;TrkBfl/fl;PDGFRα::Cre-ER mice (on a C3HeB/FeJ and C57/BL6 mixed genetic background). In Scn8a+/mut mice with the new mixed C3HeB/FeJ and C57/BL6 genetic background and intact activity-dependent myelination (Scn8a+/mut, new background), seizure onset and progression occurred at later timepoints (solid red line, P45-P180, 1.5- to 6-months, P45, n=4 mice, P90, n=6 mice, P120, n=6 mice, P180, n=5 mice). In the original line (Scn8a+/mut, original background), seizures begin at ~P21 and increase until P35-P45 (dashed red line, n=4 mice per timepoint, data from Makinson et al, Neuron 2017). Graph displays group means with SEM. Source data
Extended Data Fig. 9
Extended Data Fig. 9. Activity-dependent myelination does not impact seizure duration.
(a) Mean seizure duration in Scn8a+/mut (red dots) and Scn8a+/mut OPC cKO mice (blue dots). 3-month-old timepoint: Scn8a+/mut n=7 mice, Scn8a+/mut OPC cKO, n=3 mice. 4-month-old timepoint: Scn8a+/mut, n=6 mice, Scn8a+/mut OPC cKO, n=4 mice. 6-month timepoint: Scn8a+/mut, n=5 mice, Scn8a+/mut OPC cKO, n=4 mice. One-way ANOVA, F(5, 23)=0.7687, p=0.58. (b) Mean seizure duration in Scn8a+/mut treated with vehicle (VEH, red dots) or trichostatin A (TSA, blue dots). P28 timepoint: Scn8a+/mut-VEH n=6 mice, Scn8a+/mut-TSA n=5 mice. P45 timepoint: Scn8a+/mut-VEH n=6 mice, Scn8a+/mut-TSA n=5 mice. Data were analyzed with one-way ANOVA revealing significant variation in seizure duration across groups, F(3,18)=8.062, p=0.0013. However, Sidak’s test comparing seizure duration between groups within each timepoint revealed no significant differences (P28, p=0.57; P45, p=0.90). Each data point represents mean seizure duration for one mouse; data are shown with group means ± SEM. n.s., nonsignificant (p>0.05). Source data
Extended Data Fig. 10
Extended Data Fig. 10. Blockade of activity-dependent myelination does not alter ictal coherence in visual cortices.
In contrast to ictal coherence in the somatosensory cortices (Fig. 4i), ictal theta band coherence when recorded from visual cortices is similar in 6-month-old Scn8a+/mut OPC cKO mice compared to Scn8a+/mut mice. Scn8a+/mut (red dots), n=6 mice, Scn8a+/mut OPC cKO (blue dots), n=6 mice. Each dot represents the mean ictal theta coherence from visual cortices for one mouse, shown with group means ± SEM. Two-tailed t-test, p=0.5142. n.s., nonsignificant (p>0.05). Source data

Comment in

References

    1. Mensch S, et al. Synaptic vesicle release regulates myelin sheath number of individual oligodendrocytes in vivo. Nat. Neurosci. 2015;18:628–630. doi: 10.1038/nn.3991. - DOI - PMC - PubMed
    1. Hines JH, Ravanelli AM, Schwindt R, Scott EK, Appel B. Neuronal activity biases axon selection for myelination in vivo. Nat. Neurosci. 2015;18:683–689. doi: 10.1038/nn.3992. - DOI - PMC - PubMed
    1. Makinodan M, Rosen KM, Ito S, Corfas G. A critical period for social experience-dependent oligodendrocyte maturation and myelination. Science. 2012;337:1357–1360. doi: 10.1126/science.1220845. - DOI - PMC - PubMed
    1. Gibson EM, et al. Neuronal activity promotes oligodendrogenesis and adaptive myelination in the mammalian brain. Science. 2014;344:1252304. doi: 10.1126/science.1252304. - DOI - PMC - PubMed
    1. Hughes EG, Orthmann-Murphy JL, Langseth AJ, Bergles DE. Myelin remodeling through experience-dependent oligodendrogenesis in the adult somatosensory cortex. Nat. Neurosci. 2018;21:696–706. doi: 10.1038/s41593-018-0121-5. - DOI - PMC - PubMed

Publication types

Substances