. 2022 May;25(5):567-576.
doi: 10.1038/s41593-022-01060-2. Epub 2022 May 2.

Cerebrospinal fluid can exit into the skull bone marrow and instruct cranial hematopoiesis in mice with bacterial meningitis

Affiliations

Cerebrospinal fluid can exit into the skull bone marrow and instruct cranial hematopoiesis in mice with bacterial meningitis

Fadi E Pulous et al. Nat Neurosci. 2022 May.

Abstract

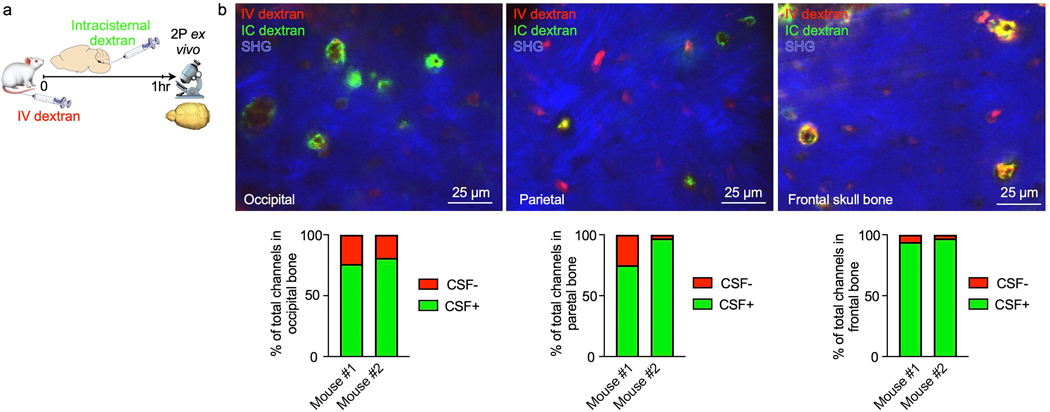
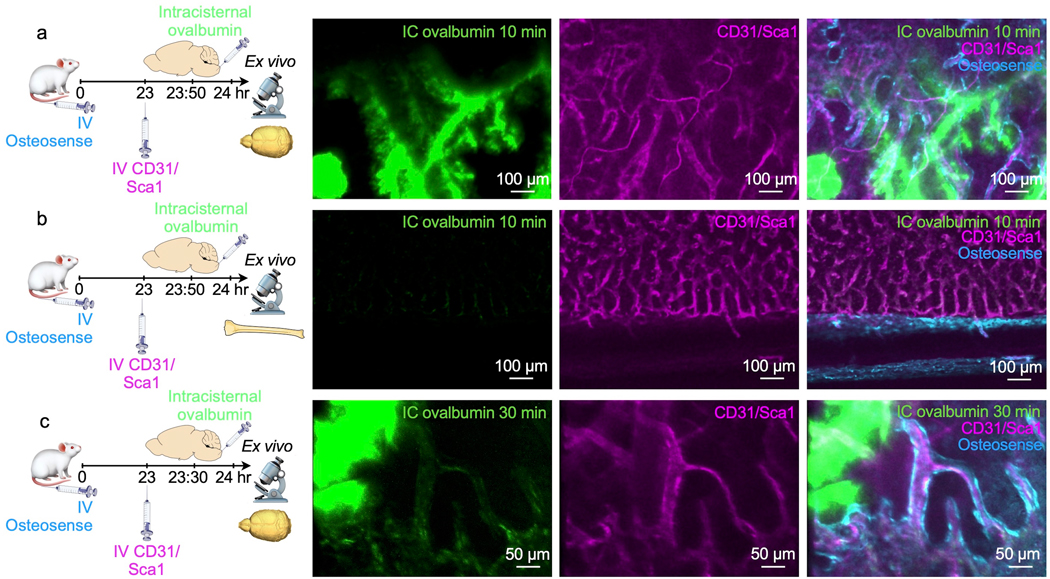
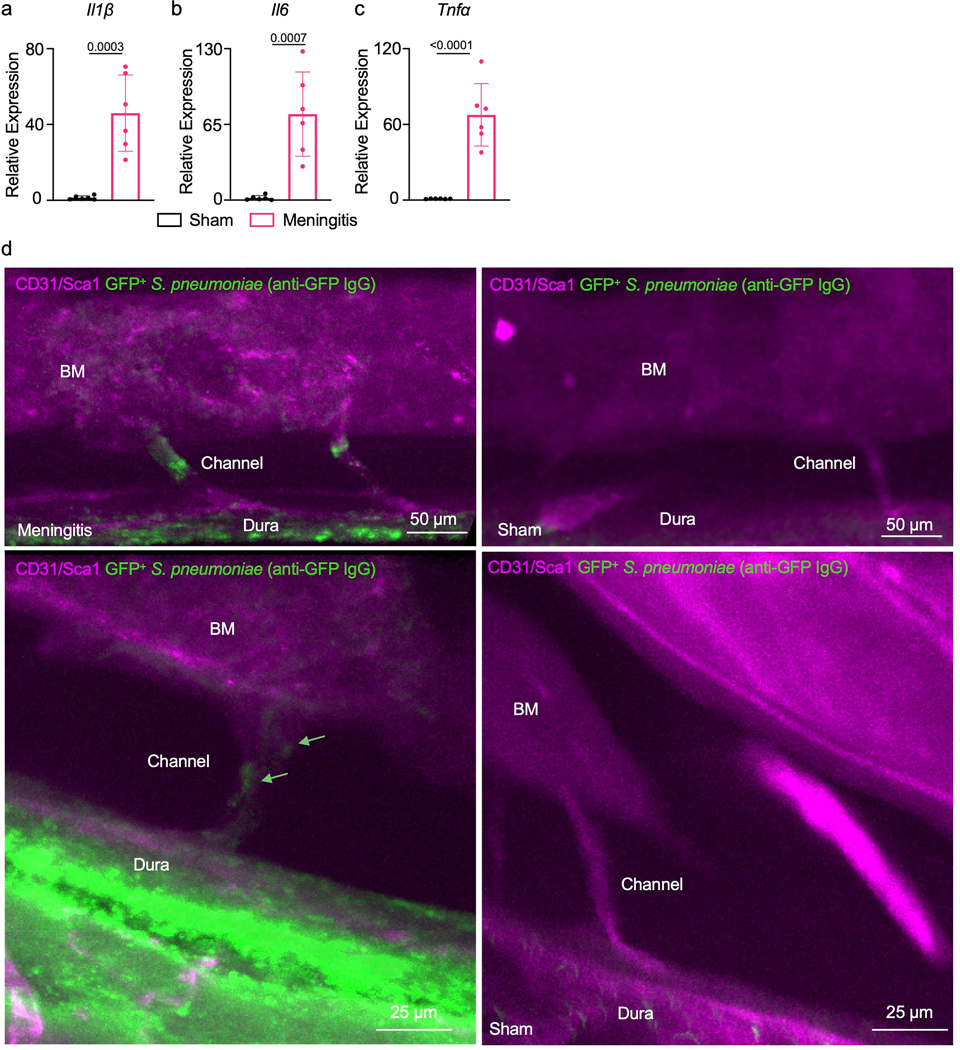
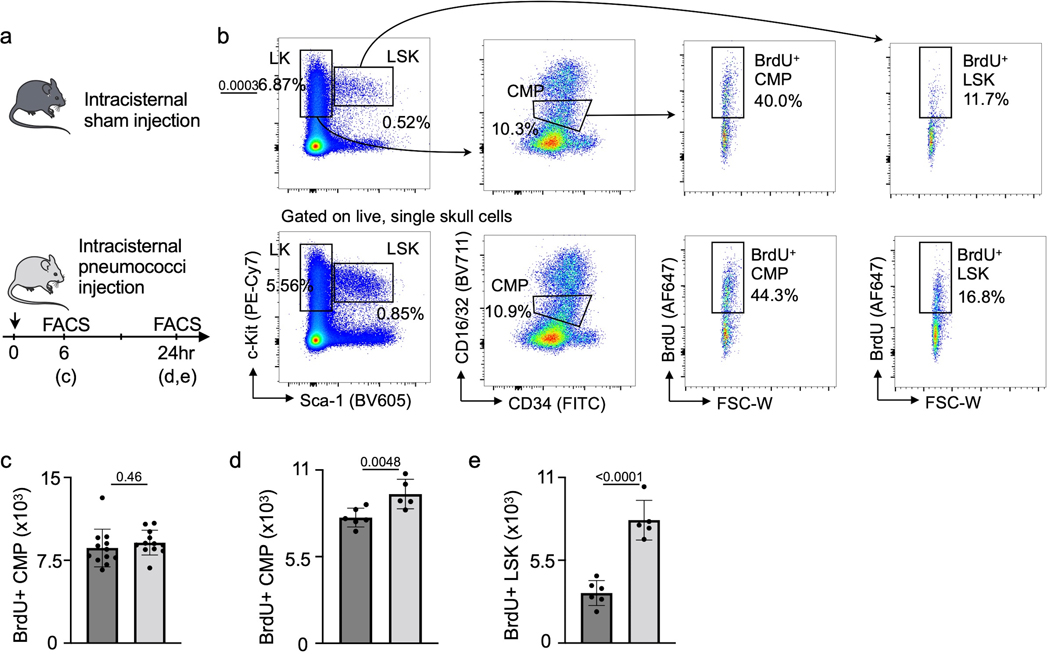
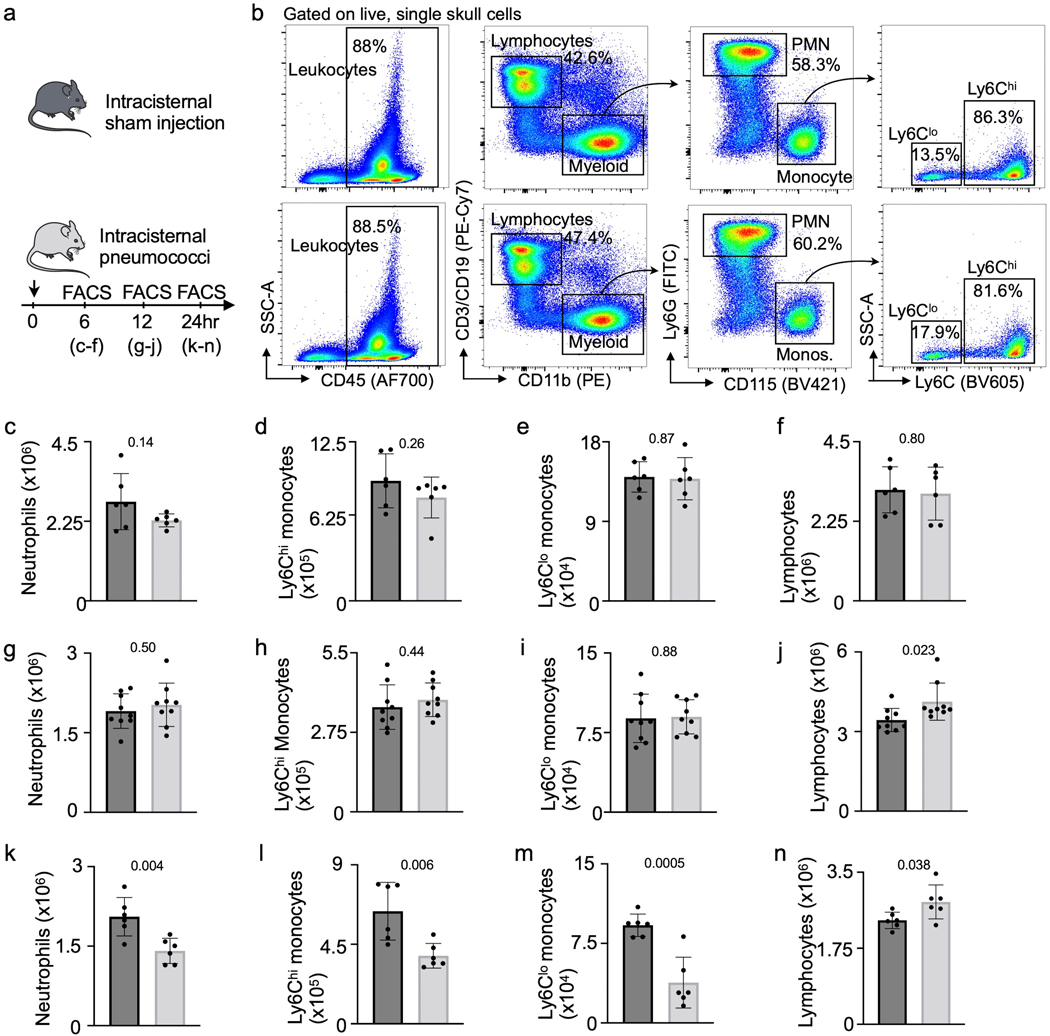
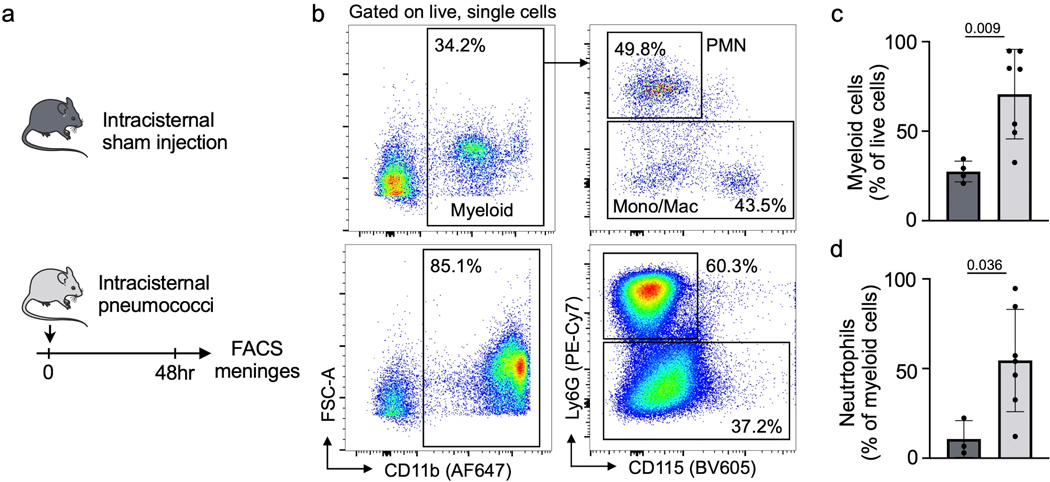
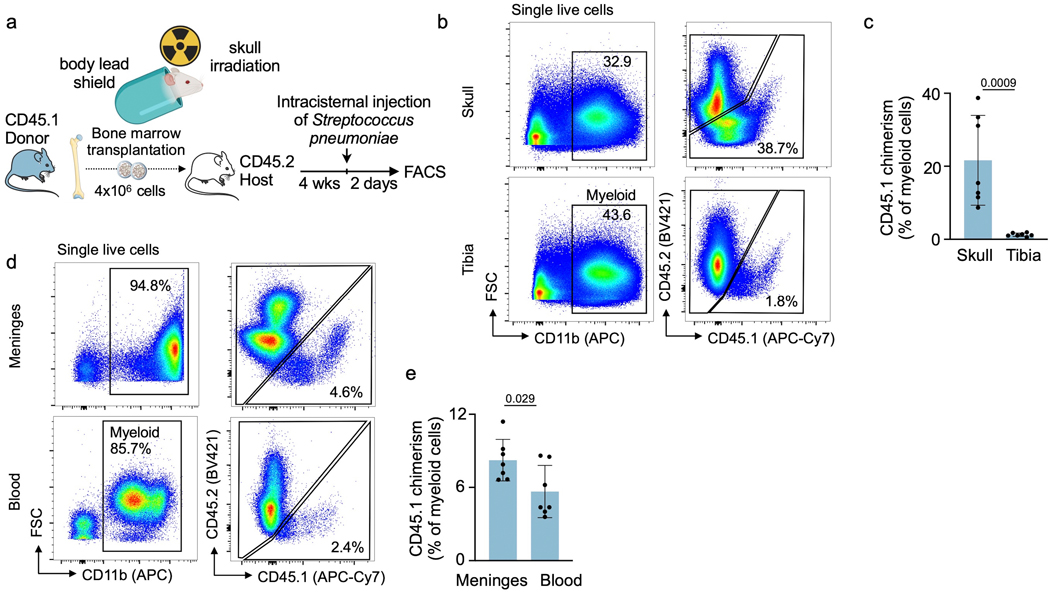
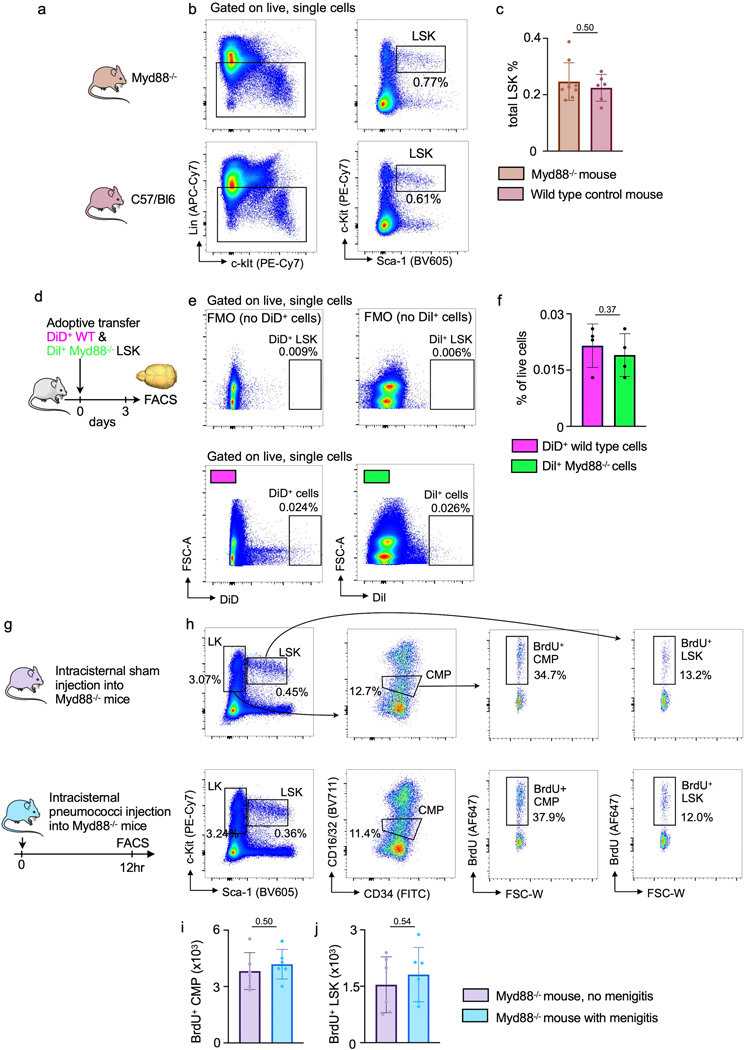
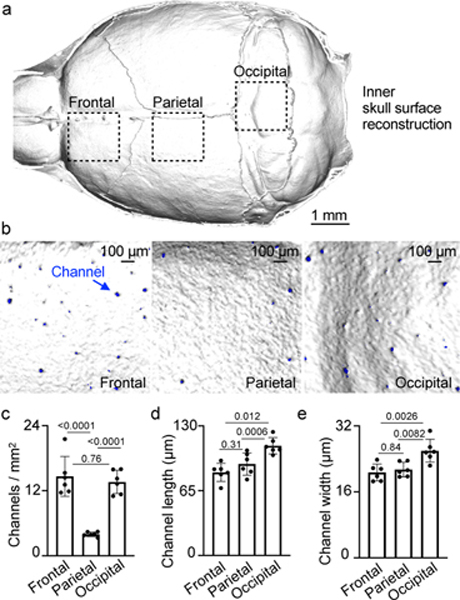
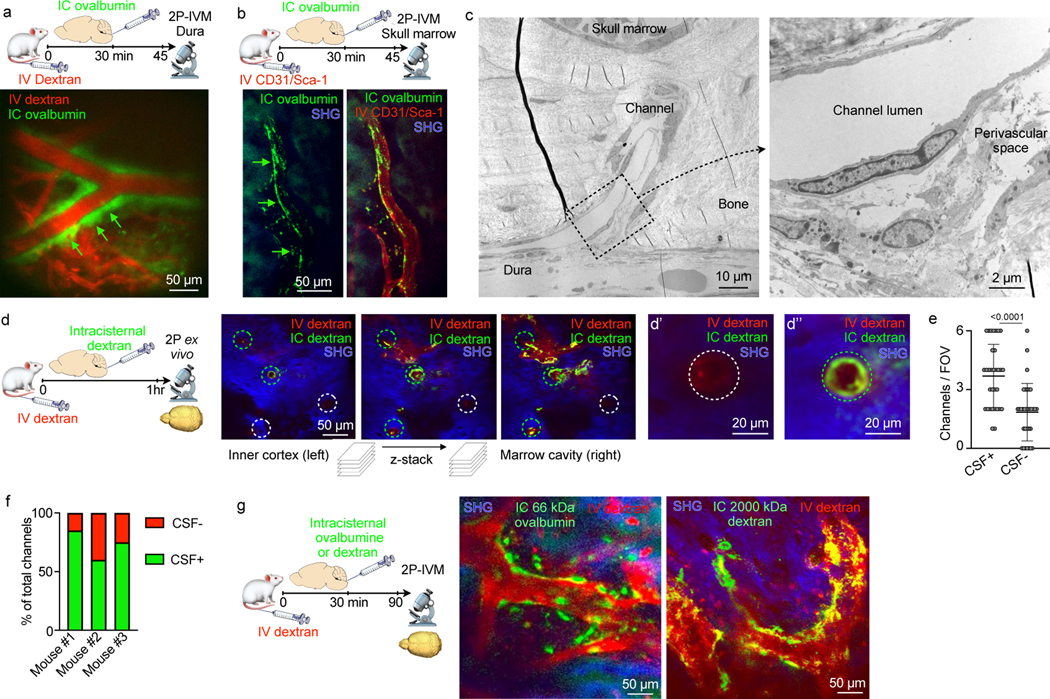
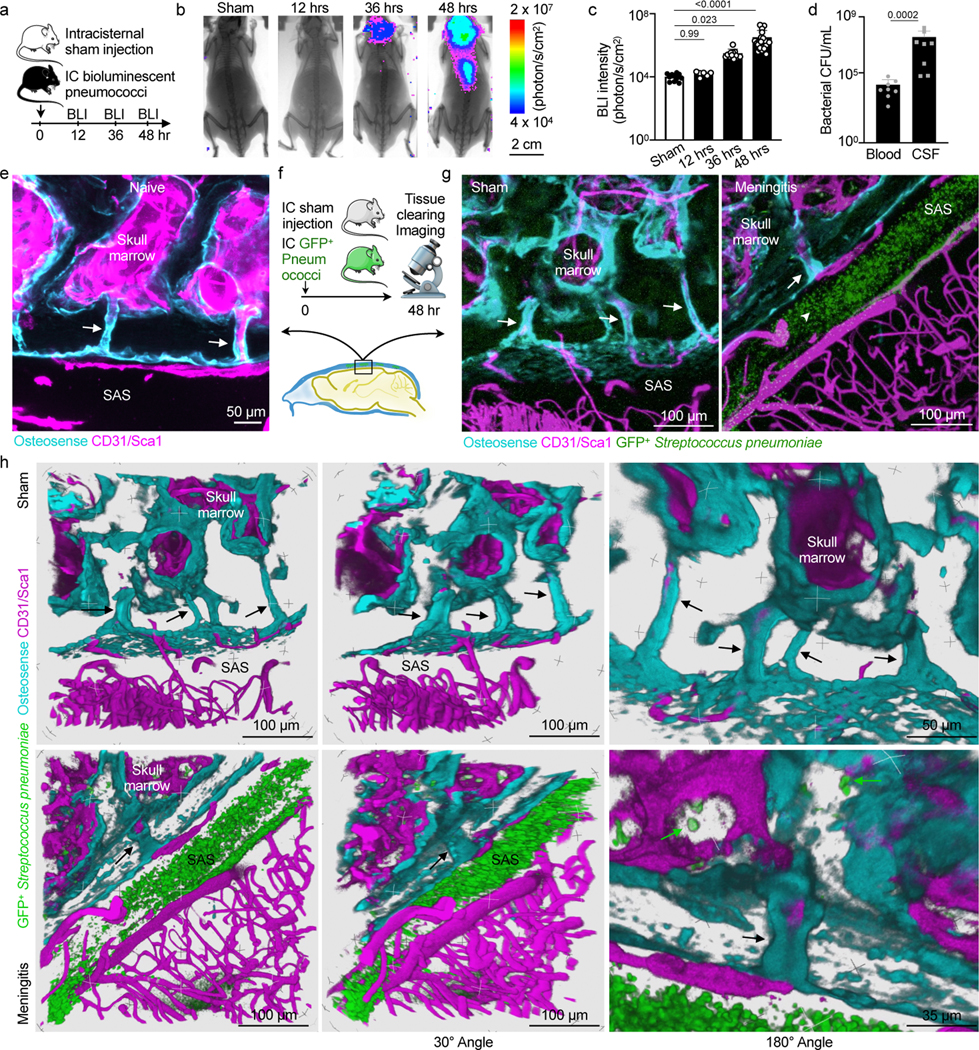
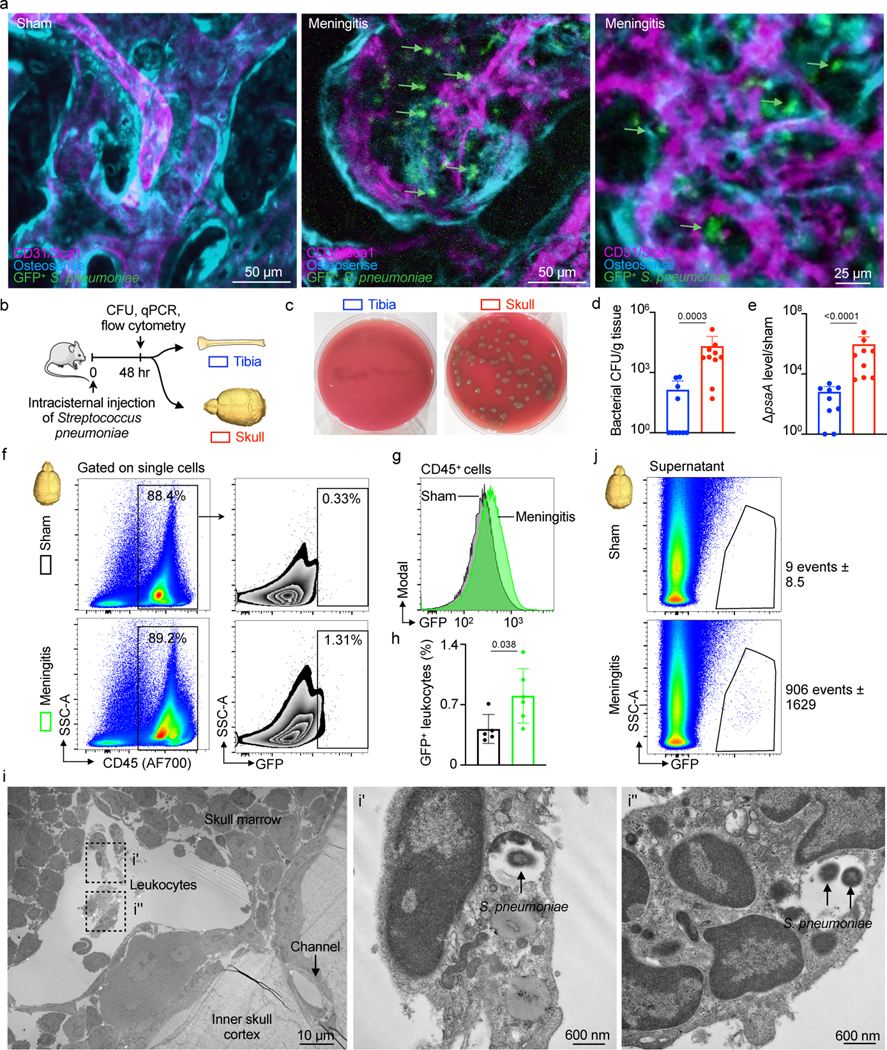
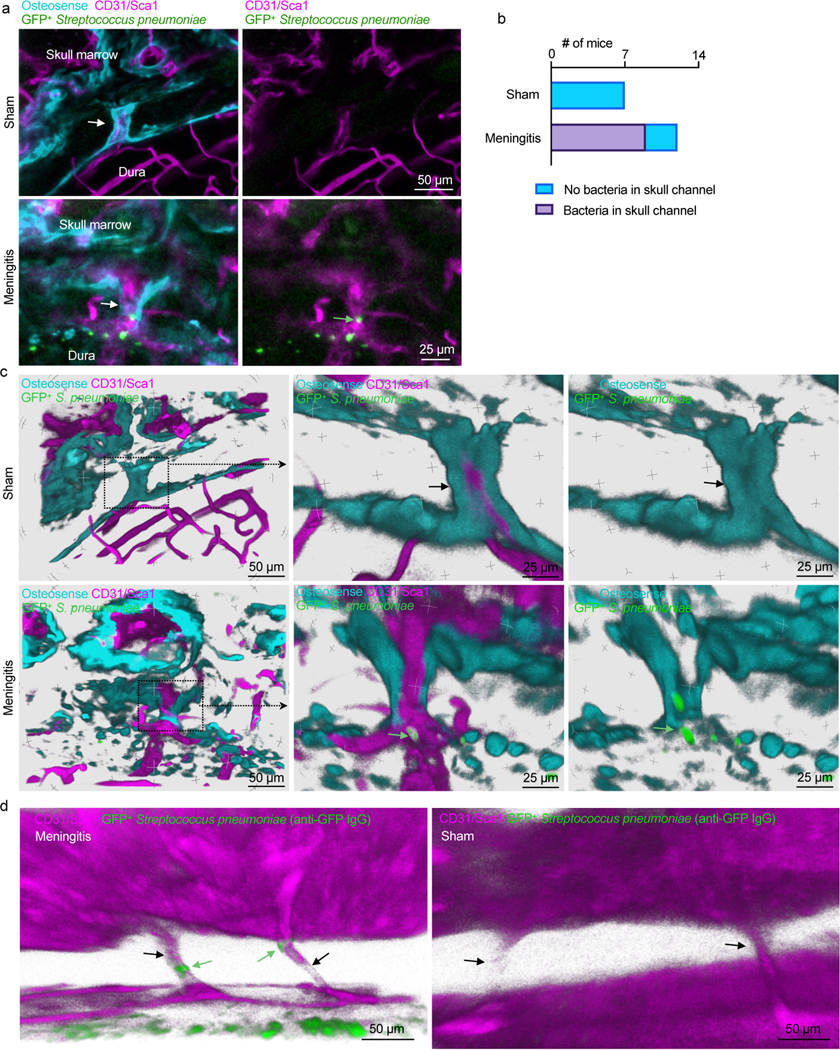
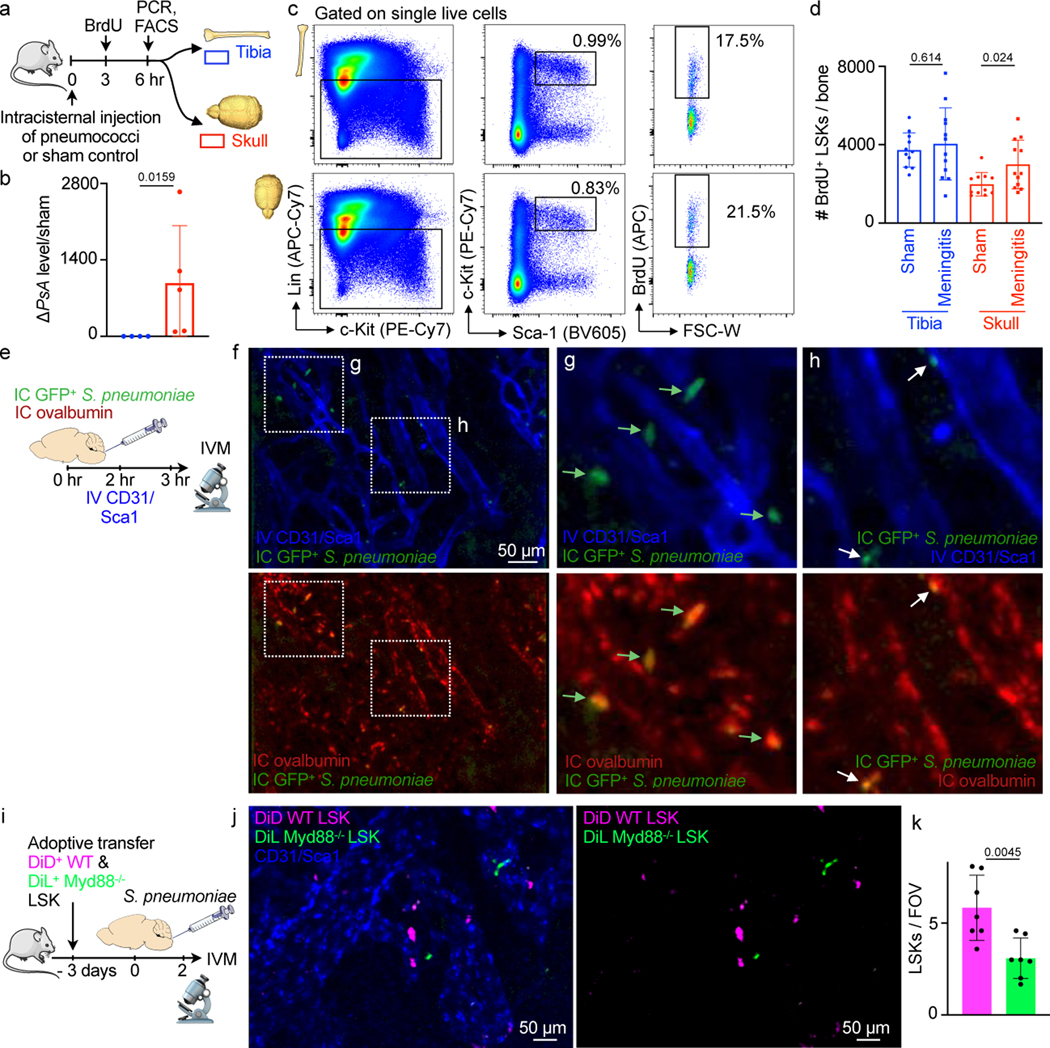
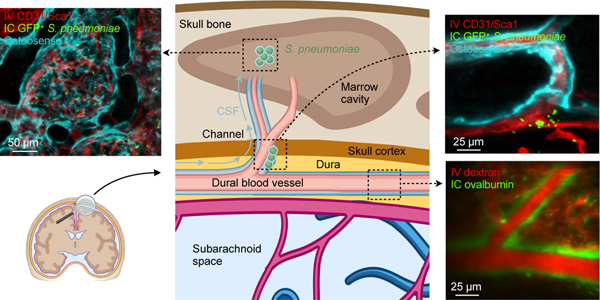
Interactions between the immune and central nervous systems strongly influence brain health. Although the blood-brain barrier restricts this crosstalk, we now know that meningeal gateways through brain border tissues facilitate intersystem communication. Cerebrospinal fluid (CSF), which interfaces with the glymphatic system and thereby drains the brain's interstitial and perivascular spaces, facilitates outward signaling beyond the blood-brain barrier. In the present study, we report that CSF can exit into the skull bone marrow. Fluorescent tracers injected into the cisterna magna of mice migrate along perivascular spaces of dural blood vessels and then travel through hundreds of sub-millimeter skull channels into the calvarial marrow. During meningitis, bacteria hijack this route to invade the skull's hematopoietic niches and initiate cranial hematopoiesis ahead of remote tibial sites. As skull channels also directly provide leukocytes to meninges, the privileged sampling of brain-derived danger signals in CSF by regional marrow may have broad implications for inflammatory neurological disorders.


Conflict of interest statement

Competing interests

The authors declare no competing interests.

Figures

Extended Data Fig. 1
Extended Data Fig. 1. CSF tracer outflow in occipital, parietal and frontal skull bones
a, Experimental outline. Ex-vivo z-stack (54 μm stack at 1 μm/step) of occipital, parietal and frontal skull cortex after IC and IV injection of fluorescently labeled dextran. Bone is visualized by second harmonic generation around channels b, Imaging of CSF tracer outflow through channels in different skull bones, assessed in n=2 mice. Bar graphs depict the proportion of skull channels that were positive for CSF tracer.
Extended Data Fig. 2
Extended Data Fig. 2. Dynamics of CSF outflow into bone marrow
a, Ex vivo imaging of whole-mount skull 10 min after intracisternal (IC) injection of ovalbumin. Intravenous(IV) injection of CD31/Sca1 labeled vasculature and IV osteosense the bone. b, Ex vivo imaging of tibia 10 minutes after intracisternal injection of ovalbumin. c, Imaging 30 minutes after intracisternal injection of ovalbumin. Data is representative of 2 independent experiments.
Extended Data Fig. 3
Extended Data Fig. 3. Inflammation in the meninges driven by bacterial meningitis
qPCR analysis of meninges isolated from either sham controls that were intracisternally injected with artificial CSF or mice 48 hours after intracisternal infection for relative expression analysis of a, Il1β, b, Il6 and c, Tnfα (mean ± SD; n=6 mice per group; P values represent an unpaired two-tailed t-test from a single experiment). d, Raw images obtained by whole mount ex vivo imaging of the skull 48 hours after intracranial sham or S. pneumoniae injection. First representative image is the original data from Figure 5b while the second set represents additional examples of channel morphology and bacterial propagation. Green arrow highlights bacteria (scale: 50 and 25 μm).
Extended Data Fig. 4
Extended Data Fig. 4. Analysis of skull hematopoietic progenitors during meningitis
a, Experimental outline for calvarial hematopoietic progenitor analysis. b, Flow cytometry gating. c, Quantitation of calvarial BrdU+ common myeloid progenitors (CMP) 6 hours after intracisternal sham or S. pneumococci injection. (n=11 sham and 12 meningitis, P value represents an unpaired, two-tailed t-test). d, Quantitation of calvarial BrdU+ CMP 24 hours after intracisternal sham or S. pneumococci injection. (n=6 mice per group, P value represents an unpaired, two-tailed t-test) e, Quantitation of calvarial BrdU+ LSK 24 hours after intracisternal sham or S. pneumococci injection. (n=6 mice per group, P value represents an unpaired, two-tailed t-test).
Extended Data Fig. 5
Extended Data Fig. 5. Analysis of calvarial leukocytes during meningitis
a, Experimental outline of calvarial leukocyte analysis. b, Flow cytometry gating. c-f, Quantitation of calvarial leukocytes 6 hours after intracisternal S. pneumococci injection shows neutrophils, monocyte subsets and total lymphocytes (n=5 mice per group). g-j, Quantitation of calvarial leukocytes 12 hours after S. pneumococci injection including neutrophils (g), Ly6Chi monocytes (h), Ly6Clo monocytes (i) and total lymphocytes (j) (n=9 sham and 8 meningitis). k-n, Quantitation of calvarial leukocytes 24 hours after S. pneumococci injection including neutrophils (k), Ly6Chi monocytes (l), Ly6Clo monocytes (m) and total lymphocytes (n) (n=6 mice per group). (P values represent unpaired, two-tailed t-tests, data are mean values ± SD).
Extended Data Fig. 6
Extended Data Fig. 6. Meningeal leukocytes expand in bacterial meningitis
a, Experimental outline. b, flow cytometry plots of control meninges (upper panel) and meninges 48 hours after infection. c, quantification of CD11b+ myeloid cells and d, Ly6G+ neutrophils in meninges (n=4 sham and 7 meningitis mice, P values represent unpaired, two-sided t tests, data are mean values ± SD).
Extended Data Fig. 7
Extended Data Fig. 7. Tracking of skull leukocytes to infected meninges
a, Experimental outline indicating skull marrow transplantation, followed by induction of meningitis 4 weeks later. b, flow plots and (c) quantitation of myeloid cell chimerism in irradiated skull versus lead-shielded tibia 4 weeks after transplantation (n=7 recipient mice, P value represents unpaired, two-tailed t test, data are mean values ± SD). d, flow plots and (e) quantification of myeloid cell chimerism in the meninges and in blood (n=7 recipient mice, P value represents unpaired, two-tailed t tests, data are mean values ± SD).
Extended Data Fig. 8
Extended Data Fig. 8. Myd88-related sensing in the skull marrow
a, Experimental groups include wild type and Myd88−/− mice. The skull marrow was assessed by flow cytometric staining for lineage markers Sca-1 and c-kit. b, Flow cytometry plots and c, quantitation of LSK % as a total of all live lineage negative single cells in the calvarial marrow of steady-state Myd88−/− or wild-type C57/Bl6 mice (n=9 sham and 6 meningitis mice, P value represents an unpaired, two-tailed t-test, data are mean values ± SD). d, Experimental outline. Non-irradiated wild type recipient mice received a mix of 40,000 LSK from wild type donors (labeled with the membrane dye DiD) and from Myd88−/− donors (labeled with Dil). e, Flow cytometry gating and f, analysis of the skull bone marrow 3 days later showed a similar seeding of LSK irrespective of phenotype (n=4 mice per group, unpaired, two-tailed t-test).g, Experimental outline of calvarial progenitor analysis in Myd88−/− mice with and without meningitis. h, Flow cytometry gating. i, Quantitation of calvarial BrdU+ CMP 12 hours after intracisternal sham or S. pneumococci injection. (n=11 sham and 12 meningitis mice per group, unpaired two-tailed t-test, data are mean values ± SD). j, Quantitation of calvarial BrdU+ LSK 24 hours after intracisternal sham or S. pneumococci injection. (n=6 mice group, unpaired two-tailed t-test, data are mean values ± SD).
Fig. 1.
Fig. 1.. Skull channel anatomy by X-ray computed tomography.
a, Inner skull cortex microCT surface reconstruction (scale: 1 mm). b, Reconstruction of inner frontal, parietal and occipital bone surfaces. Channel openings labeled blue. (scale bar: 100 μm, 2 independent repeats). Channel density c, length d, and width e, (mean ± SD; n=6; P values represent a one-way ANOVA with Tukey’s multiple comparison’s test).
Fig. 2.
Fig. 2.. CSF flows through perivascular space of skull channels into the marrow.
a, Intravital microscopy (IVM) image of intracisternally (IC) injected ovalbumin in the perivascular space of a dural vessel labeled with IV dextran (scale: 50 μm, n=3 from 2 experiments). b, IVM of intracisternally injected ovalbumin in the perivascular space of a marrow vessel (scale: 50 μm, n=3 from 2 experiments). c, Transmission electron microscopy of skull channel (scale: 10 μm). Inset of perivascular space (scale: 2 μm, n=6 from 2 experiments). d, Ex-vivo z-stack (54 μm stack at 1 μm/step) of interior frontal and parietal skull cortex after IC and IV dextran. Bone visualized by second harmonic generation around channels (circles). d and d’’ depict IC-tracer negative and positive channels (scale: 50 μm, 20 μm, n=3 from 2 experiments). e, Number of CSF-containing channels (mean ± SD; n=3; P value represents Mann-Whitney, two-sided rank test). f, Relative frequency of CSF-containing channels compared to non-CSF containing channels (n=3). g, IVM after indicated IC tracer injection and IV dextran (scale: 50 μm, n=3–5/group; scale: 50 μm).
Fig. 3.
Fig. 3.. Bacterial presence in meninges and the skull marrow.
a, Timeline for bioluminescent Streptococcus pneumoniae Xen10 meningitis. b, Bioluminescence imaging (BLI) of sham controls or mice after intracisternal injection of S. pneumoniae Xen10 (scale: 2 cm). c, Bacterial load measured by BLI (mean ± SD; n=11 sham, 6 12hr, 12 36 hr, 24 48 hr; P values represent a Kruskal-Wallis test with Dunn’s multiple comparisons test). d, Bacterial colony forming unit (CFU) assay from blood and CSF at 48 hours (mean ± SD; n=8; P value represents a Mann-Whitney two-sided rank test). e, Skull channels following tissue-clearing (171 μm, 3 μm/step with 57 steps) (scale: 50 μm, n=4 mice from 2 experiments). f, Tissue-clearing scheme. g, Representative z-stack images of sham controls (248 μm, 0.75 um/step with 331 steps) and mice after IC GFP+ Streptococcus pneumoniae JWV500 (267 μm, 3 μm/step with 89 steps) . CD31/Sca1 labels vasculature and osteosense marks bone (n=4 sham, 6 meningitis; scale: 100 μm). h, Three-dimensional reconstructions highlighting skull channels (arrows) and marrow bacteria (green arrows). Scale: 100 μm, 50 μm and 35 μm; data pooled from 3 independent experiments. Upper row indicates control mouse without bacterial injection, lower row indicates a mouse 48 hours after induction of meningitis.
Fig. 4.
Fig. 4.. Intra- and extracellular bacterial localization in the cranial marrow.
a, IVM of skull marrow from sham controls or mice 48 hrs after intracisternal injection of GFP+ Streptococcus pneumoniae JWV500 (n=3 sham, 4 meningitis from 2 independent experiments; scale: 50 μm, 25 μm). b, Experimental scheme for (d-j). c, Bacterial culture of pneumococcal growth in tibia versus skull. Skull sample contains pooled frontal, parietal and occipital bone. d, Quantitation of bacterial CFU (mean ± SD; n=10; P value represents a Mann-Whitney two-sided rank test). e, S. pneumoniae surface adhesion gene (psaA) expression in tibia versus skull normalized to sham (mean ± SD; n=9; P value represents a Mann-Whitney two-sided rank test). f, Gating strategy for GFP+ CD45+ leukocytes g, Histogram of GFP signal in CD45+ leukocytes obtained from mice with meningitis compared to CD45+ cells from sham controls. h, Quantitation of GFP+CD45+ cells (mean ± SD; n=5; P value represents an unpaired, two-tailed t-test) i, Transmission electron microscopy of S. pneumoniae in the skull marrow. Left, low-magnification view of calvarial marrow depicts a sinusoidal vessel lumen adjacent to a skull channel, the inner skull bone cortex and leukocytes. Right, insets illustrate multiple leukocytes containing S. pneumoniae (n=2 mice; scale: 10 μm and 600 nm). j, Flow cytometric analysis of extracellular GFP+ S. pneumoniae in supernatant fraction of tibia and skull (n=2 sham and 4 meningitis).
Fig. 5.
Fig. 5.. Skull channels are conduits for pneumococcal migration into the cranial marrow.
a, Whole-mount ex vivo imaging of skull channels in sham controls (132 μm stack, 0.75 μm/step) and mice after intracisternal injection of GFP+ Streptococcus pneumoniae JWV500 (43 μm stack, 0.75 μm/step; 102 μm stack, 0.75 μm/step). Images depict bacteria (green arrow) in skull channels (white arrow). Osteosense was used to label bone and a CD31/Sca-1 cocktail for vasculature (n=7 sham and 12 meningitis mice; scale: 50 μm, 25 μm). b, Quantitation of S. pneumoniae GFP signal in skull channels in sham controls and mice with meningitis (n=7 sham, n=12 mice with meningitis). c, Tissue-clearing preceded ex vivo imaging of skull channels in sham control or after intracisternal injection of GFP+ Streptococcus pneumoniae JWV500. Skull channels are visualized using osteosense to label bone and marrow vasculature using a CD31/Sca-1 cocktail. 3D reconstructions show intra-channel S. pneumoniae location in meningitis while bacteria are absent in sham controls (scale: 50 μm or 25 μm, representative data from 3 independent experiments). d, Whole-mount ex vivo imaging after CUBIC tissue processing for bacterial GFP detection after intracisternal injection of GFP+ Streptococcus pneumoniae JWV500. CUBIC protocol (described in methods) was followed by immunostaining for bacterial GFP. Bone marrow vasculature was labeled in vivo with CD31/Sca-1 (n=2 mice; scale: 50 μm). Green arrows indicate bacteria, black arrows indicate skull channels.
Fig. 6.
Fig. 6.. Bacterial meningitis induces LSK proliferation in the skull.
a, Outline for experiments (b-d). b, qPCR detection of S. pneumoniae psaA gene expression in tibia versus skull normalized to sham (mean ± SD; n=4; P value represents a Mann-Whitney two-tailed rank test). c, Flow cytometry gating. d, Quantitation of BrdU+ lineage- Sca-1+ c-kit+ hematopoietic progenitors (mean ± SD; n=11 sham, 12 meningitis; P values represent unpaired, two-tailed t-tests). e, Experimental outline. f, IVM of skull marrow at 4–6 hours after intracisternal injection of GFP+ Streptococcus pneumoniae JWV500. Vasculature was labeled with CD31/Sca-1 and CSF with IC ovalbumin. g, inset depicts large GFP+ bacterial areas (arrows)(f and g are representative data from 2 independent experiments). h, inset shows smaller GFP+ areas, presumably bacterial colonies (n=2). i, Experimental outline. Flow-sorted LSK underwent membrane staining encoding their genotype, Myd88−/− (green) and wild type LSK (magenta) were transferred to a recipient mouse in which meningitis was induced. IVM was done 48 hours after infection. j, Intravital microcopy images show less Myd88−/− LSK compared to wild type control LSK. k, Quantification of LSK (mean ± SD; n = 7 recipient mice, P value represents an unpaired, two-tailed t-test).
Figure 7.
Figure 7.. Summary cartoon.
CSF outflow occurs via dural perivascular spaces through skull channels into the cranial marrow. This route is usurped by bacteria during meningitis.

Comment in

Similar articles

Cited by

References

    1. Ransohoff RM, Kivisakk P & Kidd G Three or more routes for leukocyte migration into the central nervous system. Nat Rev Immunol 3, 569–581 (2003). - PubMed
    1. Engelhardt B, Vajkoczy P & Weller RO The movers and shapers in immune privilege of the CNS. Nat Immunol 18, 123–131 (2017). - PubMed
    1. Gres V, Kolter J, Erny D & Henneke P The role of CNS macrophages in streptococcal meningoencephalitis. J Leukoc Biol 106, 209–218 (2019). - PubMed
    1. Greenhalgh AD et al. Peripherally derived macrophages modulate microglial function to reduce inflammation after CNS injury. PLoS Biol 16, e2005264 (2018). - PMC - PubMed
    1. Wilson EH, Weninger W & Hunter CA Trafficking of immune cells in the central nervous system. J Clin Invest 120, 1368–1379 (2010). - PMC - PubMed

Publication types