. 2022 May;54(5):593-602.
doi: 10.1038/s41588-022-01051-w. Epub 2022 May 2.

Plasma proteome analyses in individuals of European and African ancestry identify cis-pQTLs and models for proteome-wide association studies

Affiliations

Plasma proteome analyses in individuals of European and African ancestry identify cis-pQTLs and models for proteome-wide association studies

Jingning Zhang et al. Nat Genet. 2022 May.

Abstract

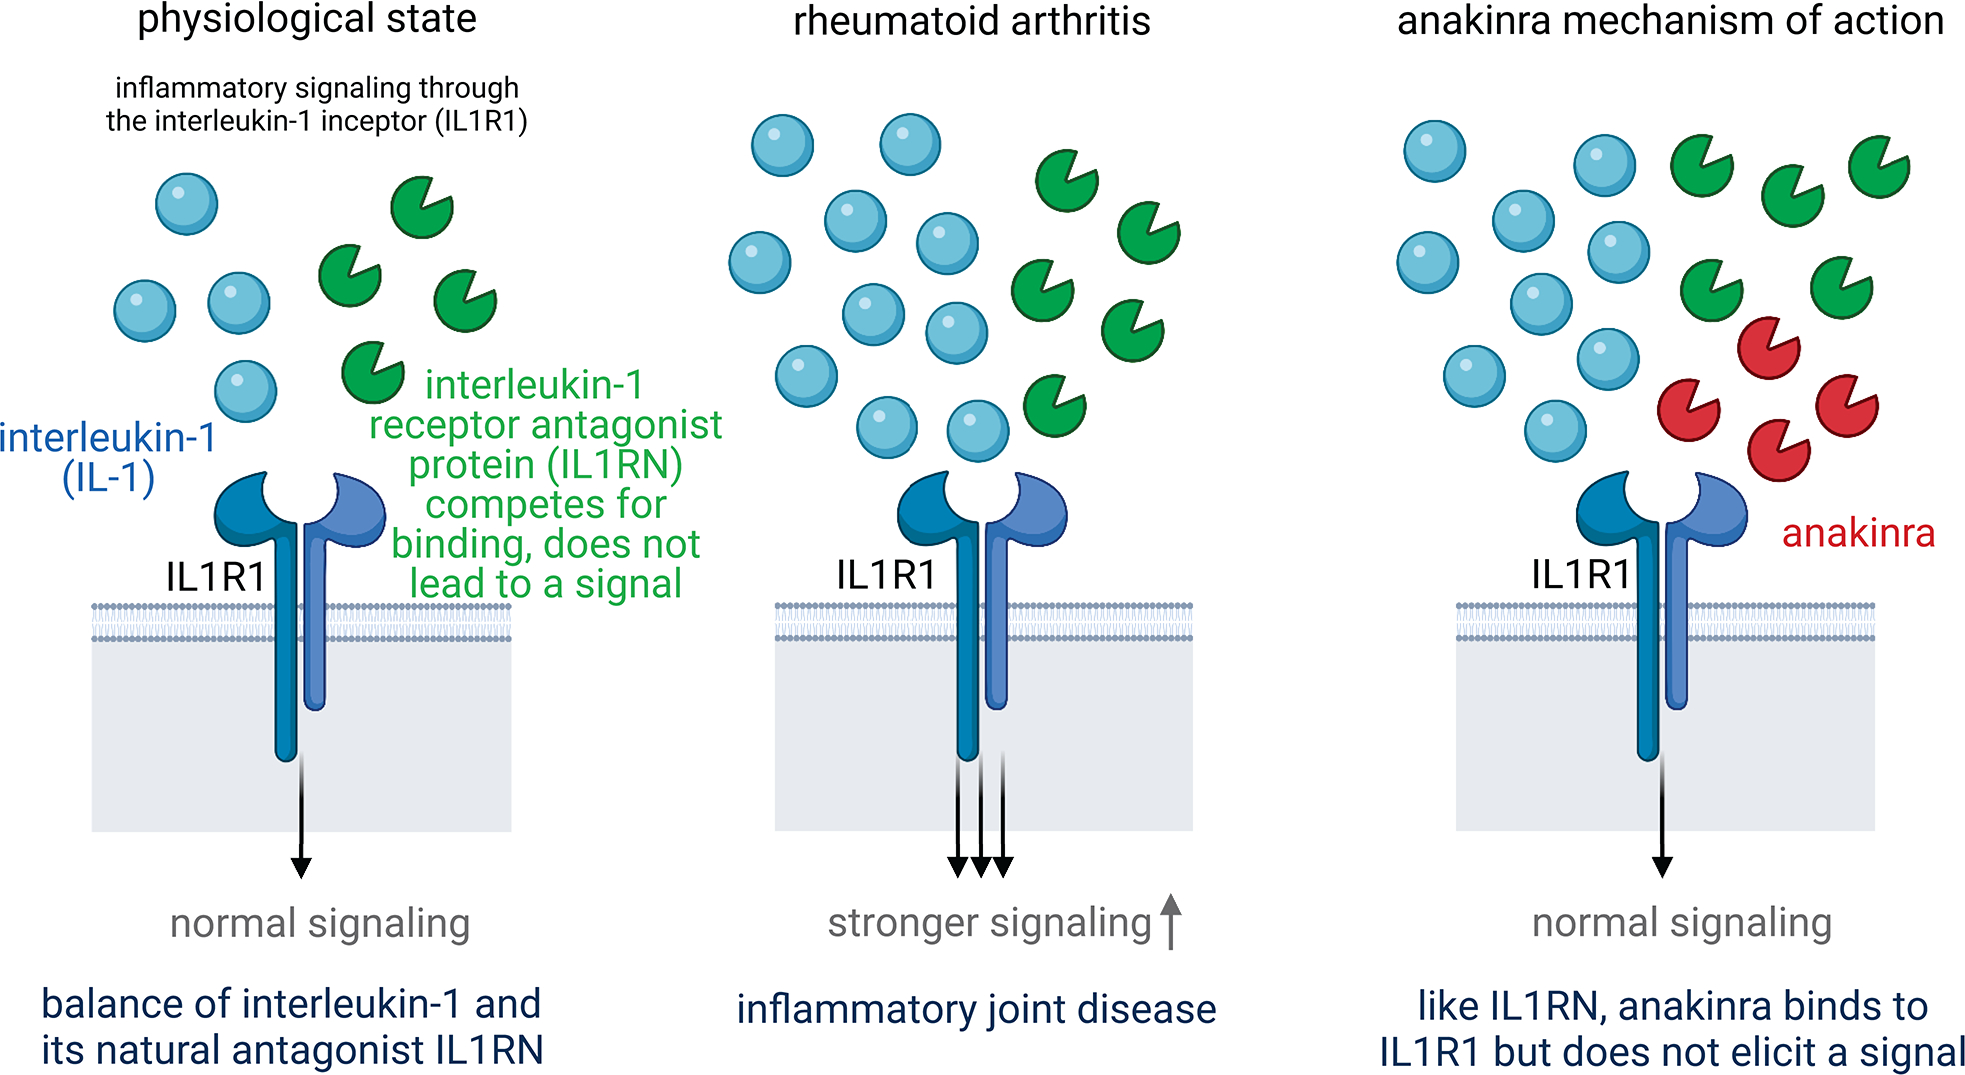
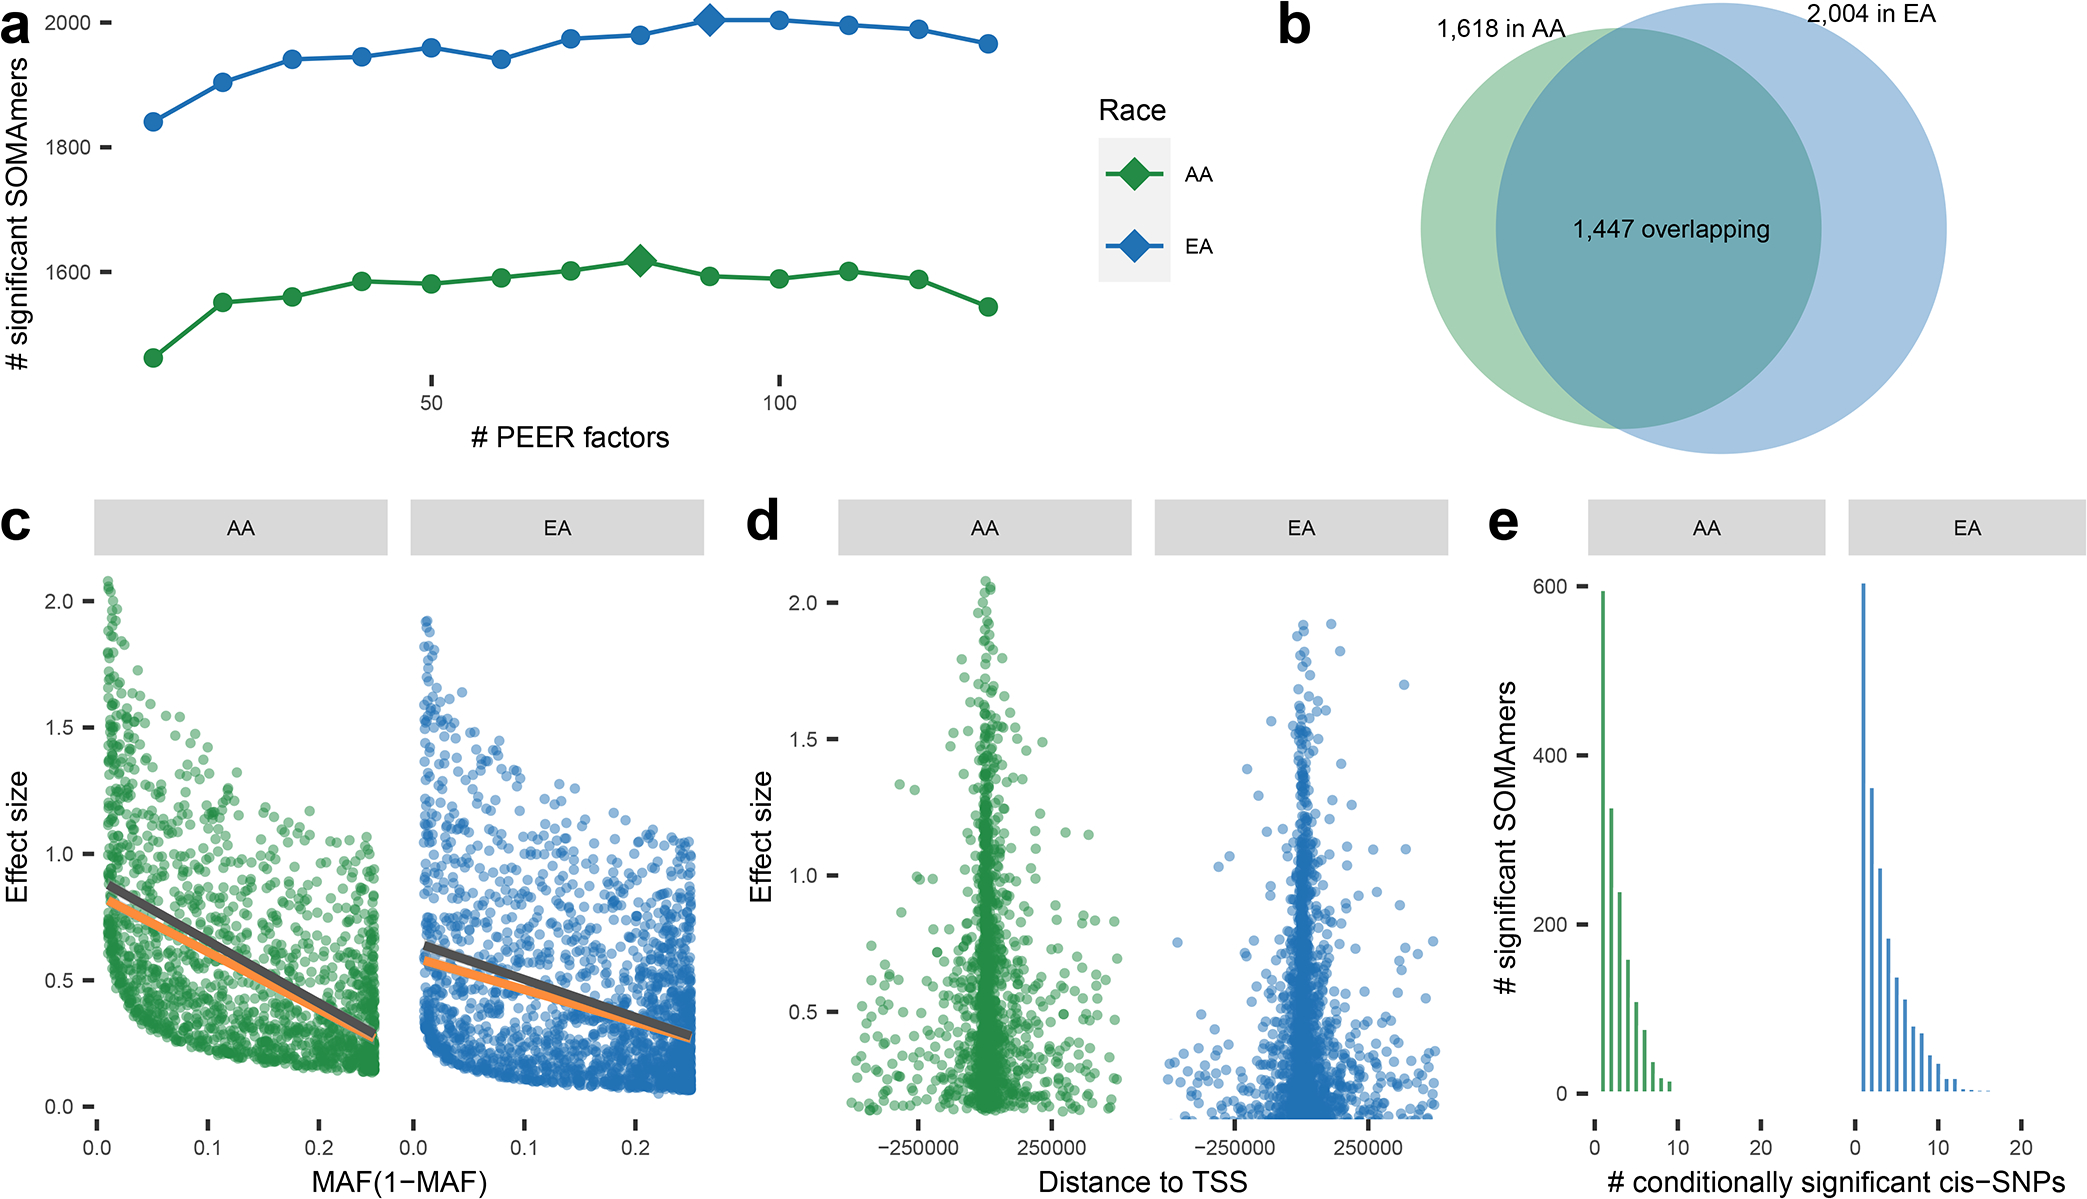
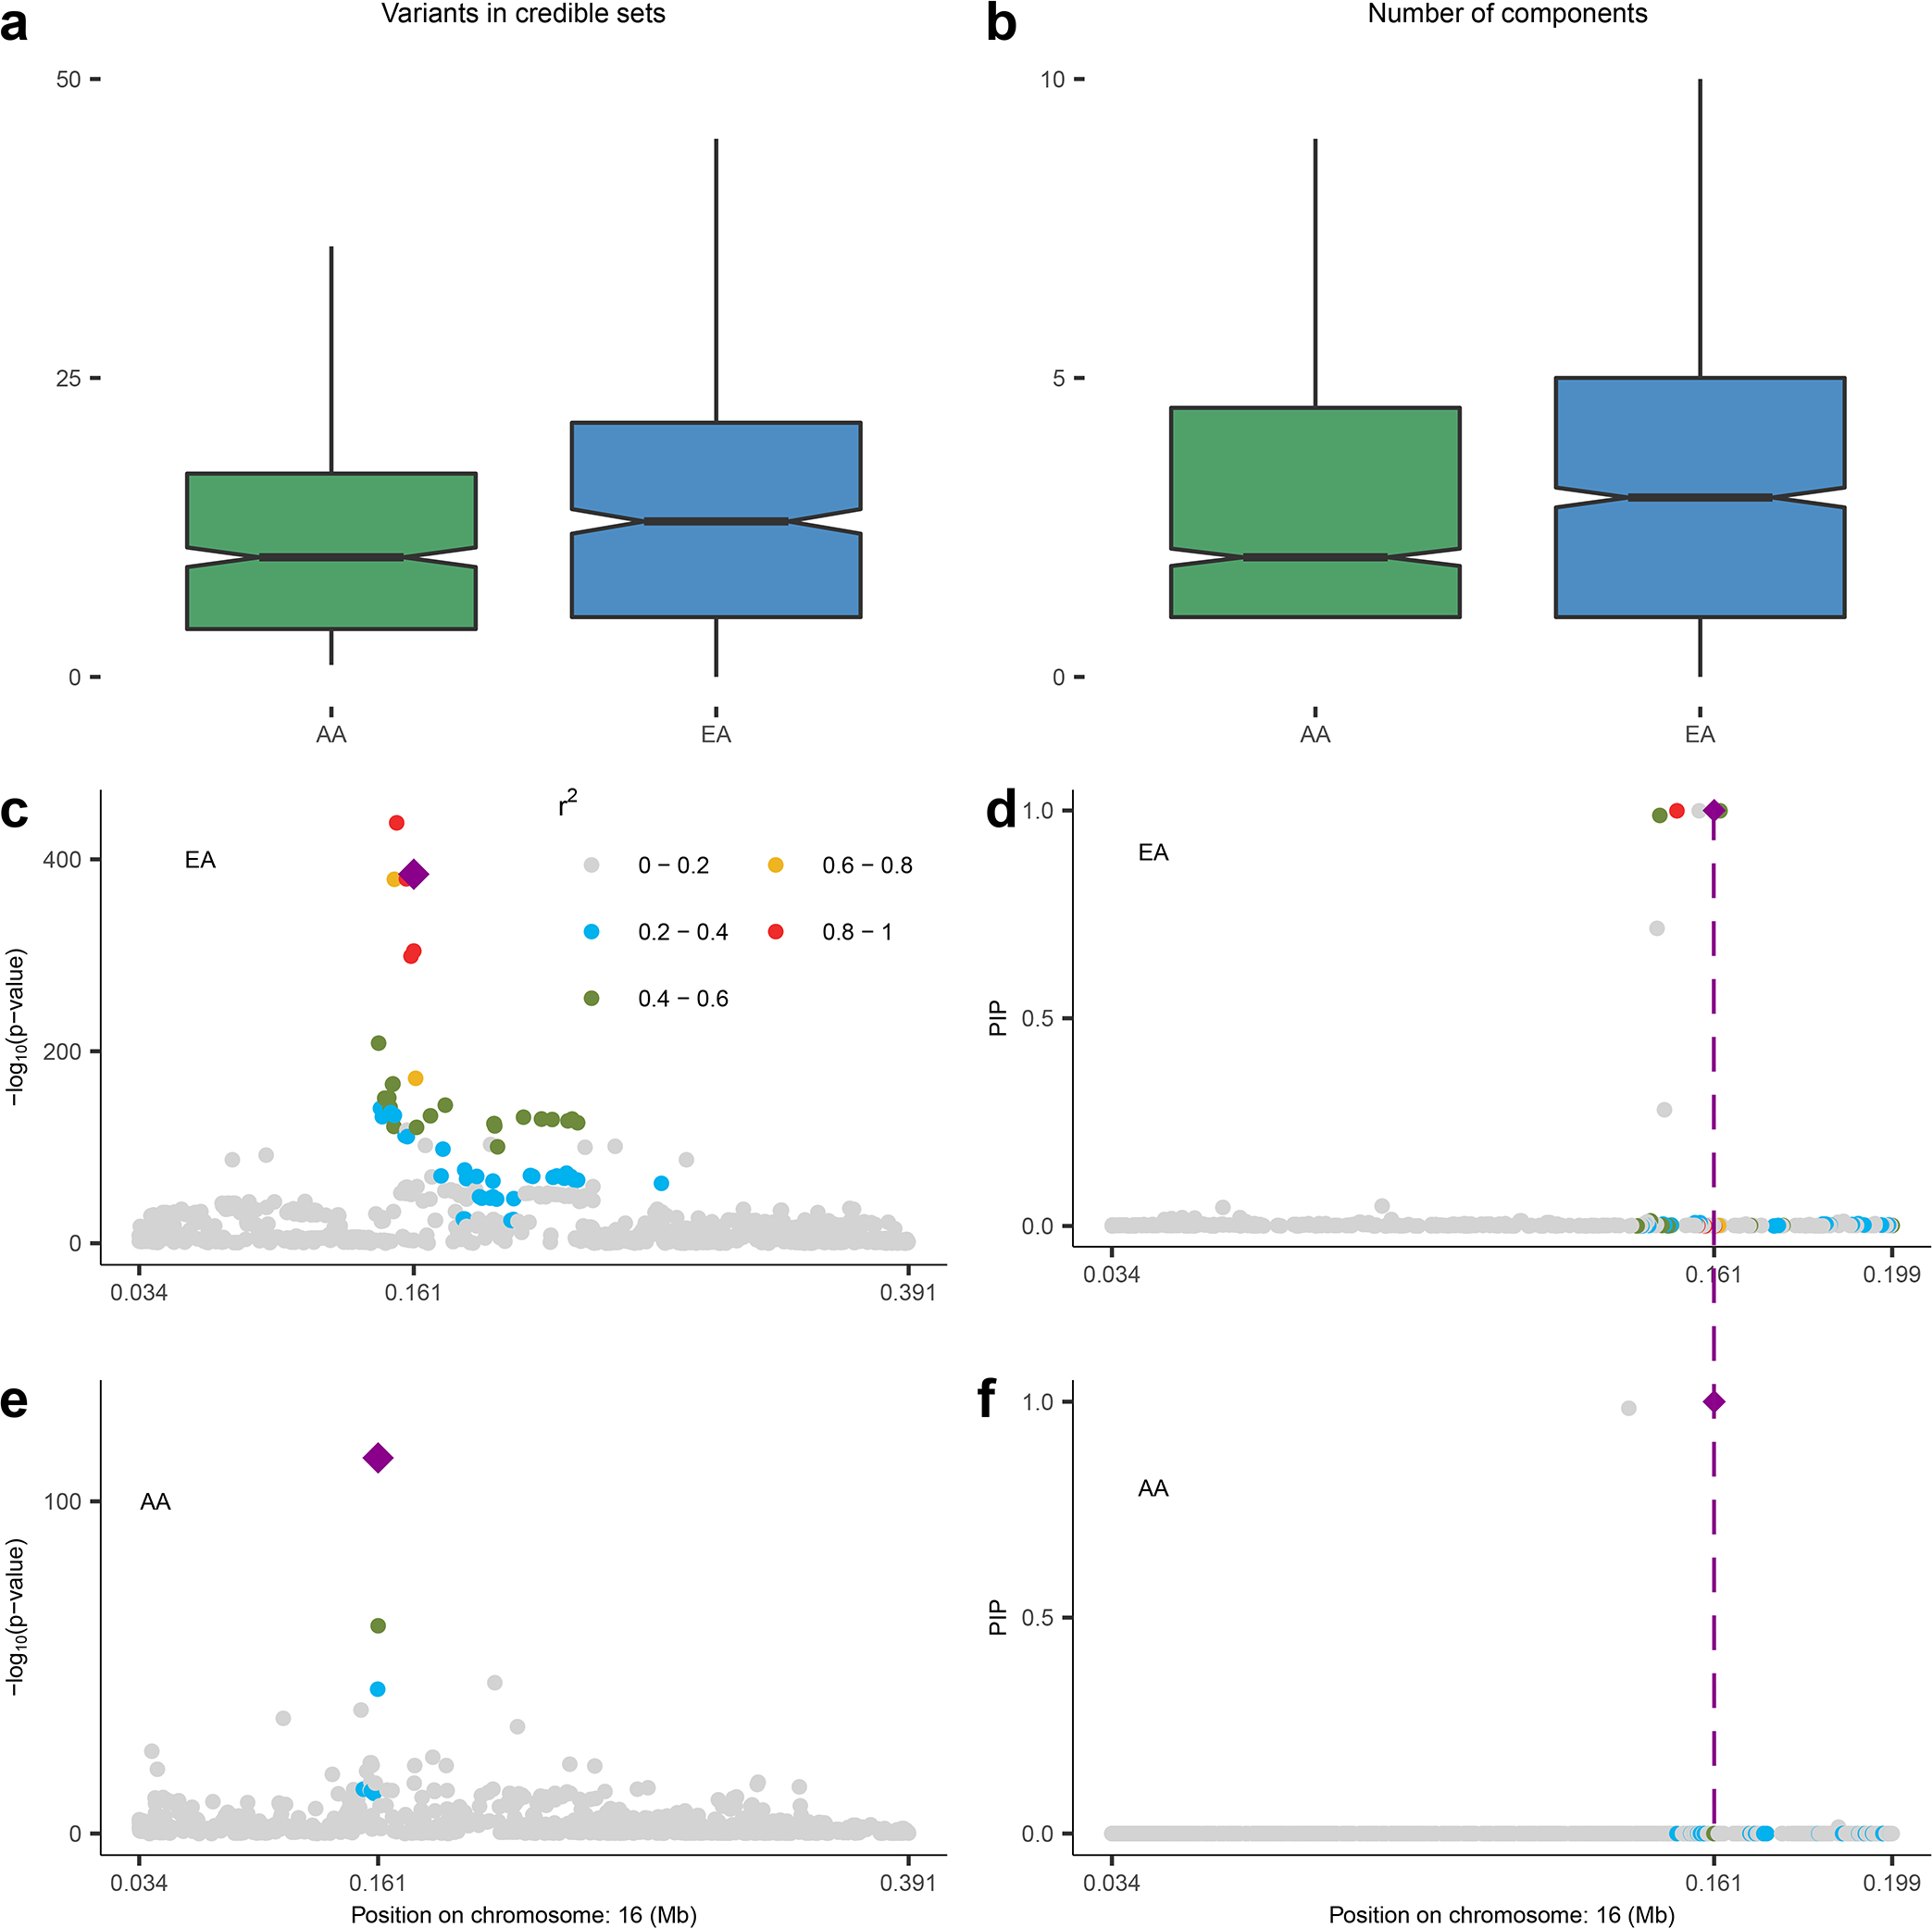
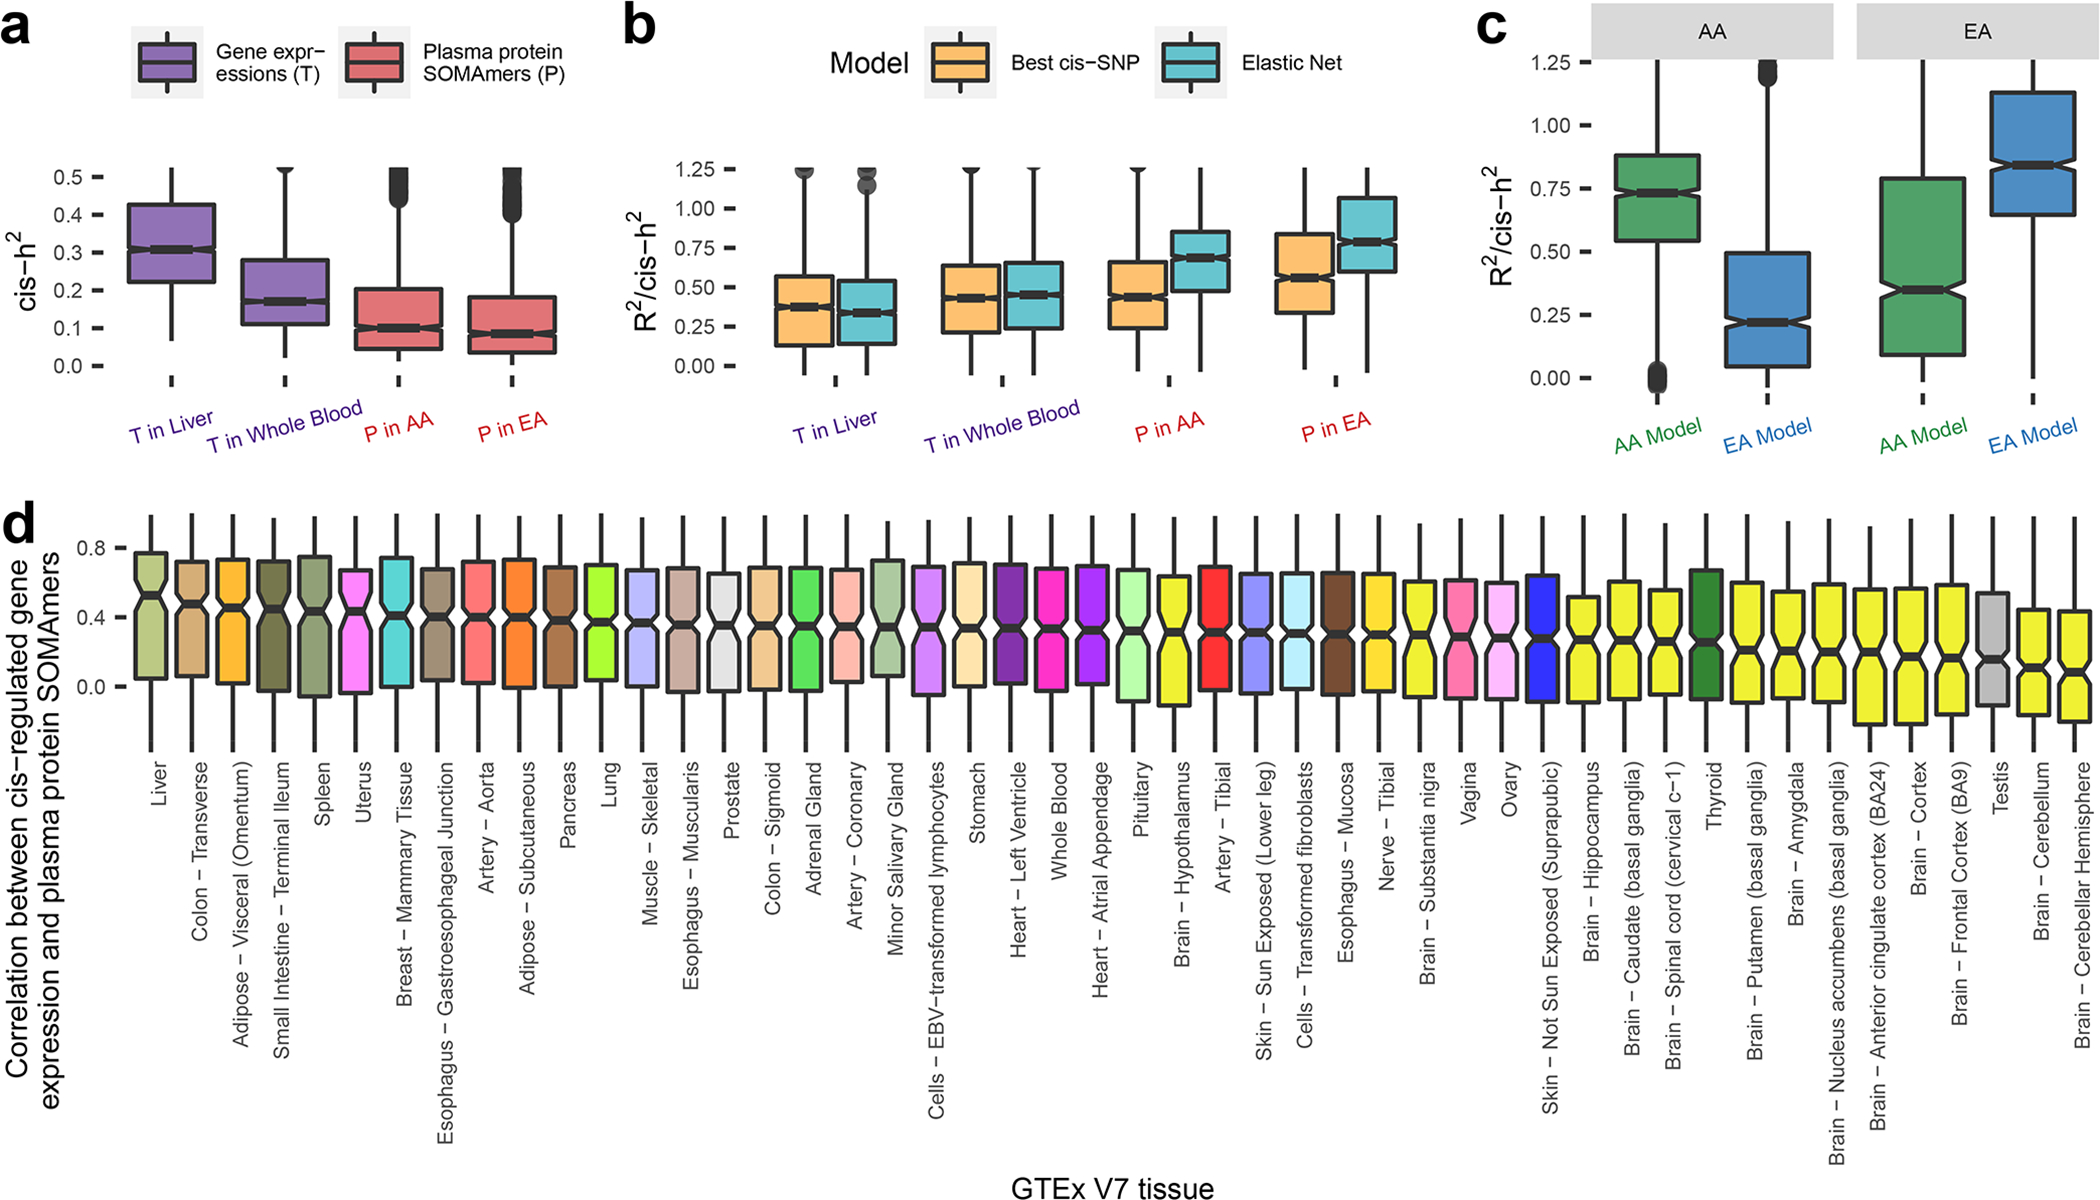
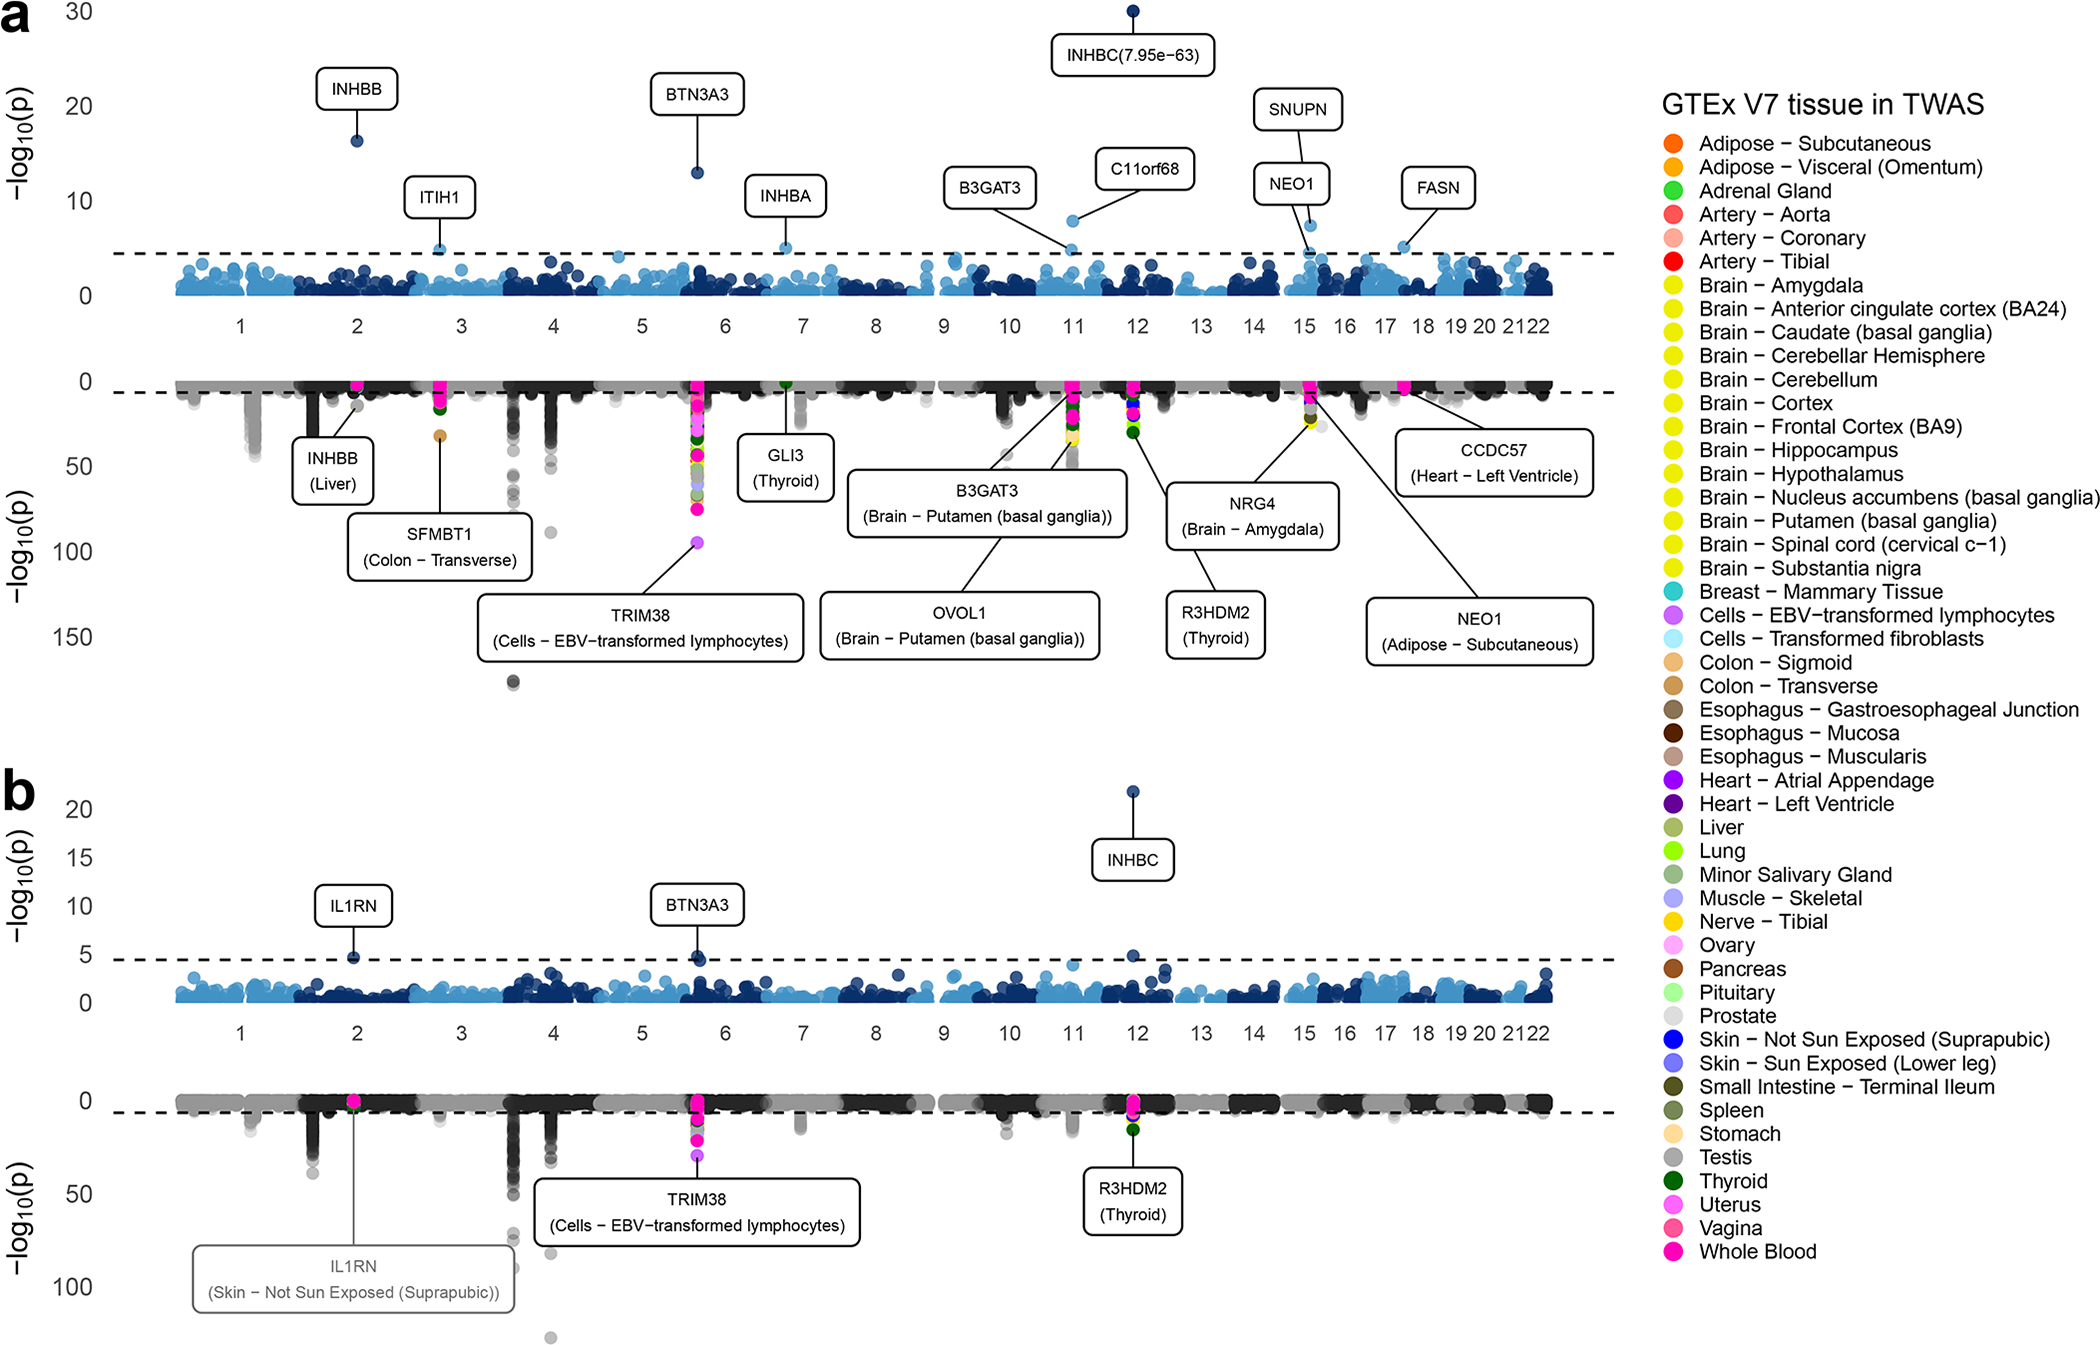
Improved understanding of genetic regulation of the proteome can facilitate identification of the causal mechanisms for complex traits. We analyzed data on 4,657 plasma proteins from 7,213 European American (EA) and 1,871 African American (AA) individuals from the Atherosclerosis Risk in Communities study, and further replicated findings on 467 AA individuals from the African American Study of Kidney Disease and Hypertension study. Here, we identified 2,004 proteins in EA and 1,618 in AA, with most overlapping, which showed associations with common variants in cis-regions. Availability of AA samples led to smaller credible sets and notable number of population-specific cis-protein quantitative trait loci. Elastic Net produced powerful models for protein prediction in both populations. An application of proteome-wide association studies to serum urate and gout implicated several proteins, including IL1RN, revealing the promise of the drug anakinra to treat acute gout flares. Our study demonstrates the value of large and diverse ancestry study to investigate the genetic mechanisms of molecular phenotypes and their relationship with complex traits.


Conflict of interest statement

Competing Interests Statement

Proteomic assays in ARIC were conducted free of charge as part of a data exchange agreement with Soma Logic. The authors declare no other competing interests.

Figures

Extended Data Fig. 1
Extended Data Fig. 1. Cis-pQTLs’ effect sizes across two populations
Effect sizes for common (MAF> 0.01) sentinel cis-pQTLs across EA and AA populations. Each dot represents a common sentinel SNP detected through either the EA (left panel) or the AA population (right panel). x-axis shows the effect size in the population through which the cis-pQTL is identified, and y-axis shows effect size in the other population. Minor allele frequencies (MAF) are checked for some outliers corresponding to large difference in allele frequency across populations (marked with orange). Red line is diagonal.
Extended Data Fig. 2
Extended Data Fig. 2. Overlap and colocalization of cis-pQTLs and cis-eQTLs
(a) Proportion of sentinel cis-pQTLs in EA (including their LD-proxies; SNPs with LD > 0.8) that are identified as cis-eQTLs across 49 different tissues in GTEx V8. Results are ordered by the size of overlap. (b) proportion of SOMAmers showing high colocalization probability (PP.H4 > 0.8) of underlying cis-pQTLS and cis-eQTLs in the same gene across tissues in GTEx (V8). Results are ordered by the size of overlap reported in (a) for ease of comparison.
Extended Data Fig. 3
Extended Data Fig. 3. Cis-pQTLs tended to be significant cis-eQTLs across multiple tissues
Distribution of number of tissues with significant cis-eQTL effects in GTEx V8 for the sentinel cis-pQTLs (and SNPs in high LD) (blue) compared to that of cis-eQTLs in GTEx V8 irrespective of their cis-pQTL status (red). Sentinel cis-pQTLs are restricted to those which show cis-eQTL effect in at least one tissue. cis-eQTL effects are evaluated for the same underlying genes for which significant cis-pQTLs are detected.
Extended Data Fig. 4
Extended Data Fig. 4. Functional enrichment
Functional enrichment of all sentinel cis-pQTLs and SNPs in high LD with them (r2 > 0.8) for EA (a) and AA (b). Functional enrichment of sentinel cis-pQTLs which have effects independent of protein altering variants are shown for EA (c) and AA (d). The red dots denote the estimated log2-enrichment statistic, and the black lines represent the corresponding 95% confidence intervals using TORUS (See Methods for details). Sample sizes for EA and AA population are n=7,213 and 1,871, respectively.
Extended Data Fig. 5
Extended Data Fig. 5. Cis-heritability comparison between gene expression and plasma protein levels
Comparison of cis- heritability (cis-h2) estimates of plasma protein (P) and gene expression (T) for a common set of overlapping genes. For each population, the overlap is defined by the set of genes that have significant cis-h2 for both plasma protein and gene expression in the given tissue (liver and whole blood) in GTEx (a) V7 and (b) V8. Sample sizes for EA and AA populations are n=7,213 and 1,871, respectively. In boxplots, the boxes are drawn from first and third quartiles, with the median at the center, and the whiskers extending to 1.5 times the interquartile range from the box boundaries. Figures are truncated in the y-axis at cis-h2=0 and 0.5 for better display.
Extended Data Fig. 6
Extended Data Fig. 6. Correlation between imputed gene expression and measured plasma protein levels in ARIC EA samples
Measured plasma protein levels are pre-processed by inverse-rank normalization and adjusted for covariates and 90 PEER factors. Gene expression imputation models for TWAS analyses across all tissues are built based on GTEx V7 datasets (see Supplementary Table 13 for available sample sizes). The imputation models for plasma proteins are built based n=7,213 EA individuals in the ARIC study. In boxplots, the boxes are drawn from first and third quartiles, with the median at the center, and the whiskers extending to 1.5 times the interquartile range from the box boundaries. Figure is truncated in the y-axis at correlation= −0.15 and 0.45 for better display.
Extended Data Fig. 7
Extended Data Fig. 7. Control of type-1 error of PWAS
Quantile-quantile plot (red diagonal line) of p-values are shown for a continuous phenotype that is simulated under the null hypothesis of no genetic association for unrelated European ancestry individuals in the UK Biobank study (n=337,484). Results are based on two-sided z-tests of association between the cis-genetic regulated plasma protein level and the simulated null trait. The diagonal line represents expected p-values under the null hypothesis of no genetic association and the 95% confidence band, which is calculated based on standard errors of order statistics under normal approximation, represents regions of uncertainty in the q-q plot under the null hypothesis of no association.
Extended Data Fig. 8
Extended Data Fig. 8. PWAS of serum urate level and gout
Quantile-quantile plots of PWAS p-values obtained from two-sided z-tests of association between the cis-genetic regulated plasma protein levels and the trait of interest, serum urate level (n=288,649) and gout (n=754,056). The diagonal lines represent expected p-values under the null hypothesis of no genetic association and the 95% confidence bands, which is calculated based on standard errors of order statistics under normal approximation, represent regions of uncertainty in the q-q plot under the null hypothesis of no association.
Extended Data Fig. 9
Extended Data Fig. 9. PWAS identify repurposing opportunity for anakinra to treat gout
Blue particle is interleukin-1 (IL-1) which produces pro-inflammatory effect of interleukin-1 signaling. Green particle is interleukin-1 receptor antagonist protein (IL1RN) which competes for binding but does not lead to a signal. Red particle is anakinra which has same shape as IL1RN and can also bind to the IL1R1 without eliciting a signal. Anakinra is a synthetic drug that mimics the function of the natural protein IL1RN. It is approved for treating rheumatoid arthritis. Our study shows that genetically higher IL1RN levels show protection from gout. This suggests that anakinra may also be effective to treat gout (repurposing). Plot was created with BioRender.com.
Extended Data Fig. 10
Extended Data Fig. 10. Top five genetic principal components (PC) of ARIC data
Genetic PCs represent the major population structure in the aggregated sample of EA (blue) and AA (green) populations, colored by self-reported ancestry.
Fig. 1:
Fig. 1:. Cis-pQTL analysis
Cis-pQTL analysis overview (n = 7,213 and 1,871 for EA and AA, respectively, in ARIC). (a) Number of SOMAmers detected to have significant cis-pQTLs versus number of PEER factors used in models. Diamonds mark the numbers of PEER factors used in the following analysis which identify maximal number of significant SOMAmers. (b) Venn diagram of significant SOMAmers in EA and AA populations. (c) Effect sizes of sentinel cis-SNPs of pQTLs v.s. minor allele frequencies (MAF(1-MAF)). Lines are fitted with (orange) and without inverse-power weighting (dark grey). (d) Effect sizes of sentinel cis- SNPs of pQTLs v.s. distance to TSS. (e) Number of conditional independent cis-pQTLs per significant SOMAmer.
Fig. 2:
Fig. 2:. Fine-mapping analysis
(a) Distribution of size of credible sets and (b) that of number of independent SuSIE clusters across 1,447 SOMAmers that have at least one significant cis-pQTL in both EA and AA populations. The boxes in (a-b) are drawn from first and third quartiles, with the median at the center, and the whiskers extending to 1.5 times the interquartile range from the box boundaries. The power of fine-mapping using data from two populations is further illustrated using the example of HBZ. Regional Manhattan plots are shown based on single SNP p-value, obtained from two-sided z-test of association, and SuSIE posterior probabilities for EA (Panel c and d) and AA (Panel e and f) populations. The SNP rs2541645 (chr16: 161106; marked in diamond shape throughout) is detected as the shared causal cis-pQTL across the two ancestries using posterior probabilities computed by MANTRA (See Methods for more details). The legend for the range of r2 between other SNPs and rs2541645 is shown at the upper right corner in (c). Sample sizes for EA and AA populations are n = 7,213 and 1,871, respectively.
Fig. 3:
Fig. 3:. Cis-heritability and evaluation of models for genetic prediction of proteins
Cis-heritability (cis-h2) estimates and genetic imputation models are obtained using GTEx V7 data for gene expression levels, and ARIC data for plasma protein levels. Sample sizes for gene expression levels across GTEx V7 tissues are provided in Supplementary Table 13, and those for plasma protein levels in EA and AA in ARIC are n = 7,213 and 1,871, respectively. (a) Estimated cis-h2 for gene expression levels and plasma protein levels. (b) Prediction R2, standardized by estimated cis-h2 (R2/cis-h2), using imputation models trained by: the most significant cis-SNP; and Elastic Net using all cis-SNPs. (c) Cross-ancestry prediction accuracy by applying imputation models built from one population to the other population. (d) Cis-regulated genetic correlation between plasma proteins and expression levels for underlying genes across all GTEx (V7) tissues estimated based on 1000Genomes reference European samples (n = 498). Additional results using preliminary models available from GTEx V8 can be found in Supplementary Table 15.1. In boxplots, the boxes are drawn from first and third quartiles, with the median at the center, and the whiskers extending to 1.5 times the interquartile range from the box boundaries. Figures are truncated in the y-axis at cis-h2=0 and 0.5 in (a), R2/cis-h2=0 and 1.25 in (b-c), correlation = −0.25 and 1 in (d) for better display. Cis-h2 (a) and imputation model performances (b-d) are shown only for those gene expressions or plasma proteins which show significance cis-h2 (p-value < 0.01 in likelihood ratio test examining the significance of the random effect component in GCTA model). Exact cis-h2 estimates and p-values of their significance are provided in Supplementary Table 11 for plasma protein levels, and those for gene expression levels can be obtained from FUSION/TWAS imputation models available from http://gusevlab.org/projects/fusion/#reference-functional-data, accession date Jul 28th 2021.
Fig. 4:
Fig. 4:. Miami plots for PWAS and TWAS analyses for serum urate level and gout
Miami plot for PWAS (upper) and TWAS (lower) of (a) urate and (b) gout. Each point represents a p-value for a two-sided z-test of association between the phenotypes and the cis-genetic regulated plasma protein or expression level of a gene, ordered by genomic position on the x axis and the -log10(p-value) for the association strength on the y axis. The black horizontal dash lines are the significance threshold after Bonferroni correction for the total number of imputation models (p-value = 3.7×10⁻⁵ for PWAS and 2.1×10⁻⁷ for TWAS). Urate PWAS and TWAS in (a) are truncated in the y-axis at -log10(p-value) = 30 and -log10(p-value) = 150 for better display. Nearby TWAS genes (+/− 500Kb) for significant PWAS genes are colored by GTEx tissues. The most significant nearby-TWAS gene is labelled with its gene name and corresponding tissue. The TWAS of IL1RN does not reach TWAS significance threshold and thereby was labeled with grey. All primary TWAS analyses are conducted based on established models developed using data from GTEx V7, and results for the identified top genes/tissue combinations are further validated using preliminary models available from GTEx V8 (Supplementary Table 16). To reduce the size of the figure, we have plotted only a fraction of the points for the TWAS results which were highly insignificant (p-value> 0.05).

Similar articles

Cited by

References

    1. Buniello A et al. The NHGRI-EBI GWAS Catalog of published genome-wide association studies, targeted arrays and summary statistics 2019. Nucleic Acids Res. 47, D1005–D1012 (2019). - PMC - PubMed
    1. Visscher PM et al. 10 years of GWAS discovery: biology, function, and translation. The American Journal of Human Genetics 101, 5–22 (2017). - PMC - PubMed
    1. Zhang F & Lupski JR Non-coding genetic variants in human disease. Hum. Mol. Genet. 24, R102–R110 (2015). - PMC - PubMed
    1. Tak YG & Farnham PJ Making sense of GWAS: using epigenomics and genome engineering to understand the functional relevance of SNPs in non-coding regions of the human genome. Epigenetics & chromatin 8, 1–18 (2015). - PMC - PubMed
    1. Musunuru K et al. From noncoding variant to phenotype via SORT1 at the 1p13 cholesterol locus. Nature 466, 714–719 (2010). - PMC - PubMed

Publication types