. 2022 May 2;5(1):407.
doi: 10.1038/s42003-022-03358-0.

Statistical parametrization of cell cytoskeleton reveals lung cancer cytoskeletal phenotype with partial EMT signature

Affiliations

Statistical parametrization of cell cytoskeleton reveals lung cancer cytoskeletal phenotype with partial EMT signature

Arkaprabha Basu et al. Commun Biol. .

Abstract

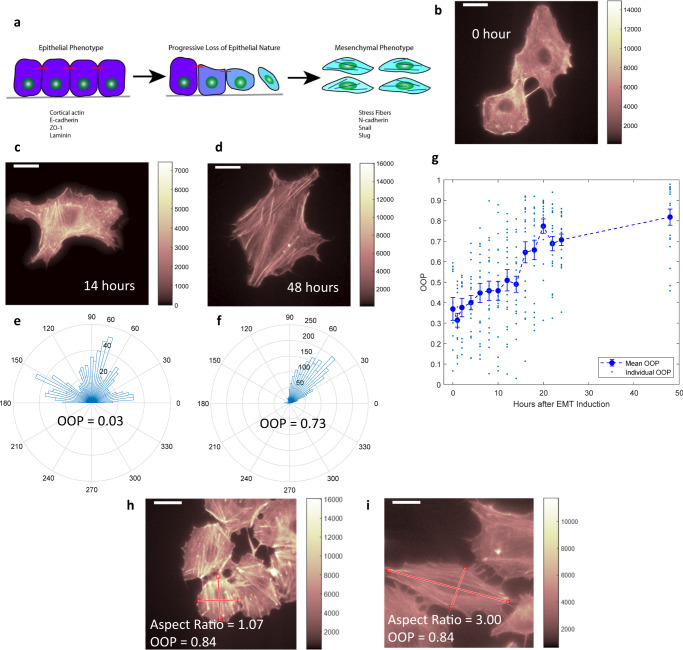
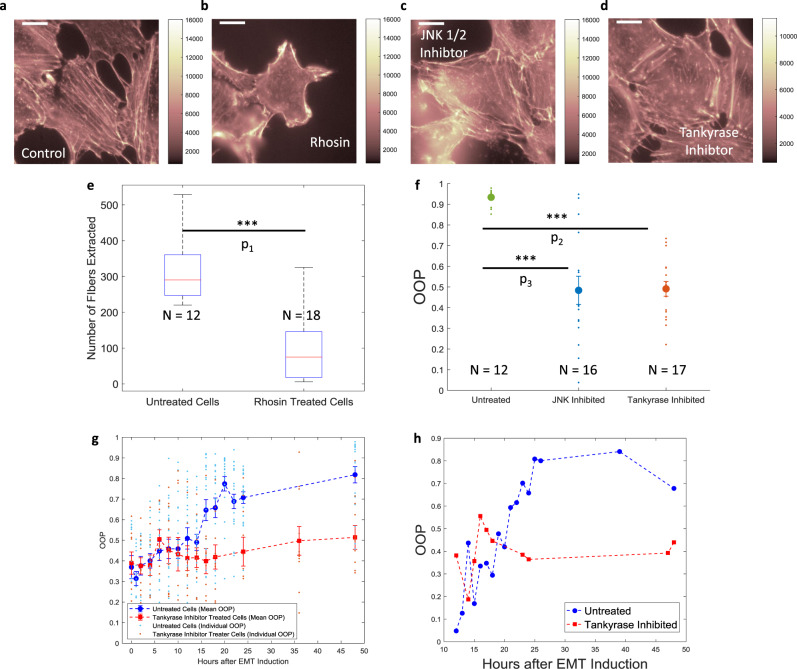
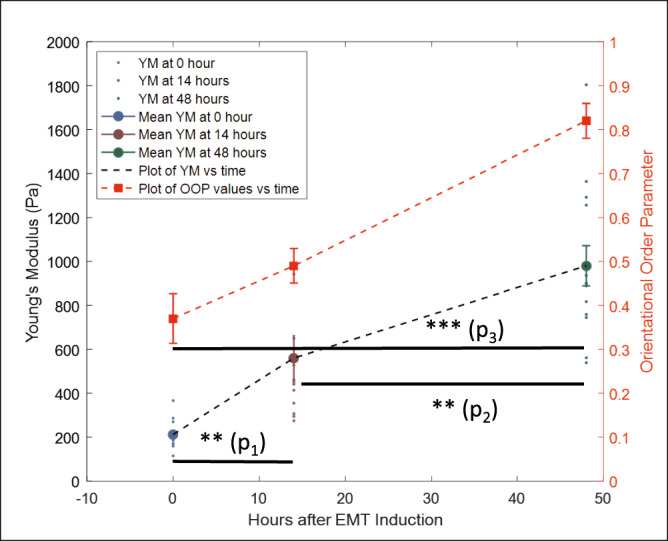
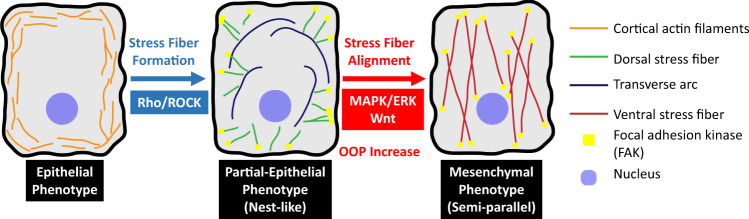
Epithelial-mesenchymal Transition (EMT) is a multi-step process that involves cytoskeletal rearrangement. Here, developing and using an image quantification tool, Statistical Parametrization of Cell Cytoskeleton (SPOCC), we have identified an intermediate EMT state with a specific cytoskeletal signature. We have been able to partition EMT into two steps: (1) initial formation of transverse arcs and dorsal stress fibers and (2) their subsequent conversion to ventral stress fibers with a concurrent alignment of fibers. Using the Orientational Order Parameter (OOP) as a figure of merit, we have been able to track EMT progression in live cells as well as characterize and quantify their cytoskeletal response to drugs. SPOCC has improved throughput and is non-destructive, making it a viable candidate for studying a broad range of biological processes. Further, owing to the increased stiffness (and by inference invasiveness) of the intermediate EMT phenotype compared to mesenchymal cells, our work can be instrumental in aiding the search for future treatment strategies that combat metastasis by specifically targeting the fiber alignment process.


Conflict of interest statement

The authors declare no competing interests.

Figures

Fig. 1
Fig. 1. Identification and quantification of cytoskeletal phenotypes.
a Cartoon image of cells undergoing EMT with formation of stress fibers and up/downregulation of proteins. bd Fluorescent images of A549 cells stained with phalloidin after 0, 14, and 48 h of TGFβ1 induced EMT, respectively. e, f Angular distribution of stress fibers and corresponding Orientational Order Parameter (OOP) values for cells shown in (c, d), respectively. g Plot of OOP values for a cell population against time of TGFβ1 treatment. Mean values are reported and error bars correspond to standard error values for every timepoint. n = 12 (for 0 h), n = 15 (for 1 h), n = 13 (for 2 h), n = 20 (for 4 h), n = 19 (for 6 h), n = 20 (for 8 h), n = 22 (for 10 h), n = 20 (for 12 h), n = 22 (for 14 h), n = 22 (for 16 h), n = 20 (for 18 h), n = 19 (for 20 h), n = 23 (for 22 h), n = 20 (for 24 h), and n = 19 (for 48 h). h, i Fluorescent images of two cells stained with phalloidin with highly aligned stress fibers (similar OOP values) but drastically difference aspect ratios. Scale bar: 16 μm.
Fig. 2
Fig. 2. Focal Adhesion Kinase (FAK) pattern reveals types of stress fibers.
a Cartoon representation of stress fibers and actin-binding proteins. b Fluorescent image of a cell with disoriented actin stress fibers (OOP = 0.32). c Fluorescent image of FAK of the same cell shown in (b) showing FAK spots near the cell edge. d Overlay image of actin (magenta) and FAK (green) of the same cell shown in (b) showing stress fibers with zero or one FAK capping. e Fluorescent image of cell with semi-parallel actin stress fibers (OOP = 0.90). f Fluorescent image of FAK of the same cells shown in (e) showing FAK spots throughout the cell. g Overlay of actin (magenta) and FAK (green) for the same cell shown in (e) showing FAK spots on both ends of stress fibers. Scale bar: 16 μm.
Fig. 3
Fig. 3. Tracking phenotypic transition in single cell stained with SiR-actin.
a, b A single A549 cell stained with SiR-actin after 14 h and 48 h of TGFβ1 addition respectively. c, d Extracted stress fiber image from (a, b), respectively. e, f Angular distribution and OOP values of the cells shown in (a, b), respectively. g Plot of OOP values of a live cell (shown in (af)) against time of TGFβ1 treatment (red). Multiple live-cell OOP trajectories (gray) against the time of TGFβ1 treatment. Scale bar: 16 μm.
Fig. 4
Fig. 4. Quantification of drug response of EMT over 48 h.
ad A549 cells stained with phalloidin after 48 h of EMT induction in the presence of no drug (a), Rhosin (b), JNK 1/2 Inhibitor (c), and Tankyrase Inhibitor (d). e Boxplot comparison of the number of stress fibers extracted from control (no drug) cells vs Rhosin treated cells. Red lines inside the boxes correspond to the median values, the bottom and top edges of the boxes correspond to the 25th and 75th percentiles respectively, the whiskers are extended to the most extreme data that is not considered an outlier in each direction. f Plot showing the OOP values of control cells (green) and cells treated with JNK 1/2 inhibitor (blue) and Tankyrase inhibitor (red). Mean of the distributions is shown as larger dots of the same color and the error bars correspond to standard error values. g Plots of individual and mean OOP values against the time of a cell population undergoing EMT with (red) and without (blue) the presence of Tankyrase Inhibitor. Error bars correspond to standard errors at each timepoint. For untreated cells, the sample size at each timepoint is same as reported in Fig. 1g. For Tankyrase inhibited cells: n = 9 (for 0 h), n = 12 (for 2 h), n = 11 (for 4 h), n = 9 (for 6 h), n = 11 (for 8 h), n = 11 (for 10 h), n = 11 (for 12 h), n = 11 (for 14 h), n = 10 (for 16 h), n = 12 (for 18 h), n = 10 (for 24 h), n = 11 (for 36 h), and n = 9 (for 48 h). h Plots of OOP values against the time of a single cell undergoing EMT with (red) and without (blue) the presence of Tankyrase Inhibitor. Scale bar: 16 μm. *P < 0.05, **P < 0.01, ***P < 0.001. P1 =  1.85 × 10−6, P2 = 1.28 × 10−10, P3 = 6.24 × 10−6.
Fig. 5
Fig. 5. Measurement of elastic properties of cells.
Young’s Modulus values at 0 (blue) (n = 15), 14 (brown) (n = 13), and 48 (green) (n = 14) hours after EMT induction using TGFβ1 showing their mean and standard errors along with a plot of the mean values. Young’s modulus values were extracted from AFM force curve measurements. Plot of mean OOP values for cell populations against hours after EMT (red) showing mean values and standard errors at 0, 14, and 48 h timepoints. Sample sizes for OOP values are same as reported in Fig. 1g. *P < 0.05, **P < 0.01, ***P < 0.001. P1 = 0.0012, P2 = 0.0048, P3 = 3.6 × 10−9.
Fig. 6
Fig. 6. Schematic of cytoskeletal reorganization in EMT.
Schematic of the cytoskeletal reorganization, relevant genetic pathways and increase of OOP during Epithelial–Mesenchymal Transition of A549 cells.

Similar articles

Cited by

References

    1. Martínez-Jiménez F, et al. A compendium of mutational cancer driver genes. Nat. Rev. Cancer. 2020;20:555–572. doi: 10.1038/s41568-020-0290-x. - DOI - PubMed
    1. Lugano R, Ramachandran M, Dimberg A. Tumor angiogenesis: causes, consequences, challenges and opportunities. Cell. Mol. Life Sci. 2020;77:1745–1770. doi: 10.1007/s00018-019-03351-7. - DOI - PMC - PubMed
    1. Hanahan D, Weinberg RA. Hallmarks of cancer: the next generation. Cell. 2011;144:646–674. doi: 10.1016/j.cell.2011.02.013. - DOI - PubMed
    1. Hart I, Saini A. Biology of tumour metastasis. The Lancet. 1992;339:1453–1457. doi: 10.1016/0140-6736(92)92039-I. - DOI - PubMed
    1. Ko, J., Winslow, M. M. & Sage, J. Mechanisms of small cell lung cancer metastasis. EMBO Mol. Med. 13, e13122 (2021). - PMC - PubMed

Publication types