. 2022 Jul;6(7):866-877.
doi: 10.1038/s41559-022-01740-z. Epub 2022 May 2.

Sugars dominate the seagrass rhizosphere

Affiliations

Sugars dominate the seagrass rhizosphere

E Maggie Sogin et al. Nat Ecol Evol. 2022 Jul.

Abstract

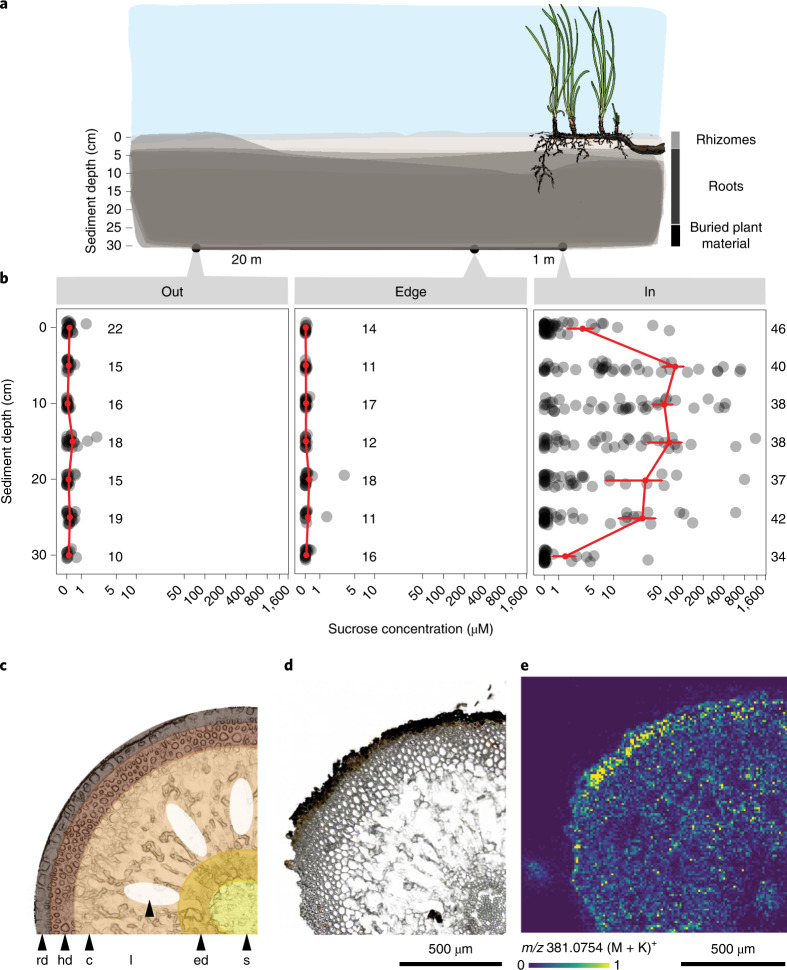
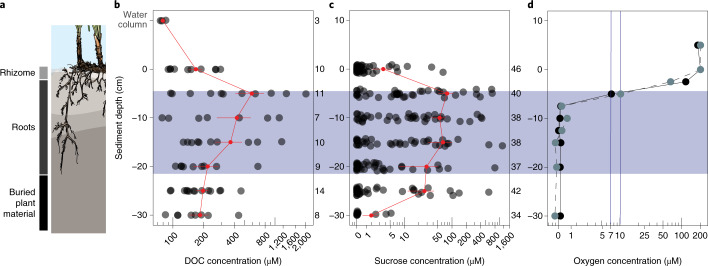
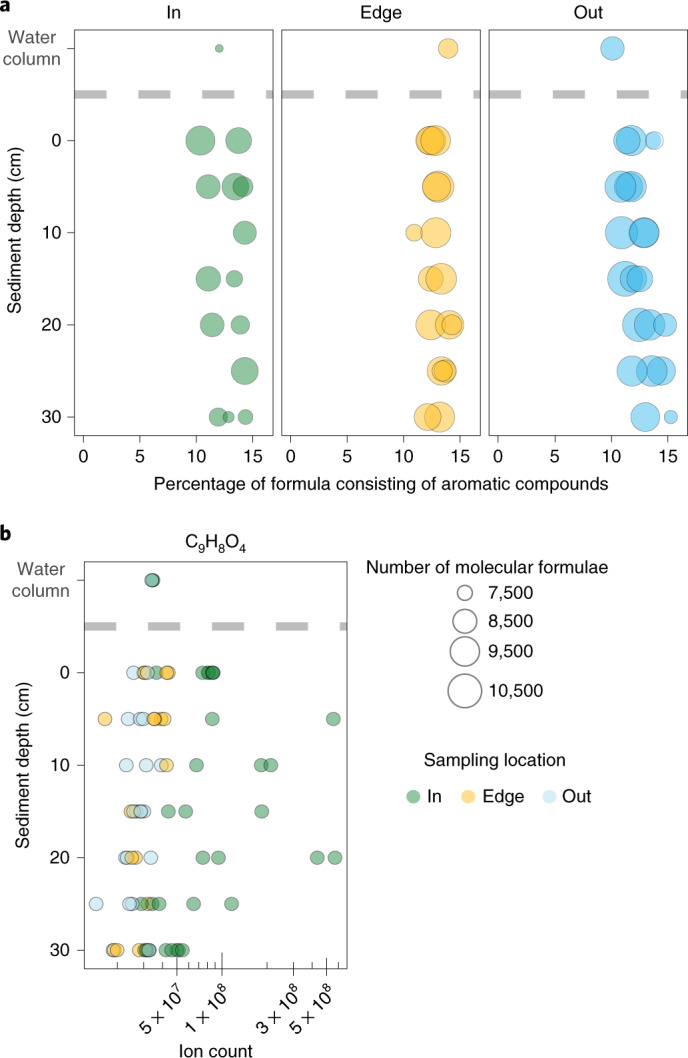
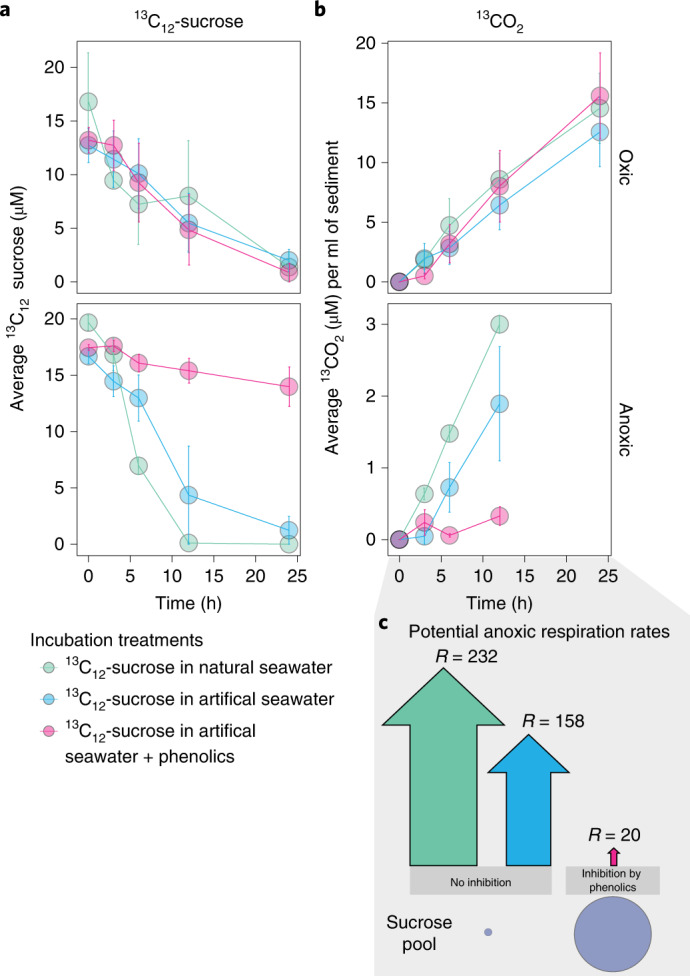
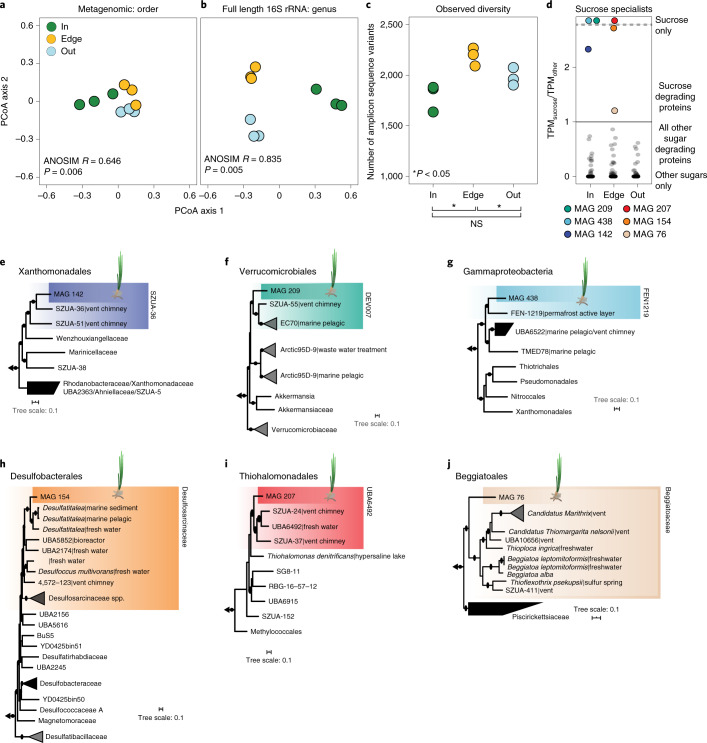
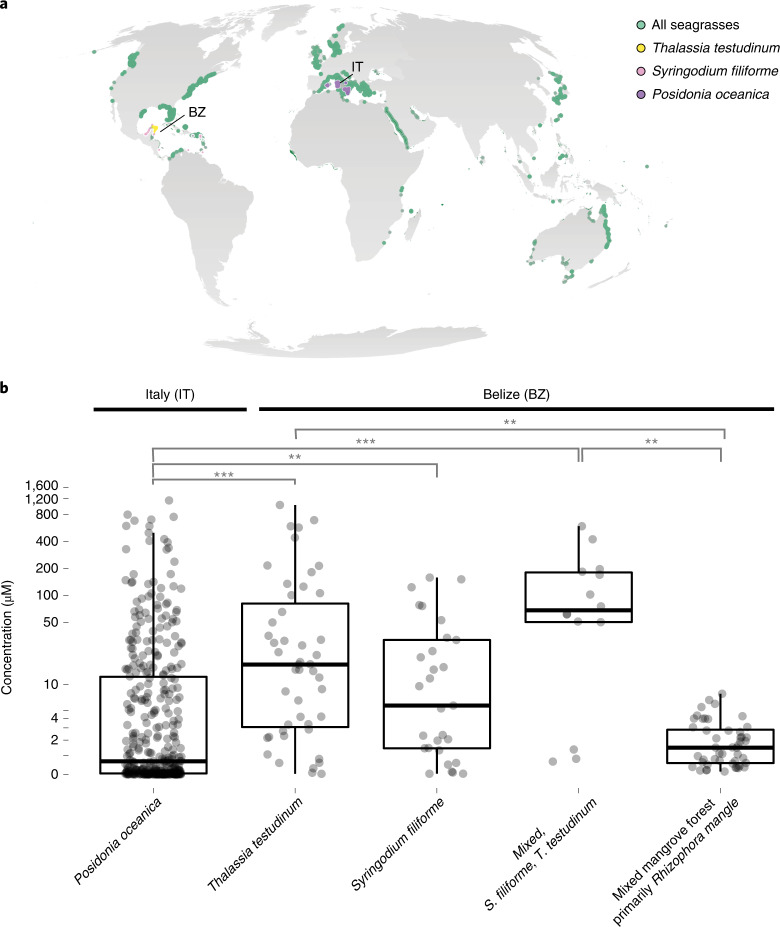
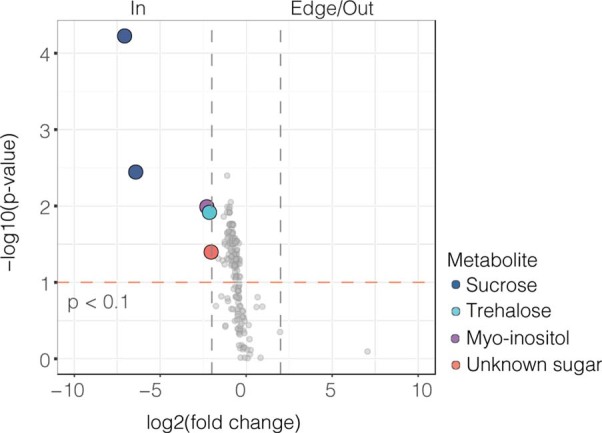
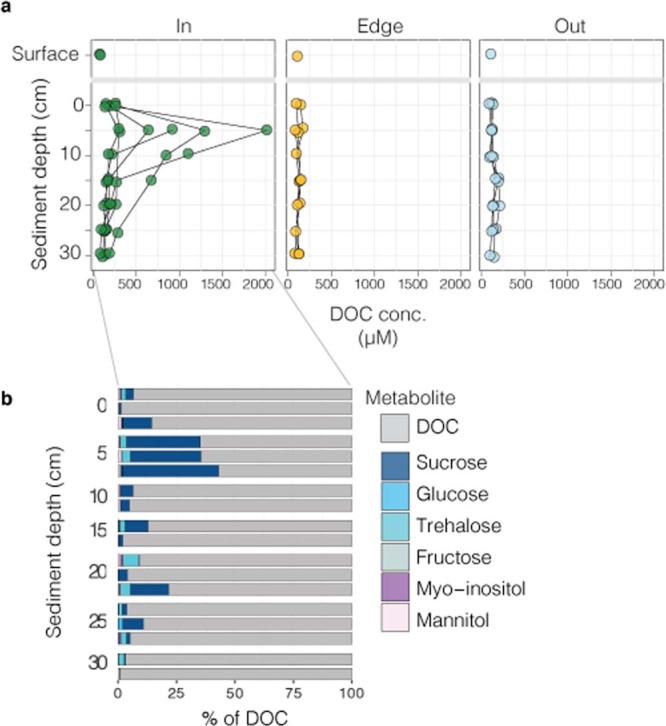
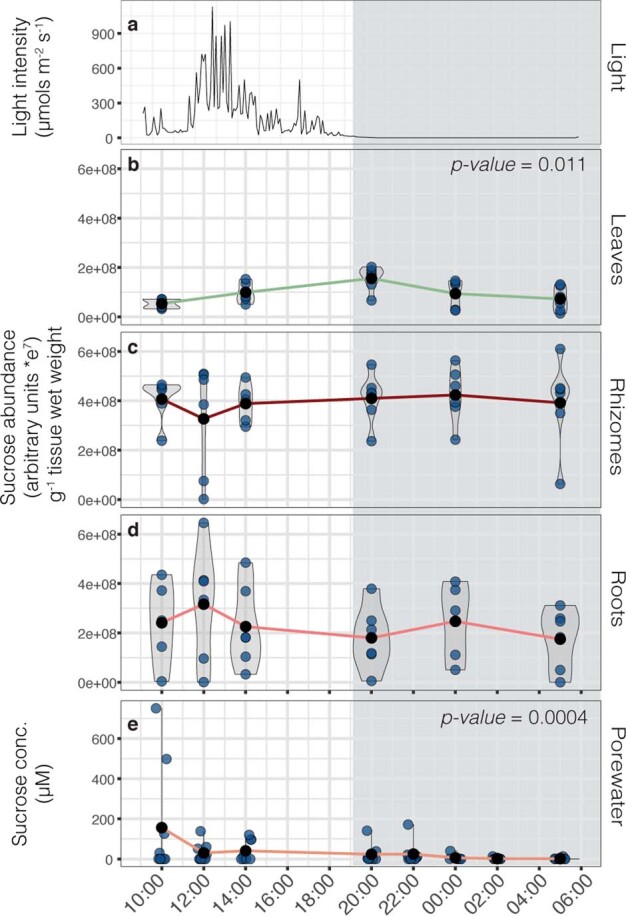
Seagrasses are among the most efficient sinks of carbon dioxide on Earth. While carbon sequestration in terrestrial plants is linked to the microorganisms living in their soils, the interactions of seagrasses with their rhizospheres are poorly understood. Here, we show that the seagrass, Posidonia oceanica excretes sugars, mainly sucrose, into its rhizosphere. These sugars accumulate to µM concentrations-nearly 80 times higher than previously observed in marine environments. This finding is unexpected as sugars are readily consumed by microorganisms. Our experiments indicated that under low oxygen conditions, phenolic compounds from P. oceanica inhibited microbial consumption of sucrose. Analyses of the rhizosphere community revealed that many microbes had the genes for degrading sucrose but these were only expressed by a few taxa that also expressed genes for degrading phenolics. Given that we observed high sucrose concentrations underneath three other species of marine plants, we predict that the presence of plant-produced phenolics under low oxygen conditions allows the accumulation of labile molecules across aquatic rhizospheres.


Conflict of interest statement

The authors declare no competing interests.

Figures

Fig. 1
Fig. 1. Sugars were more abundant underneath seagrass meadows than in non-vegetated sediments.
a, Sediment pore water profiles were collected 20 m away, 1 m away and underneath a Mediterranean P. oceanica meadow off Elba, Italy. Pore water profiles consisted of samples collected every 5 cm from 0 to 30 cm sediment depth. b, Plots show sucrose concentrations in pore waters across sediment depth (replication numbers are reported for each location and sample depth combination). Red points represent mean concentrations ± s.e.m. Sample sizes at each sediment depth are indicated in the figure. Sucrose concentrations are plotted on a log scale. Sugar concentrations were significantly higher inside the meadow than outside or at the edge (P = 3.56 × 10−13; two-way ANOVA comparing sugar concentrations as a function of sediment depth and location; model results and significance values are reported in Supplementary Tables 2 and 3, average values across sediment depths are reported in Supplementary Table 1). ce, Schematic, light microscopy (c,d) and matrix-assisted laser desorption/ionization MS images (e) from a P. oceanica root collected from a meadow in the Mediterranean off Elba, Italy. Displayed is a quarter of a root cross-section. In e, the molecular ion distribution of disaccharides (C12H22O11, potassium adduct [M + K]+, m/z 381.0754), including sucrose (as confirmed by GC–MS analyses), shows that the relative abundance was highest in the root rhizodermis. Replicate measurements (n = 7) of individual root sections are presented in Supplementary Fig. 5. Relative abundances are visualized as a heatmap from low (blue) to high (yellow) intensities of each pixel (10 µm). rd, rhizodermis; hd, hypodermis; c, cortex; l, lacunae; ed, endodermis; s, stele.
Fig. 2
Fig. 2. Seagrasses deposit sucrose into their rhizosphere through their roots.
a, Schematic showing that P. oceanica roots extend between 5 and 20 cm into the sediments in Mediterranean seagrass meadows off the Island of Elba, Italy. b,c, DOC (Supplementary Table 4) (b) and sucrose concentrations (c) were highest in the zone of root penetration between 5 and 30 cm (two-way ANOVA P < 0.001; ANOVA model results and post-hoc tests reported in Supplementary Tables 2 and 3). Red points represent mean ± s.e.m. DOC and sucrose concentrations across sampling depth; red lines connect the means. Replication numbers across sediment depths are indicated next to b and c. d, Oxygen profiles (n = 2) using a lancet to measure O2 in pore waters revealed that oxygen concentrations were highest at the sediment surface, decreased sharply between the upper sediment layers and 2.5 cm and became anoxic at 7.5 cm. Points represent sediment horizon depths where samples were collected; different line types and colours represent individual profiles.
Fig. 3
Fig. 3. Phenolics were present in sediment pore waters underneath and adjacent to a P. oceanica meadows.
a, Pore water profiles of the molecular DOM composition underneath (in) and 1 m (edge) and 20 m (out) from seagrass meadows, measured by ultrahigh-resolution MS. Our analyses revealed abundant aromatic molecular formulae, including polyphenols, which comprised 10–16% of all molecular formulae across sampling sites. Size of points reflects number of molecular formulae per sample. b, Ion counts of the molecular formula C9H8O4, which includes the phenolic compound most abundant in seagrass tissues caffeic acid, are significantly higher inside the meadow than at the edge or outside the meadow (two-way ANOVA, location P = 0.00026). Count distributions also reveal higher counts within the root–sediment interface, between 5 and 25 cm below the sediment surface (two-way ANOVA, location × depth P = 0.03). Identification of caffeic acid (C9H8O4) in pore waters beneath P. oceanica was confirmed using LC–MS/MS (Supplementary Fig. 7). For statistical results and post-hoc tests see Supplementary Tables 2 and 3.
Fig. 4
Fig. 4. Phenolic compounds inhibit the degradation of sucrose.
a,b, Sediments from replicate cores (n = 3) collected from inside a Mediterranean P. oceanica meadow off the Island of Elba, Italy, consumed 13C12-sucrose (a) and produced 13CO2 (b) over the course of oxic and anoxic experiments conducted over 24 h. Individual points in both a and b represent treatment means ± s.e.m. across independent replicates (n = 3). Under oxic conditions, the production rate of 13CO2 from 13C12-sucrose was similar across treatments and at least 2.5× higher than rates observed under anoxia (note different y axis scales). However, in the anoxic incubations, the addition of phenolics extracted from P. oceanica tissues inhibited the microbial degradation of sucrose to CO2. c, The estimated measured respiration rates under anoxia show that the production of 13CO2 from sucrose in the presence of phenolic compounds is at least eight times lower than that of natural or artificial seawater condition (Supplementary Table 5). The size of the arrows is proportional to the potential rate of CO2 released from sucrose in mmol(C) m−2 d−1.
Fig. 5
Fig. 5. Microbial community composition and metabolism were specific to seagrass sediments.
a,b, PCoA analyses show that the taxonomic composition of microbial communities underneath (in) and away (edge and out) from a Mediterranean P. oceanica meadow off Elba, Italy, were significantly different on the basis of bulk metagenomics (order level, one-way analysis of similarities (ANOSIM) R2 = 0.65, P = 0.006) (a) and full-length 16S rRNA amplicon sequencing (genus level, one-way ANOSIM R = 0.835, P = 0.005) (b). c, The total number of ASVs was significantly lower in samples collected inside and outside the meadow than at the edge (Min = 1,793 ± 79 s.e.m.; Medge = 2,224 ± 23 s.e.m.; Mout = 1,983 ± 51 s.e.m.). NS, not significant. d, Boxplots show the accumulative expression ratio in each MAG between glycoside hydrolases (GH) predicted to degrade sucrose compared to other sugars (overlying points). Putative sucrose specialists (coloured points) are defined as having higher TPMs for sucrose degradation compared to all other GH enzymes (TPMsucrose/TPMother > 1). TPMs represent the total expression across each site-specific library. The majority of MAGs across sites were sugar generalists, while putative sucrose specialists were only found in three MAGs inside and three at the edge of the meadow. ej, Phylogenomic trees for six sucrose specialists: MAG 142 (e); MAG 209 (f); MAG 438 (g); MAG 154 (h); MAG 207 (i); and MAG 76 (j). Coloured boxes show members that grouped within the same family clade. For the relative abundance of each of the putative sucrose specialists across habitats see Supplementary Fig. 10.
Fig. 6
Fig. 6. Sediment pore waters underneath seagrass meadows and a mangrove forest contained high concentrations of sucrose.
a, Seagrasses occur in coastal waters worldwide (data accessed from UN Environmental World Conservation Monitoring Center on 21 March 2020, http://data.unep-wcmc.org/datasets/7). S. filiforme (pink), T. testudinum (yellow) in Belize (BZ) and P. oceanica (purple) in Italy (IT) were the dominant species at both sampling sites in this study. b, Box-and-whisker plots with overlaying data points show that pore waters collected underneath seagrass meadows and mangroves varied, depending on the type of meadow. Centre line is the median, box limits represent the upper and lower quartiles, whiskers are 1.5× the interquartile ranges, outliers are not shown. Specifically, sucrose was significantly higher in pore waters underneath the mixed (n = 14) and mono stands of the seagrass species S. filiforme (n = 29) and T. testudinum (n = 47), followed by samples taken underneath the mangrove peat (n = 48) and finally were lowest underneath P. oceanica meadows (n = 382). In almost all cases, excluding the samples from the mangroves, sucrose concentrations sometimes exceeded micromolar values. Post-hoc tests results: ***P < 0.001, **P < 0.01. Contrasts not shown are not significant (Supplementary Tables 2 and 3).
Extended Data Fig. 1
Extended Data Fig. 1. Sugars were more abundant in pore waters underneath P. oceanica than in unvegetated sediments.
A volcano plot comparing gas chromatography–mass spectrometry peaks from pore water metabolites collected inside (In) versus 1 and 20 m away from a seagrass meadow (Edge/Out). Significant peaks (Benjamini-Hochberg adjusted one-way ANOVA p-value < 0.1) are represented by coloured circles (α < 0.1). The grey dashed lines represent Log2-fold changes > 2; The orange dashed line represents Benjamini-Hochberg corrected p-values < 0.1.
Extended Data Fig. 2
Extended Data Fig. 2. Dissolved organic carbon (DOC) concentrations were higher inside the meadow then at the edge or outside.
a, DOC concentrations (Supplementary Table 4) in sediment pore water profiles from inside (n = 6), at the edge (n = 3) and outside (n = 3) of a P. oceanica meadow show DOC concentrations were significantly higher in pore waters inside the meadow and varied as a function of sediment depth (two-way ANOVA p < 0.001; Supplementary Table 2 and Supplementary Table 3). b, A random subset (n = 3) of DOC samples collected inside the meadow show that sugars made up to 40% of the DOC composition within the 5 cm depth, where seagrass roots dominated the sediment.
Extended Data Fig. 3
Extended Data Fig. 3. Sucrose abundances varied across a day/night cycle in plant leaves and sediment pore water.
a, In situ light levels across 24 hours in a Mediterranean P. oceanica meadow off the Island of Elba, Italy (> 2 m water depth). a-d, Violin plots show the relative abundance of sucrose g-1 tissue plant wet weight in b, leaves, c, rhizomes, and d, roots at each sampling time point. Linear models show that sucrose relative abundances were significantly higher in plant leaves at dusk (t = 20:00) than at other times. e, Violin plots showing sucrose concentrations measured in sediment pore waters at each sampling time point. A linear mixed effects model with a random effect of sampling spot shows sucrose concentrations significantly changed throughout the day and were higher during the daylight hours then after midnight (t = 0:00) and before dawn (t = 5:00). The means of each sampling time point (black points) are connected by solid lines. For e, sucrose concentrations greater than the limits of quantification are represented as 200 µM. All statistical results are reported in Supplementary Table 2 and Supplementary Table 3. All data points were transformed before statistical analyses to meet assumptions of normality.
Extended Data Fig. 4
Extended Data Fig. 4. Seagrass roots contained phenolic compounds.
Matrix-assisted laser desorption/ionization mass spectrometry image from a Mediterranean P. oceanica root cross-section collected off the Island of Elba, Italy. The ion image shows the presence of the phenolic compound, identified as caffeic acid (C9H8O4, [M-H]-, m/z 179.0354; Supplementary Fig. 7). Relative ion abundances are visualized from low (blue) to high (yellow).
Extended Data Fig. 5
Extended Data Fig. 5. Composition of sediment microbial communities according to phyla.
a. The relative abundance of taxonomic phyla from each metagenomic library collected inside, at the edge and outside a Mediterranean P. oceanica meadow off the island of Elba, Italy. b. The number of reconstructed MAGs classified by phylum, obtained from the binned co-assembly of all metagenomic reads from these sediments.
Extended Data Fig. 6
Extended Data Fig. 6. Sucrose specialists showed higher expression of genes for metabolizing sucrose than other sugars.
Circle packing plots show the hierarchical relationships between the accumulative expression of glycoside hydrolases (GH) for each MAG from underneath (In), 1 m (Edge) and 20 m (Out) away from a P. oceanica meadow off Elba, Italy. Inner circles are coloured according to the predicted substrates (red = sucrose, light grey = other sugars). The size of the inner circle represents the accumulative transcription level for each MAG (outer white circles) across collection sites. Sucrose specialists are labelled with their MAG numbers.

Comment in

  • A sweet spot in marine ecosystems.
    Hu Y, Northen TR. Hu Y, et al. Nat Ecol Evol. 2022 Jul;6(7):847-848. doi: 10.1038/s41559-022-01764-5. Nat Ecol Evol. 2022. PMID: 35501481 No abstract available.

References

    1. Short F, Carruthers T, Dennison W, Waycott M. Global seagrass distribution and diversity: a bioregional model. J. Exp. Mar. Biol. Ecol. 2007;350:3–20.
    1. Barbier E, et al. The value of estuarine and coastal ecosystem services. Ecol. Monogr. 2011;81:169–193.
    1. Fourqurean JW, et al. Seagrass ecosystems as a globally significant carbon stock. Nat. Geosci. 2012;5:505–509.
    1. McLeod E, et al. A blueprint for blue carbon: toward an improved understanding of the role of vegetated coastal habitats in sequestering CO2. Front. Ecol. Environ. 2011;9:552–560.
    1. Barrón C, Duarte CM. Dissolved organic matter release in a Posidonia oceanica meadow. Marine Ecol. Prog. Ser. 2009;374:75–84.

Publication types