. 2022 Jun;143(6):697-711.
doi: 10.1007/s00401-022-02424-5. Epub 2022 Apr 30.

ATRT-SHH comprises three molecular subgroups with characteristic clinical and histopathological features and prognostic significance

Affiliations

ATRT-SHH comprises three molecular subgroups with characteristic clinical and histopathological features and prognostic significance

Aniello Federico et al. Acta Neuropathol. 2022 Jun.

Abstract

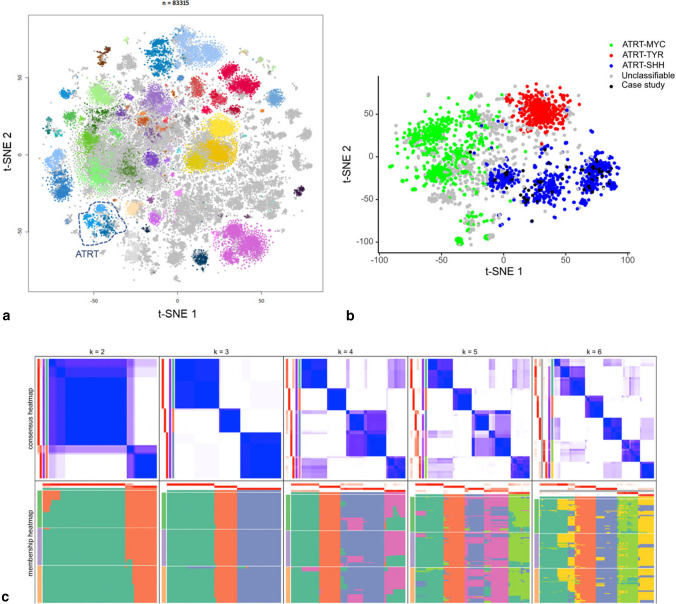
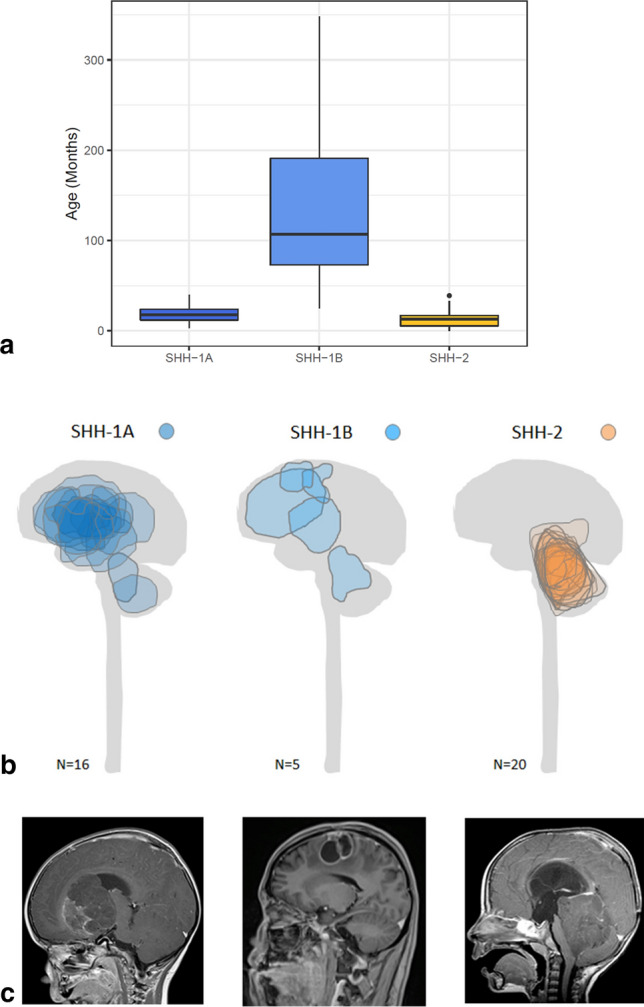
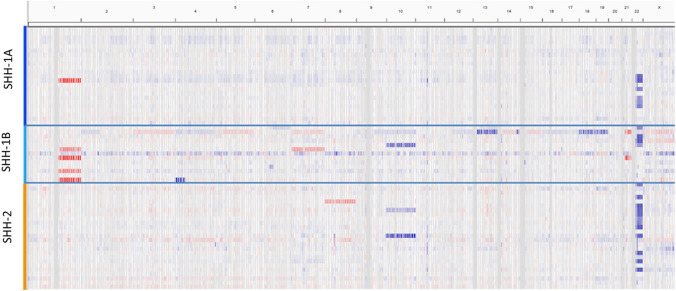
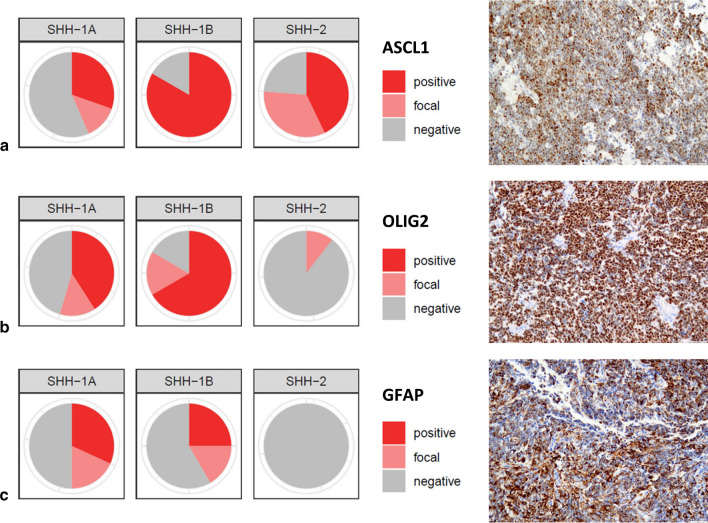
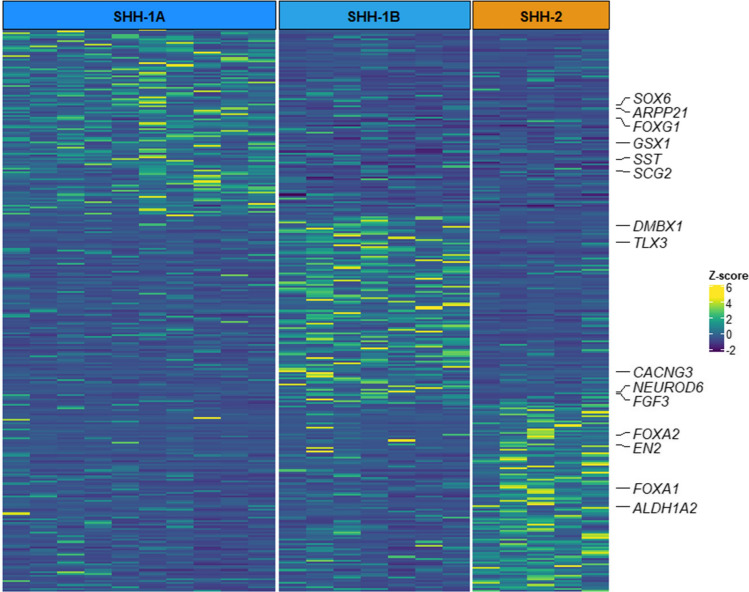
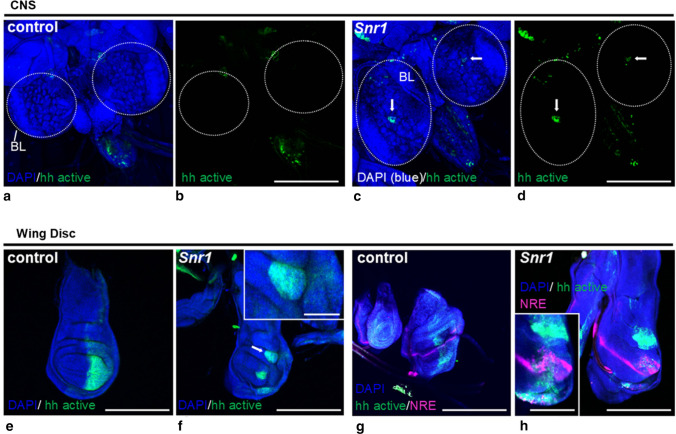
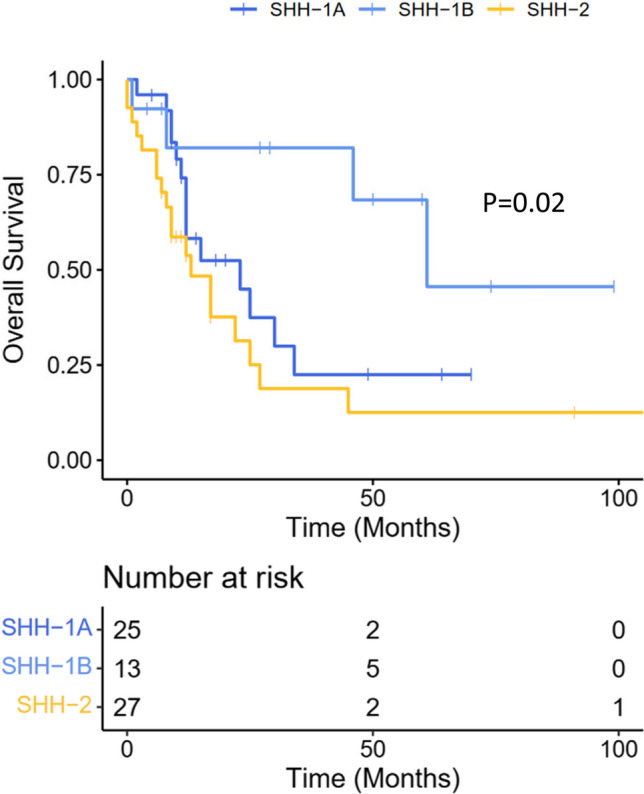
Atypical teratoid/rhabdoid tumor (ATRT) is an aggressive central nervous system tumor characterized by loss of SMARCB1/INI1 protein expression and comprises three distinct molecular groups, ATRT-TYR, ATRT-MYC and ATRT-SHH. ATRT-SHH represents the largest molecular group and is heterogeneous with regard to age, tumor location and epigenetic profile. We, therefore, aimed to investigate if heterogeneity within ATRT-SHH might also have biological and clinical importance. Consensus clustering of DNA methylation profiles and confirmatory t-SNE analysis of 65 ATRT-SHH yielded three robust molecular subgroups, i.e., SHH-1A, SHH-1B and SHH-2. These subgroups differed by median age of onset (SHH-1A: 18 months, SHH-1B: 107 months, SHH-2: 13 months) and tumor location (SHH-1A: 88% supratentorial; SHH-1B: 85% supratentorial; SHH-2: 93% infratentorial, often extending to the pineal region). Subgroups showed comparable SMARCB1 mutational profiles, but pathogenic/likely pathogenic SMARCB1 germline variants were over-represented in SHH-2 (63%) as compared to SHH-1A (20%) and SHH-1B (0%). Protein expression of proneural marker ASCL1 (enriched in SHH-1B) and glial markers OLIG2 and GFAP (absent in SHH-2) as well as global mRNA expression patterns differed, but all subgroups were characterized by overexpression of SHH as well as Notch pathway members. In a Drosophila model, knockdown of Snr1 (the fly homologue of SMARCB1) in hedgehog activated cells not only altered hedgehog signaling, but also caused aberrant Notch signaling and formation of tumor-like structures. Finally, on survival analysis, molecular subgroup and age of onset (but not ASCL1 staining status) were independently associated with overall survival, older patients (> 3 years) harboring SHH-1B experiencing relatively favorable outcome. In conclusion, ATRT-SHH comprises three subgroups characterized by SHH and Notch pathway activation, but divergent molecular and clinical features. Our data suggest that molecular subgrouping of ATRT-SHH has prognostic relevance and might aid to stratify patients within future clinical trials.

Keywords: ASCL1; Atypical teratoid/rhabdoid tumor; DNA methylation profiling; GFAP; Gene expression; Neuroradiology; OLIG2; Overall survival; Prognosis; Sonic hedgehog.


Conflict of interest statement

The authors have no conflict of interest to declare.

Figures

Fig. 1
Fig. 1
DNA methylation profiling of ATRT–SHH reveals three distinct molecular subgroups. Unsupervised t-SNE analysis of the tumor cases together with > 83.000 samples of the molecularneuropathology.org data set (a) segregates ATRT–SHH into three DNA methylation subgroups. A more focused analysis of the ATRT cases within the Heidelberg data set (n = 1919) further suggests the presence of three ATRT–SHH subgroups (b). Black dots indicate the cases of this study. Unsupervised clustering analysis using spherical k-means clustering for k = 2–6 revealed most stable consensus heatmaps and membership partitioning for k = 3 clusters (c)
Fig. 2
Fig. 2
Age distribution and tumor location of ATRT–SHH subgroups. Age distribution of ATRT–SHH subgroups (a). Note that median age of onset of patients harboring SHH-1B tumors is significantly higher as compared to SHH-1A and SHH-2 tumors (Kruskal–Wallis ANOVA p < 0.0001). Tumor location of SHH-1A and SHH-1B tumors is mainly supratentorial, whereas the majority of SHH-2 tumors represents infratentorial tumors, often extending to midbrain structures and the pineal region (b). For visualization, maximal tumor areas in the sagittal plane were determined and projected on a schematic drawing of the CNS. Representative magnetic resonance images are also given (c)
Fig. 3
Fig. 3
Copy-number variation (CNV) analysis of ATRT–SHH subgroups. CNV analysis indicates frequent loss of Chr22q across all three ATRT–SHH subgroups. Note further chromosomal alterations (including gains of chromosome 1q) are more frequent in SHH-1B
Fig. 4
Fig. 4
Immunohistochemical staining profile of ATRT–SHH subgroups. The three ATRT–SHH subgroups show differential protein expression of ASCL1 (a), OLIG2 (b) and GFAP (c). Polar plots and representative positive staining results are given. Scale bars denote 100 µm
Fig. 5
Fig. 5
Gene expression profiling of ATRT–SHH subgroups. Differential expression analysis of ATRT–SHH subgroups showing gene sets specifically overexpressed in each subgroup. The heatmap displays the top 100 up-regulated genes based on their Log2 fold change. Gene intensities plotted in the heatmap are in Z score format. Brain-specific genes, according to the Human Protein Atlas and Allen Human Brain Atlas, are highlighted
Fig. 6
Fig. 6
Knockdown of the SMARCB1 homologue Snr1 in hedgehog activated cells causes aberrant hedgehog as well as Notch signaling and formation of tumor-like structures in the fly model. In the larval central nervous system (ad), Snr1RNAi enhances hedgehog signaling. In the representative images, eGFP (green) expressed with UAS promoter under control of engrailed-gal4, marks engrailed positive/hedgehog activated cells in controls (a, b; n = 12) and upon Snr1RNAi knockdown (c, d; n = 13). Note eGFP-positive cell clusters (arrows) in the brain lobes (BL) upon Snr1 knockdown not visible in control animals. In the imaginal wing disc (eh), Snr1 knockdown causes growth defects and atypical engrailed expression pattern in the posterior compartments, visualized by eGFP (green) in controls (e; n = 16) and upon Snr1RNAi knockdown (f; n = 19). Note tumor-like structure (arrow and inset) upon Snr1RNAi knockdown. Snr1 knockdown in hedgehog activated cells also results in ectopic Notch signaling, especially in the posterior compartment of the wing disc (g, h). Expression of engrailed is reported with mRFP (shown as green) under control of the UAS/GAL4 system while activation of Notch: ‘Notch-on’ state with GFP (shown in magenta) under control of NRE (Notch responding element), in controls (g; n = 9) and in Snr1RNAi (h; n = 10). Note characteristic stripe-like Notch expression pattern at the boundary of the dorso-ventral line in controls (g) that is more intense in the engrailed-negative anterior compartment of SnrRNAi wing discs (h). In the posterior compartment of Snr1RNAi wing discs, additional ‘Notch-on’ clusters (magenta) are visible, which are frequently associated with engrailed (green) and abnormal tumor-like structures (inset). Nuclei counterstained with DAPI (blue). Scale bars denote 200 µm or 100 µm (insets). Fly genotypes are described in detail in the Materials and methods section
Fig. 7
Fig. 7
Outcome. Kaplan–Meier estimates of overall survival in ATRT–SHH subgroups SHH-1A, SHH-1B and SHH-2. P = 0.02 Log-Rank Test between the three subgroups

Similar articles

Cited by

References

    1. Aydin B, Kakumanu A, Rossillo M, et al. Proneural factors Ascl1 and Neurog2 contribute to neuronal subtype identities by establishing distinct chromatin landscapes. Nat Neurosci. 2019;22:897–908. doi: 10.1038/s41593-019-0399-y. - DOI - PMC - PubMed
    1. Capper D, Jones DTW, Sill M, et al. DNA methylation-based classification of central nervous system tumours. Nature. 2018;555:469–474. doi: 10.1038/nature26000. - DOI - PMC - PubMed
    1. Capper D, Stichel D, Sahm F, et al. Practical implementation of DNA methylation and copy-number-based CNS tumor diagnostics: the Heidelberg experience. Acta Neuropathol. 2018;136:181–210. doi: 10.1007/s00401-018-1879-y. - DOI - PMC - PubMed
    1. Chen J, Wu X, Xing Z, et al. FOXG1 expression is elevated in glioma and inhibits glioma cell apoptosis. J Cancer. 2018;9:778–783. doi: 10.7150/jca.22282. - DOI - PMC - PubMed
    1. Cheng Y, Sudarov A, Szulc KU, et al. The Engrailed homeobox genes determine the different foliation patterns in the vermis and hemispheres of the mammalian cerebellum. Development. 2010;137:519–529. doi: 10.1242/dev.027045. - DOI - PMC - PubMed

Publication types

LinkOut - more resources