. 2022 May;4(5):627-643.
doi: 10.1038/s42255-022-00566-0. Epub 2022 May 2.

Astrocytic BDNF signaling within the ventromedial hypothalamus regulates energy homeostasis

Affiliations

Astrocytic BDNF signaling within the ventromedial hypothalamus regulates energy homeostasis

Dominique Ameroso et al. Nat Metab. 2022 May.

Abstract

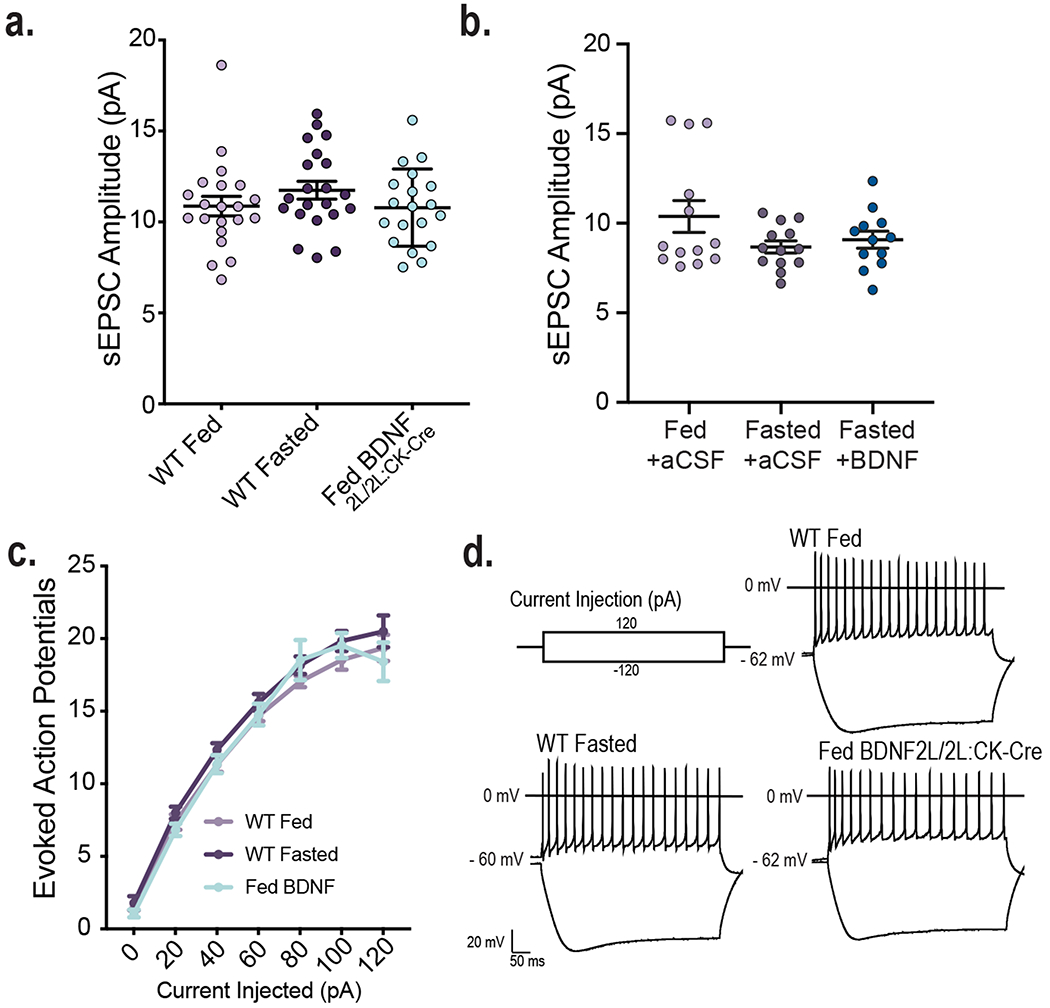
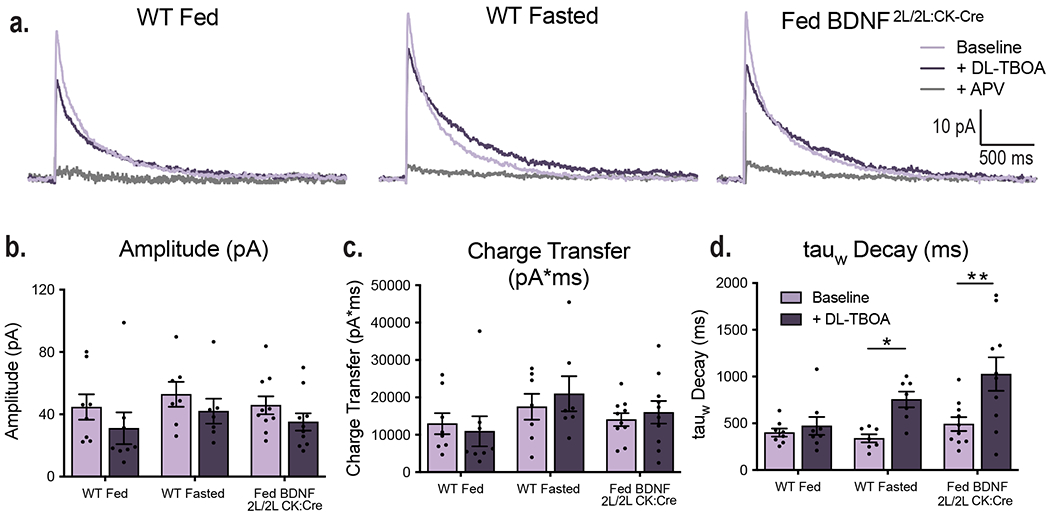
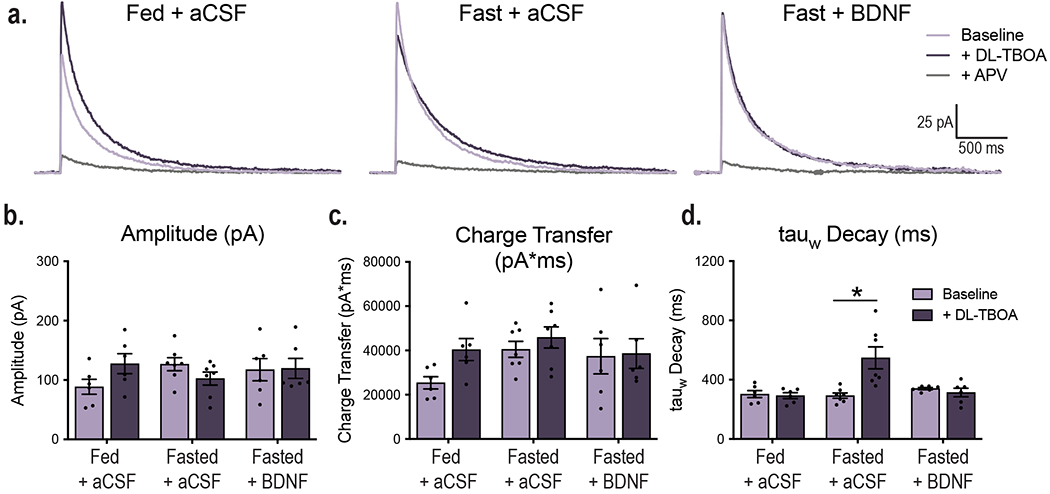
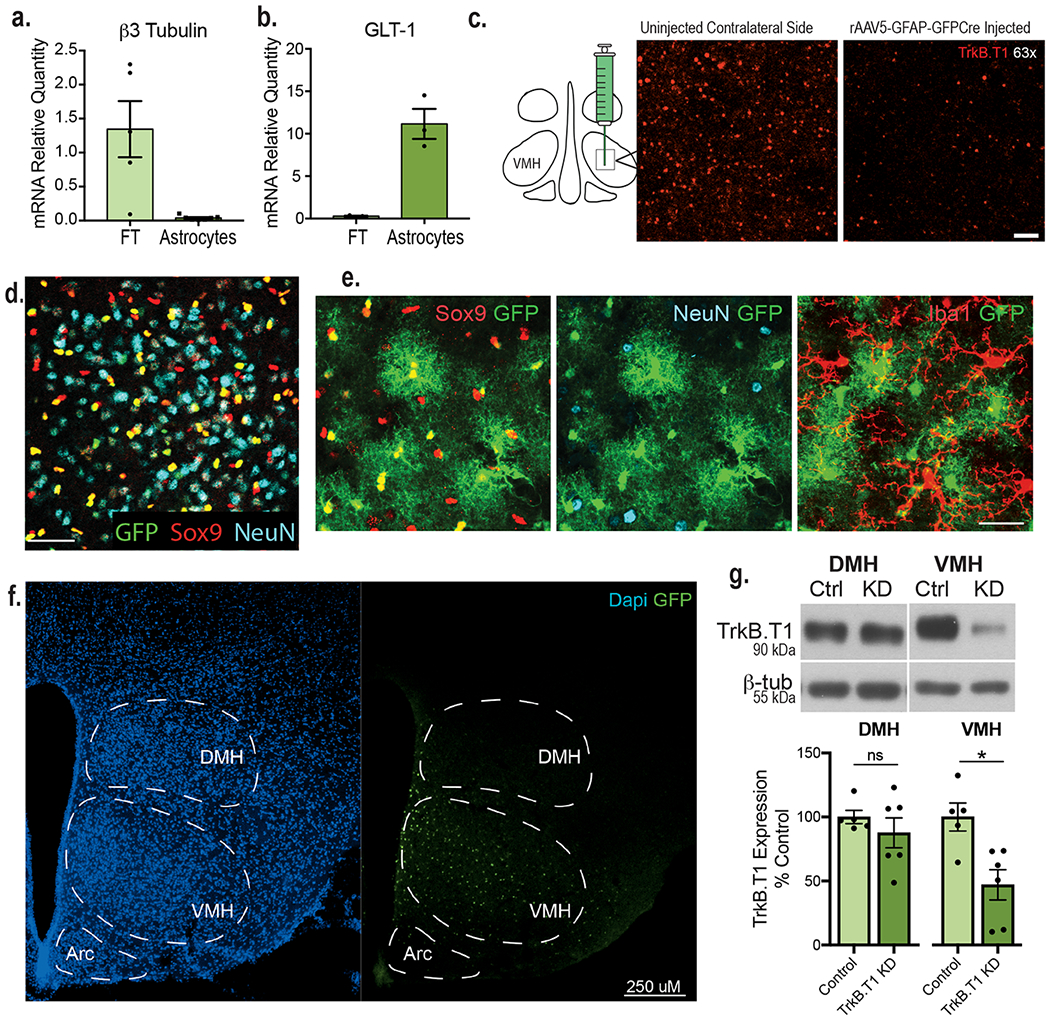
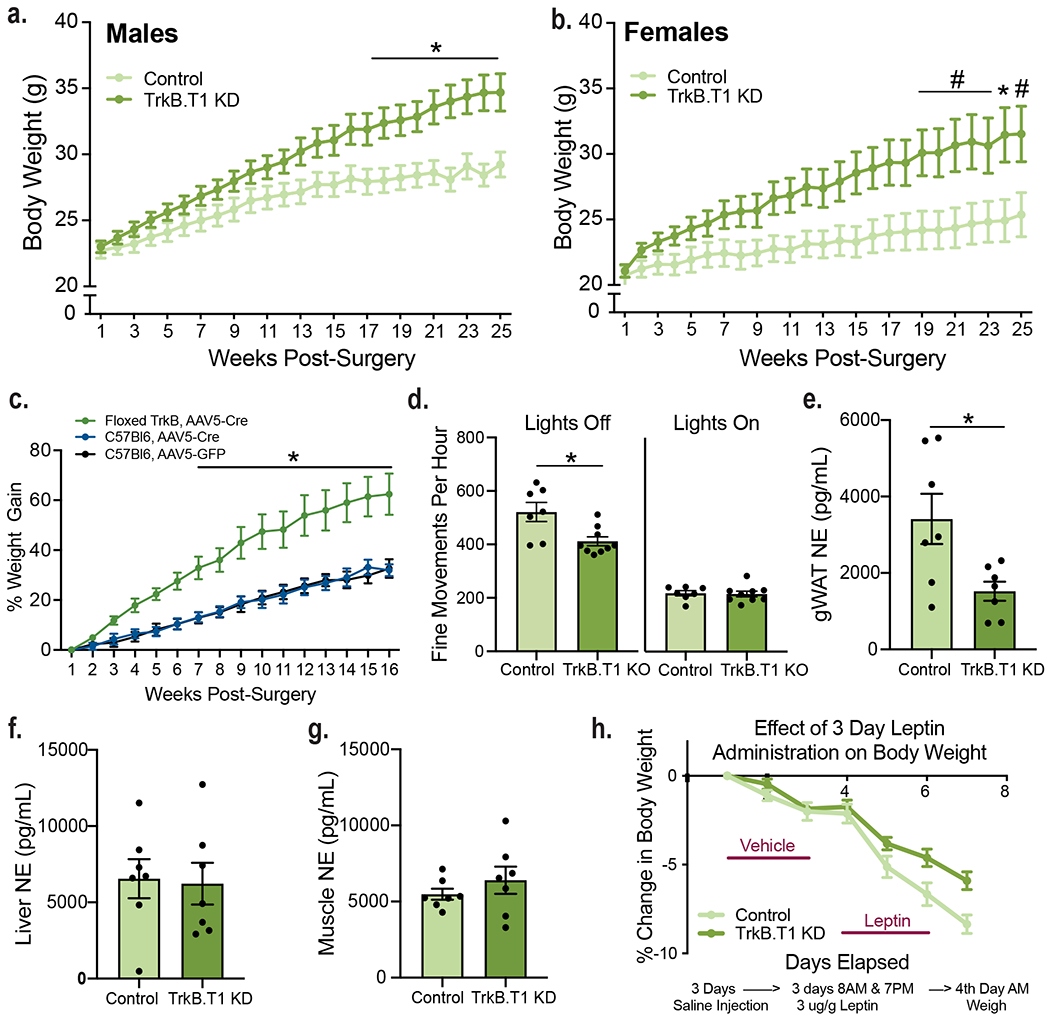
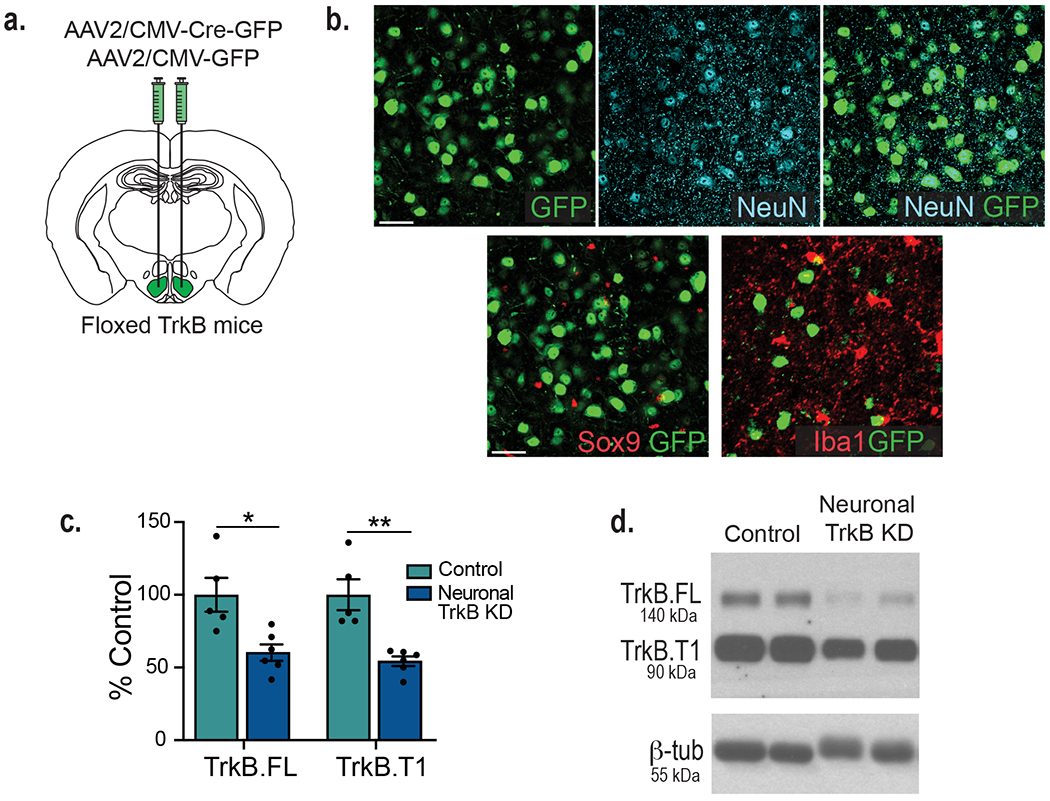
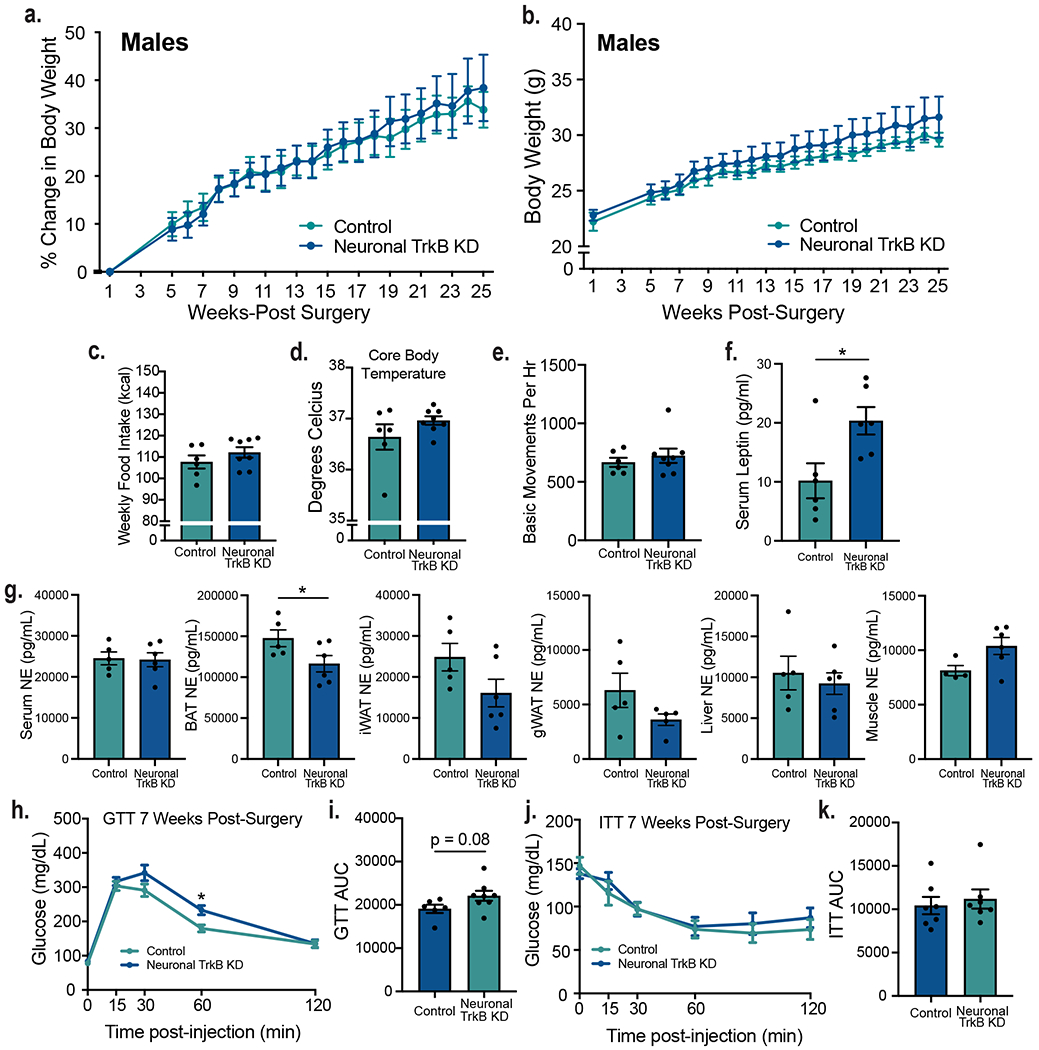
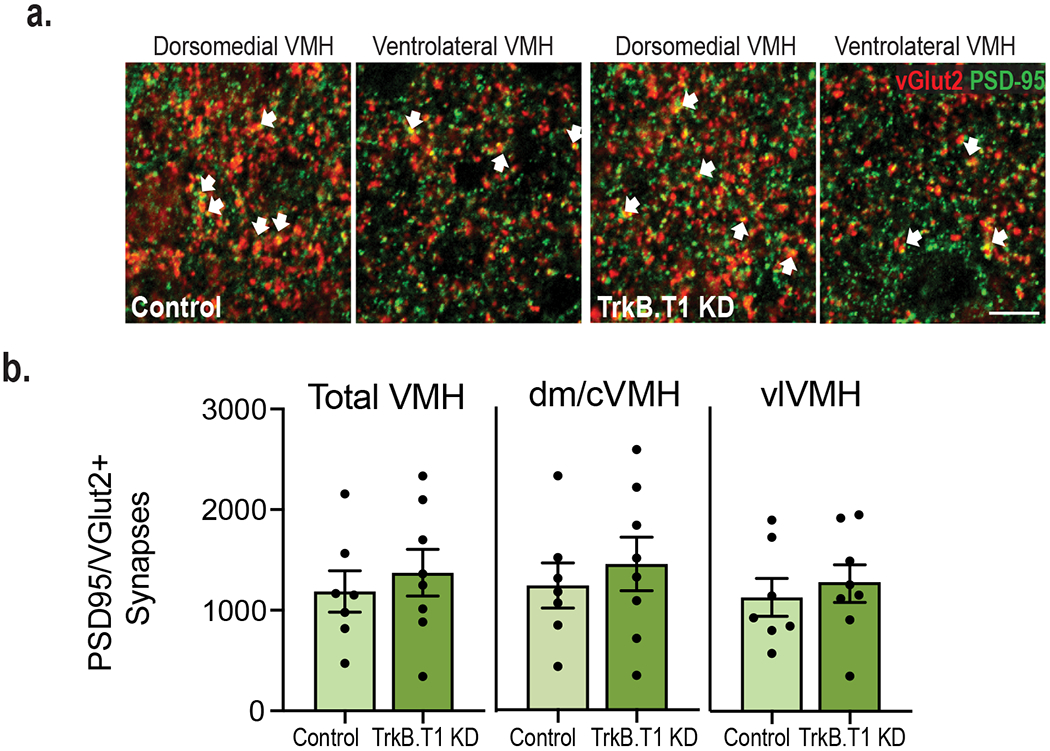
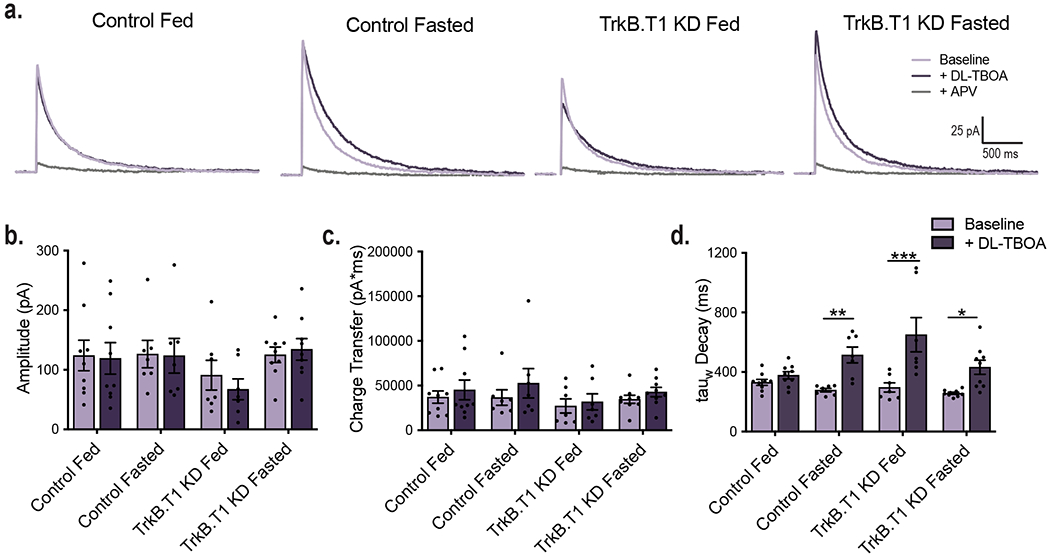
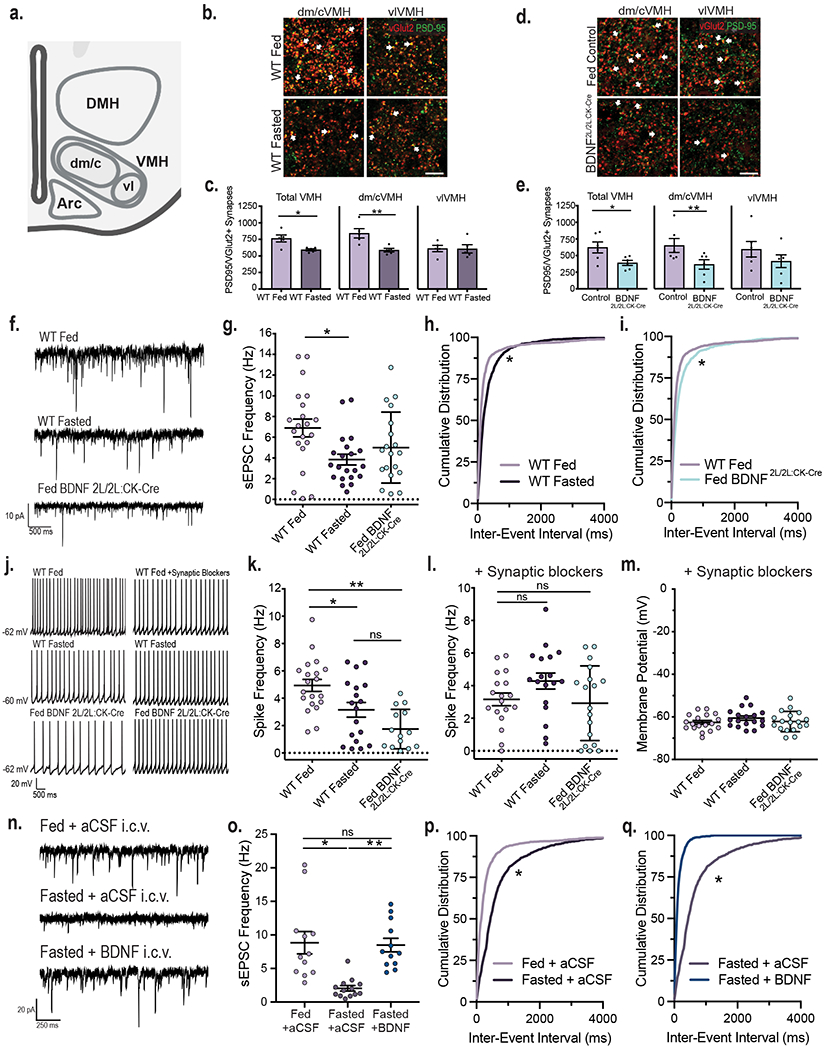
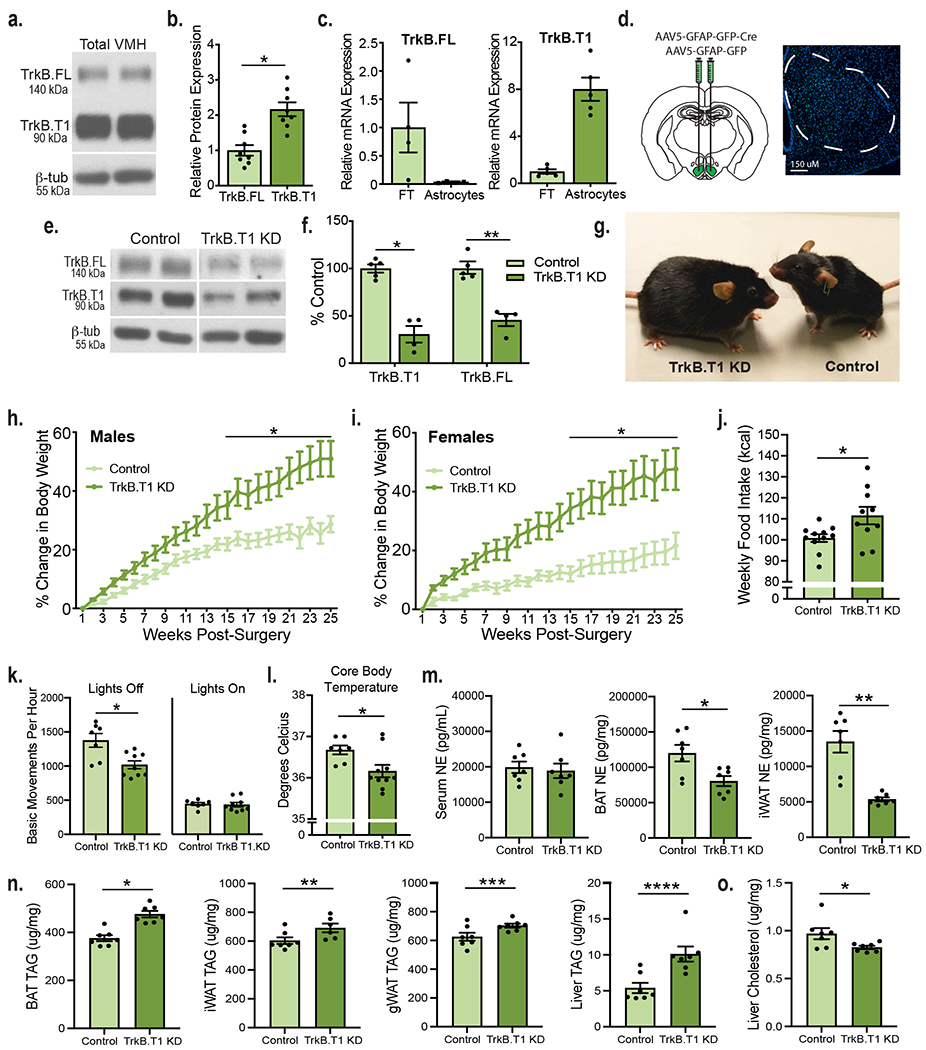
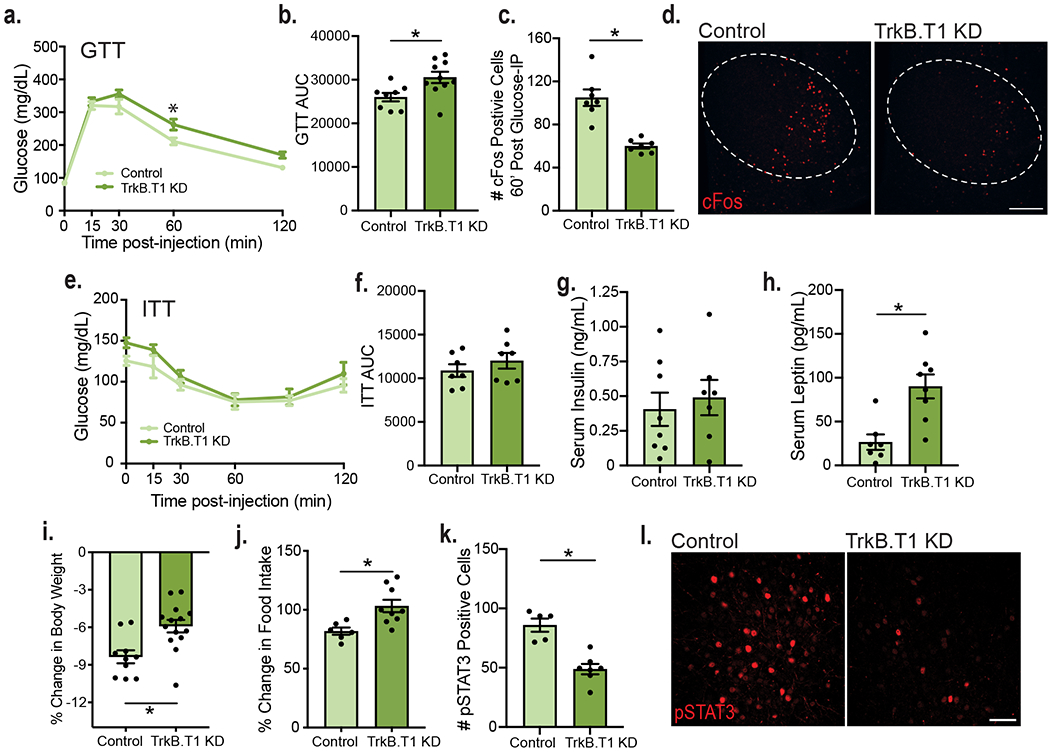
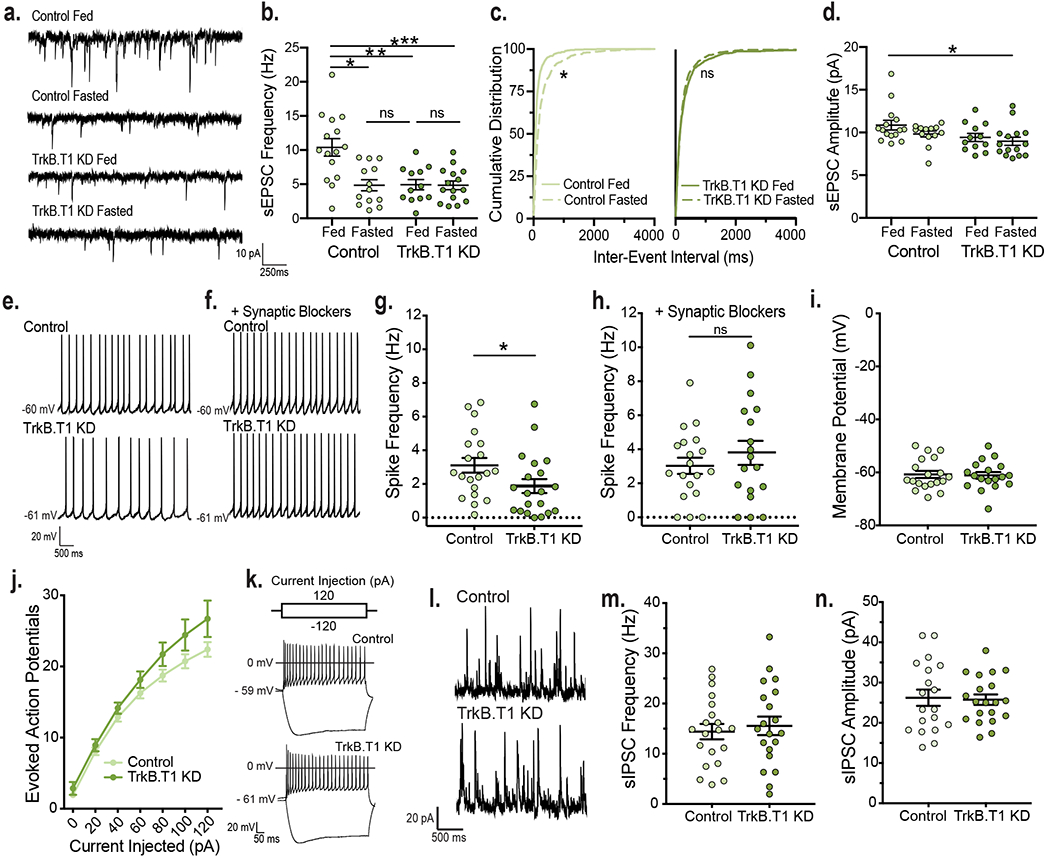
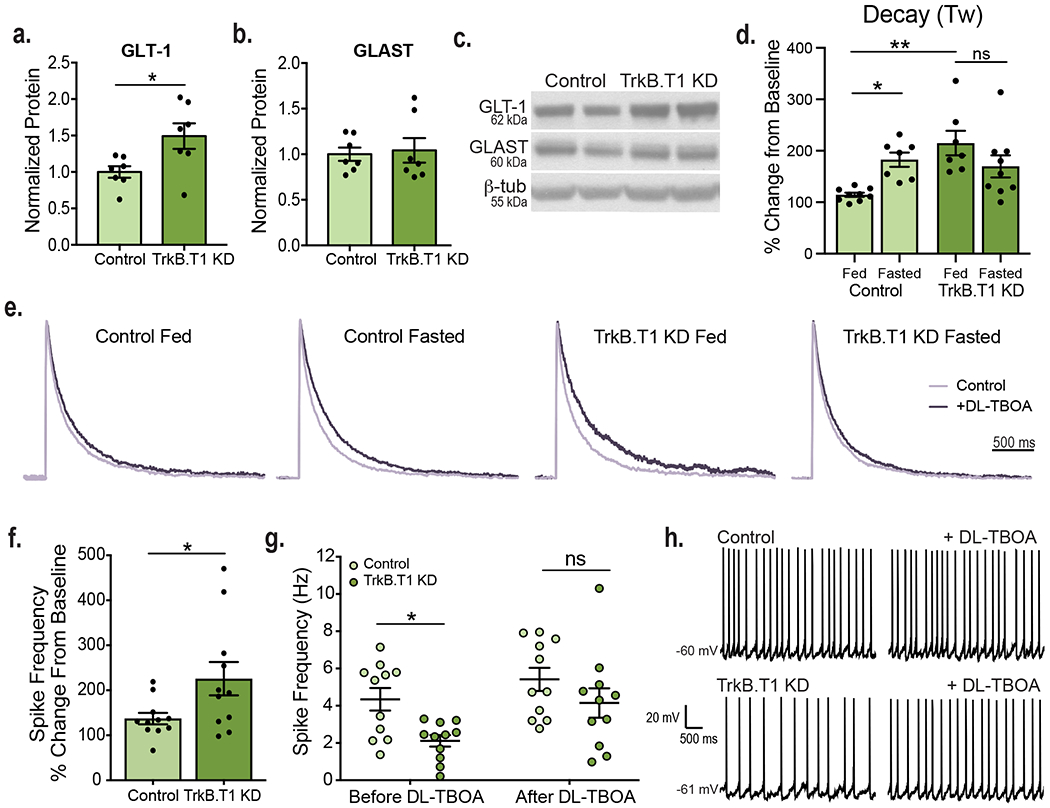
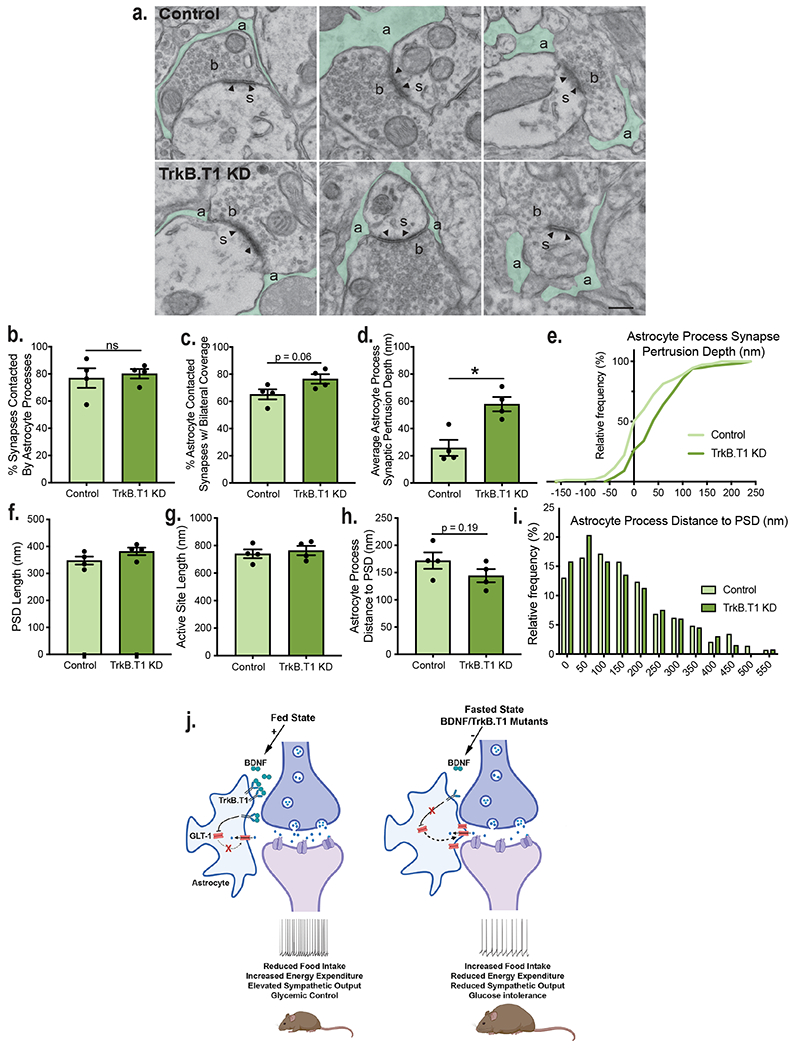
Brain-derived neurotrophic factor (BDNF) is essential for maintaining energy and glucose balance within the central nervous system. Because the study of its metabolic actions has been limited to effects in neuronal cells, its role in other cell types within the brain remains poorly understood. Here we show that astrocytic BDNF signaling within the ventromedial hypothalamus (VMH) modulates neuronal activity in response to changes in energy status. This occurs via the truncated TrkB.T1 receptor. Accordingly, either fasting or central BDNF depletion enhances astrocytic synaptic glutamate clearance, thereby decreasing neuronal activity in mice. Notably, selective depletion of TrkB.T1 in VMH astrocytes blunts the effects of energy status on excitatory transmission, as well as on responses to leptin, glucose and lipids. These effects are driven by increased astrocytic invasion of excitatory synapses, enhanced glutamate reuptake and decreased neuronal activity. We thus identify BDNF/TrkB.T1 signaling in VMH astrocytes as an essential mechanism that participates in energy and glucose homeostasis.


Conflict of interest statement

Competing Interests Statement

The authors declare no competing interests.

Figures

Extended Data Fig. 1
Extended Data Fig. 1. Intrinsic excitability of VMH neurons is not regulated by energy status or BDNF signaling
a. Amplitude of sEPSCs in VMH neurons of fed (n = 21) and fasted WT (n = 21) and fed BDNF2L/2LCK:Cre mice (n = 19) (4 – 6 mice per group), Ordinary One-way ANOVA, p = 0.3 b. Amplitude of sEPSCs in VMH neurons of in WT Fed + aCSF (n = 13), Fasted + aCSF (n = 13) and Fasted + BDNF conditions (n = 12) (4 mice per group), Ordinary One-way ANOVA, p = 0.136 c. Input-output curves from VMH neurons in fed (n = 19) and fasted WT (n = 18) and fed BDNF2L/2LCK-Cre mice (n = 17) (3 - 4 mice per group). Two-way repeated measures ANOVA: Interaction, p = 0.7; Genotype, p = 0.3. d. Representative Traces showing resulting hyperpolarization or evoked action potentials in response to current injection steps of −120 mV and 120 mV. Data represented as mean +/− SEM
Extended Data Fig. 2
Extended Data Fig. 2. Energy status and BDNF regulate astrocytic glutamate uptake at VMH synapses
a. Representative traces of raw NMDAR responses (light purple), responses +100 uM DL-TBOA (dark purple), and responses + 50 uM APV (light gray). For following panels, WT Fed (n = 8), WT Fasted (n = 7), and Fed BDNF 2L/2L CK:Cre (n = 10) b. Amplitude (pA) of NMDAR responses before and after DL-TBOA application. c. Charge transfer (pA*ms) of NMDAR responses before and after DL-TBOA application. d. Decay (weighted tau) of NMDAR responses before and after DL-TBOA application. Two-way ANOVA: Genotype, p = 0.01; p = 0.0005; Interaction of genotype and DL-TBOA, p = 0.09. Bonferroni multiple comparisons, *, p = 0.001. Data represented as mean +/− SEM
Extended Data Fig. 3
Extended Data Fig. 3. Energy status regulates astrocytic glutamate uptake at VMH synapses via BDNF signaling
a. Representative traces of raw NMDAR responses (light purple), responses +100 uM DL-TBOA (dark purple), and responses + 50 uM APV (light gray). For following panels, Fed + aCSF (n = 6), Fasted + aCSF (n = 7), Fasted + BDNF (n = 6) b. Amplitude (pA) of NMDAR responses before and after DL-TBOA application. c. Charge transfer (pA*ms) of NMDAR responses before and after DL-TBOA application. d. Decay (weighted tau) of NMDAR responses before and after DL-TBOA application. Two-way ANOVA: Condition, p = 0.007; DL-TBOA, p = 0.02; Interaction of condition and DL-TBOA, p = 0.0009. Bonferroni multiple comparisons, *, p < 0.0001. Data represented as mean +/− SEM
Extended Data Fig. 4
Extended Data Fig. 4. TrkB.T1 in VMH astrocytes is an essential regulator of body weight under standard chow conditions
a. Expression of the neuronal marker b3 tubulin (FT n = 5, Astrocyte n = 7) and b. GLT-1 in mRNA isolated from VMH astrocytes and flowthrough (FT n = 3, Astrocyte n = 3). c. Immunolabeling of TrkB.T1 in the VMH of a TrkB F/F animal injected unilaterally with AAV5-GFAP-GFP-Cre 4 weeks post-surgery. Scale bar 15 uM. d. Co-localization of AAV5-GFAP-GFP-Cre with GFP signal with astrocytes (Sox9 + cells) and exclusion from neurons (NeuN + cells). Scale bar 50 uM. e. Co-localization of AAV5-GFAP-driven GFP signal with astrocytic (Sox 9), neuronal (NeuN) and microglial (Iba)-specific markers. Scale bar 150 nM. f. Image showing that viral spread is limited to the VMH. g. Western blot and analysis showing TrkB.T1 expression in Control and TrkB.T1 KD mice within the VMH (n = 6) and the DMH of mice (n = 5). Data collected from one experiment. Student’s two-sided t-test, * , p = 0.01. Data represented as mean +/− SEM.
Extended Data Fig. 5
Extended Data Fig. 5. Depletion of TrkB.T1 from VMH astrocytes leads to increased body weight and alterations in locomotor activity, sympathetic tone and leptin insensitivity
a. Body weights of TrkB.T1 KD (n = 10) and control males (n = 13). Two-way RM ANOVA: Genotype, p = 0.02; Time, p < 0.0001; Time x Genotype Interaction, p <0.0001; Bonferroni multiple comparisons, *, p < 0.05. b. Body weights of TrkB.T1 KD (n = 11) and control females (n= 8). Two-way RM ANOVA: Genotype, p = 0.04; Time, p < 0.0001; Time x Genotype Interaction, p < 0.0001; Bonferroni multiple comparisons, *, p < 0.05, #, p = 0.09. c. Percentage body weight gain in TrkB.T1 KD (n = 7) and wild type C57Bl6 males (n = 4) delivered AAV5-GFAP-GFP or AAV5-GFAP-GFP-Cre to the VMH. Two-way RM ANOVA: Genotype, p = 0.01; Bonferroni multiple comparisons, *, p < 0.5. d.. Fine movements per hour of TrkB.T1 KD and control animals over 6 days (n = 7 - 9). Students two-sided t-test, *, p = 0.009. e – g. Norepinephrine levels in tissues from TrkB.T1 KD and control animals (n = 7). Student’s two-sided t-test, *, p = 0.01. h. Experimental design and daily weight change in TrkB.T1 KD and control male mice 4 weeks post-surgery in response to IP administration of vehicle for 3 days followed by administration of leptin (3 ug/g) for 3 days. Data are represented as mean +/− SEM.
Extended Data Fig. 6
Extended Data Fig. 6. The use of serotype AAV2 and a CMV promoter to knockdown TrkB is specific to neurons
a. Diagram showing experimental approach for depleting TrkB from neurons bilaterally in the VMH of adult mice. b. Co-immunolabeling of VMH showing co-localization of AAV2-CMV-driven GFP signal with the neuronal marker NeuN but not with the astrocytic marker Sox9 or the microglial marker Iba1. Scale bar 50 nM. c. TrkB.T1 and TrkB.FL expression in floxed TrkB mice delivered AAV2-CMV-GFP (control) or AAV2-CMV-GFPCre (TrkB KD) to the VMH (n = 6). Student’s two-sided t-test, *, p = 0.01, **, p = 0.0016. Data represented as mean +/− SEM. d. Representative western blot showing viral knockdown of TrkB in VMH. Data collected from one experiment.
Extended Data Fig. 7
Extended Data Fig. 7. TrkB in VMH neurons is not required for the regulation of energy balance under chow conditions but is essential for glycemic control
A . Percent body weight gain in Neuronal TrkB KD and control mice (n = 6). Two-way RM ANOVA: Genotype, p = 0.88; Time, p <0.0001; Interaction, p = 0.85; Subjects (matching), p <0.0001. B. Body weights of Neuronal TrkB KD and control mice (n = 7). Two-way RM ANOVA: Genotype, p = 0.44; Time, p <0.0001; Interaction, p 0.76; Subjects (matching), p <0.0001. C. Average weekly food intake weeks 3 - 6 post-surgery in neuronal TrkB KD (n = 8) and control (n = 6) mice. Student’s two-sided t-test, NS. D. Core body temperatures in neuronal TrkB KD (n = 8) and control (n = 6) mice. Student’s two-sided t-test, NS. E. Basic movements per hour of neuronal TrkB KD (n = 8) and control (n = 6) mice recorded over 6 days. F. Serum levels of leptin (pg/mL) in fed animals (n = 6). Students two-sided t-test, *, p = 0.02. G. Norepinephrine levels in indicated tissues in neuronal TrkB KD (n = 6) and control (n = 5) mice. Student’s two-sided t-test, *, p = 0.05. H. Glucose tolerance test of neuronal TrkB KD (n = 8) and control (n = 6) mice. Two-way RM ANOVA; Time, p < 0.0001; Genotype, p = 0.1; Interaction, p = 0.01. Bonferroni multiple comparisons, *, p = 0.04. I. GTT area under the curve. Students two-sided t-test, p = 0.08. J. Insulin tolerance test (n = 7). Two-way RM ANOVA; Time, p < 0.0001; Genotype, p = 0.65; Interaction, p = 0.48. Bonferroni multiple comparisons. K. ITT area under the curve. Students t-test, NS. Data represented as mean +/− SEM.
Extended Data Fig. 8
Extended Data Fig. 8. Selective depletion of TrkB.T1 from VMH astrocytes in adult mice does not alter VMH neuronal excitatory synapse density
a. Representative images of VMH co-immunolabeled with anti-PDS95 and anti-vGlut2. Arrows indicate PSD95 and vGlut2 co-localization (scale bar 15 uM). b. Density of excitatory synapses (co-localization of vGlut2 and PSD95) in the VMH of TrkB.T1 KD (n = 8) and control mice (n = 7). Students two-tailed t-test, NS Data are represented as mean +/− SEM.
Extended Data Fig. 9
Extended Data Fig. 9. Selective depletion of TrkB.T1 from VMH astrocytes in adult mice leads to increased glutamate uptake at synapses
a. Representative traces of raw NMDAR responses (light purple), responses + 100 uM DL-TBOA (dark purple), and responses + 50 uM APV (light gray). For following panels, Control Fed (n = 9), Control Fasted (n = 7), TrkB.T1 Fed (n = 7), TrkB.T1 Fasted (n = 9). b. Amplitude (pA) of NMDAR responses before and after DL-TBOA application. c. Charge transfer (pA*ms) of NMDAR responses before and after DL-TBOA application. d. Decay (weighted tau) of NMDAR responses before and after DL-TBOA application. Two-way ANOVA: Genotype, p = 0.03; Treatment, p < 0.0001; Genotype x Treatment Interaction, p = 0.01. Bonferroni multiple comparisons, *, p = 0.02. **, p = 0.005, ***, p < 0.0001. Data represented as +/− SEM.
Figure 1:
Figure 1:. VMH neuronal activity is dynamically regulated by energy status and BDNF signaling.
a, Diagram indicating the central/dorsomedial (dm/c) and ventrolateral (vl) regions of the VMH where excitatory synapse density was measured. Created with Biorender.com b, Representative images of VMH tissue from fed and fasted wild type (WT) mice co-immunolabeled with anti-vGlut2 and anti-PSD95. Arrows indicate PSD95 and vGlut2 co-localization (scale bar = 15 uM). c, Quantification of number of excitatory synapses in the VMH of fed and fasted WT mice (n = 5 mice). Student’s unpaired two-sided t-test, *, p = 0.01; **; p = 0.009. d, Representative images of VMH from fed control and BDNF2L/2L:CK-cre mice (scale bar 15 uM). e, Quantification of number of excitatory synapses in the VMH of fed control and BDNF2L/2L:CK-Cre mice (n = 6 mice). Student’s unpaired two-sided t-test, *, p = 0.02; **, p = 0.04. f, Representative traces of sEPSCs in VMH neurons. g, Frequency of sEPSCs in VMH neurons of fed (n = 21 cells) and fasted WT (n = 21 cells) and fed BDNF2L/2LCK:Cre mice (n = 19 cells) from 4 - 6 mice. Ordinary One-way ANOVA, p = 0.01. Tukey multiple comparisons, *, p = 0.01. h, Cumulative distributions of inter-event interval generated from 50 random events per recorded cell for fed and fasted WT (*, p < 0.001, KS = 0.227, Kolmogorov-Smirnov) and i, fed WT and BDNF2L/2LCK:Cre mice (*, p < 0.001, KS = 0.167, Kolmogorov-Smirnov, two-sided). j, Representative traces in current clamp showing VMH neuronal firing. k, Spike frequency of VMH neurons of fed (n = 20 cells) and fasted WT (n = 18 cells) and fed BDNF2L/2LCK:Cre mice (n = 14 cells) (4 – 6 mice per group). Ordinary One-way ANOVA, p < 0.0001. Tukey multiple comparisons, *, p = 0.019; **, p < 0.0001. l, Spike frequency and m, Membrane potential of VMH neurons of fed and fasted WT and fed BDNF2L/2LCK:Cre mice in the presence of 10 uM SR 95531, 50 uM NBQX and 10 uM CPP (n = 18 cells, 3 - 4 mice). Spike Frequency Ordinary One-way ANOVA, p = 0.1078. n, Representative traces of sEPSCs in VMH neurons in Fed WT + aCSF, Fasted WT + aCSF and Fasted WT + BDNF mice. o, Frequency of sEPSCs in VMH neurons in Fed WT + aCSF (n = 12 cells), Fasted WT + aCSF (n = 13 cells) and Fasted WT + BDNF (n = 12 cells) mice (4 mice per group). Ordinary One-way ANOVA, p = 0.0001. Tukey multiple comparisons, *, p < 0.0004; **, p = 0.0007. p, Cumulative distributions of inter-event interval generated from 50 random events per recorded cell for Fed WT + aCSF and Fasted WT + aCSF conditions (*, p < 0.0001, KS = 0.409, Kolmogorov-Smirnov, two-sided) and q, Fasted WT + aCSF and Fasted WT + BDNF conditions (*, p < 0.0001, KS = 0.591, Kolmogorov-Smirnov, two-sided). Data represented as mean +/− SEM.
Figure 2:
Figure 2:. Energy status and BDNF regulate astrocytic glutamate uptake at VMH synapses.
VMH GLT-1 (a) and GLAST (b) protein expression in fed (n = 13) and fasted WT (n =13) and fed BDNF2L/2L:CK-Cre mice (n = 11). GLT1 Ordinary One-way ANOVA, p = 0.006. GLAST Ordinary One-way ANOVA, p = 0.4. Tukey multiple comparisons, *, p = 0.01; **, p= 0.02. c, Representative western blots of GLT-1 and GLAST expression in VMH (Data collected from four experiments). d, Average amplitude-normalized NMDAR responses at baseline (light purple) and following application of 100 uM DL-TBOA (dark purple) in fed and fasted WT and fed BDNF2L/2L:CK-Cre mice. e, Effect of DL-TBOA on Decay of NMDAR responses (weighted tau) of fed (n = 8 cells) and fasted (n = 7 cells) WT and fed BDNF2L/2L:CK-Cre (n = 9 cells) mice ( 4 – 6 mice). Ordinary One-way ANOVA, p = 0.02. Tukey multiple comparisons, *, p = 0.04. f, Representative traces in current clamp showing VMH neuronal firing at baseline and following application of DL-TBOA. g, Percent change in neuronal firing rate (Hz) in response to bath DL-TBOA (100 uM) application (n = 10 cells, 4 – 5 mice). Ordinary One-way ANOVA, p = 0.0227. Tukey multiple comparisons, *, p = 0.0255. h, Spike frequency of VMH neurons of fed (n =10 cells) and fasted (n = 10 cells) WT and fed BDNF2L/2L:CK-Cre (n = 9 cells) mice (4 – 5 mice per group) before and after bath application of 100 uM DL-TBOA. Two-way ANOVA; Treatment, p = 0.044; Genotype, p = 0.006; Interaction, p = 0.041. Bonferroni multiple comparisons, *, p = 0.024; **, p = 0.006. i, Average amplitude-normalized NMDAR responses at baseline (light purple) and following application of 100 uM DL-TBOA (dark purple) in Fed WT + aCSF, Fasted WT + aCSF and Fasted WT + BDNF mice. j, Effect of DL-TBOA on Decay of NMDAR responses (weighted tau) (Fed WT + aCSF n = 6 cells; Fasted WT + aCSF n = 7 cells; Fasted WT + BDNF n = 6 cells; from 4 mice per group) . Ordinary One-way ANOVA, p < 0.0001. Tukey multiple comparisons, *, p = 0.0001; **, p < 0.0001. Data represented as mean +/− SEM.
Figure 3:
Figure 3:. TrkB.T1 signaling in VMH astrocytes is essential for the regulation of energy balance.
a, Representative western blot showing TrkB expression in the adult WT VMH. b, Quantification of TrkB FL and TrkB.T1 protein and in the WT VMH (n = 8). Students unpaired two-sided t-test, *, p = 0.0003. c, Expression of TrkB.FL (n = 4) and TrkB.T1 (n = 5) mRNA in astrocytes isolated from adult WT VMH compared to flowthrough. d, Diagram showing experimental approach for depleting TrkB.T1 in adult VMH astrocytes bilaterally and AAV5-GFAP-driven GFP signal throughout the VMH. e, Representative western blot showing knockdown of TrkB.FL and TrkB.T1 in mice delivered AAV5-GFAP-GFP (control) or AAV5-GFAP-GFPCre (TrkB.T1 KD) 5 weeks post-surgery. f, Representative quantification of viral knock down of TrkB.T1 and TrkB.FL 5 weeks post-surgery (Control n = 5 and TrkB.T1 KD, n = 4). Student’s unpaired two-sided t-test, *, p = 0.0001; **, p = 0.0004. g, Representative image of TrkB.T1 KD and control males 25 weeks post-surgery. h, Percentage body weight gain in TrkB.T1 KD (n = 10) and control males (n = 12) fed a chow diet. Two-way RM ANOVA: Genotype, p = 0.003; Time, p <0.0001; Genotype x Time Interaction, p < 0.0001; Subjects (matching), p < 0.0001. Bonferroni multiple comparisons, *, p < 0.05. i, Percentage body weight gain in TrkB.T1 KD (n = 12) and control females (n = 8) fed a chow diet. Two-way RM ANOVA: Genotype, p = 0.005; Time, p < 0.0001; Genotype x Time Interaction, p < 0.0001; Subjects (matching), p < 0.0001. Bonferroni multiple comparisons, *, p < 0.01. j, Weekly food intake (kcal) weeks 3 - 6 post-surgery (Control, n = 11 and TrkB.T1 KD, n = 10). Students unpaired two-sided t-test, *, p = 0.02. k, Basic movements per hour of TrkB.T1 KD (n = 9) and control (n = 7) males during 6 days of measurements during the light and dark cycles. Students unpaired two-sided t-test, *, p = 0.005. l, Rectal body temperature of TrkB.T1 KD (n = 10) and control males (n = 7). Students unpaired two-sided t-test, *, p = 0.02. m, Norepinephrine levels (pg/mL) in TrkB.T1 KD and control males (n = 7). Student’s unpaired two-sided t-test, *, p < 0.01; **, p = 0.0002. n, Triglyceride levels (ug/mg) in TrkB.T1 KD (n = 7) and control males (n = 6). Student’s unpaired two-sided t-test, *, p = 0.0001; **, p = 0.03; ***; p = 0.02; ****, p = 0.002. o, Cholesterol levels (ug/mg) in the liver of TrkB.T1 KD and control males (n = 7). Student’s unpaired two-sided t-test, *, p = 0.03. Data represented as mean +/− SEM.
Figure 4:
Figure 4:. Depletion of TrkB.T1 from VMH astrocytes of adult mice leads to impaired glycemic control and leptin resistance.
a, Glucose tolerance test (GTT) in TrkB.T1 KD (n = 10) and control males (n = 8). Two-way RM ANOVA; Time, p < 0.0001; Genotype, p = 0.0296; Time x Genotype Interaction, p = 0.0796; Subject, p = 0.0002. Bonferroni multiple comparisons, *, p = 0.01. b, Area under the curve for the GTT (Control, n = 8 and TrkB.T1 KD, n = 10). Students unpaired two-sided t-test, *, p = 0.01. c, Quantification of c-fos+ cells within the VMH of fasted (16 hours) TrkB.T1 KD mutant and control animals 60 min. following glucose administration (n = 7). Student’s unpaired two-sided t-test, *, p = 0.0001. d, Representative images of VMH c-fos expression 60 min. following glucose administration in fasted mice. Scale bar is 250 uM. e, Insulin tolerance test (ITT) in TrkB.T1 KD and control males (n = 7). Two-way RM ANOVA; Time, p < 0.0001; Genotype, p = 0.192; Time x Genotype Interaction, p = 0.626; Subject, p = 0.0001. Bonferroni multiple comparisons, NS. f, Area under the curve for the ITT (n = 7). Student’s unpaired two-sided t-test, NS g, Serum levels of insulin of fasted TrkB.T1 KD (n = 7) and control males (n = 8). h, Serum levels of leptin (pg/mL) in fed TrkB.T1 KD (n = 8) and control animals (n = 7). Students unpaired two-sided t-test, *, p = 0.002. i, Percent body weight change after 3 consecutive days of twice daily 3 ug/g leptin administration in TrkB.T1 KD (n = 14) and control males (n = 10). Students unpaired two-sided t-test, *, p = 0.003. j, Percent change in food intake from baseline (3-day vehicle administration) following 3 days of leptin administration (Control n = 6, TrkB.T1 KD n = 9). Student’s unpaired two-sided t-test, *, p = 0.009. k, Quantification of pSTAT3+ cells in TrkB.T1 mutant (n = 7) and control (n = 5) males 5 weeks post-surgery and 45 minutes post 5 ug/g leptin IP administration. Student’s t-test, *, p = 0.0003. h, Representative image of pSTAT3 expression in VMH 45 minutes post 5 ug/g leptin IP administration. Scale bar is 50 uM. Data represented as mean +/− SEM.
Figure 5:
Figure 5:. Depletion of TrkB.T1 from VMH astrocytes of adult mice decreases neuronal activity.
a, Representative traces and b, sEPSC frequency from fed (n = 12 cells) and fasted (n = 15 cells) TrkB.T1 KD and fed (n = 15 cells) and fasted (n = 13 cells) control animals (from 4 – 5 mice per group). Ordinary Two-way ANOVA; Genotype, p = 0.004; Energy Status, p = 0.004; Interaction of Genotype and Energy Status, p = 0.005. Tukey multiple comparisons, *, p = 0.0005; **; p = 0.0008; ***, p = 0.0003 . c, Cumulative distributions of inter-event interval generated from 50 random events per recorded cell for Control fed and fasted (*, p < 0.0001, KS = 0.30, Kolmogorov-Smirnov, two-sided) and TrkB.T1 KD fed and fasted mice (*, p = 0.25, KS = 0.05, Kolmogorov-Smirnov, two-sided). d, sEPSC amplitude (Control Fed n = 15 cells; Control Fasted n = 13 cells; TrkB.T1 KD Fed n = 12 cells; TrkB.T1 KD Fasted n = 15 cells, from 4 – 5 mice per group). Ordinary Two-way ANOVA; *, Genotype, p = 0.0216; Energy Status, p = 0.129; Interaction of Genotype and Energy Status, p = 0.55. e, Representative traces of spike frequency in the absence f, and presence of synaptic blockers. g, Spike frequency (Hz) of VMH neurons from fed control and TrkB.T1 KD males (n = 20 cells, from 5 - 6 mice per group). Students unpaired two-sided t-test, *, p = 0.04. h, Spike frequency of VMH neurons from fed TrkB.T1 KD (n = 18) and control (n = 19) (4 mice per group) males in the presence of synaptic blockers 10 uM SR 95531, 50 uM NBQX and 10 uM CPP. Student’s unpaired two-sided t-test, NS. i, Membrane potential of VMH neurons from fed TrkB.T1 KD (n = 18) and control (n = 19) (4 mice per group) mice in the presence of synaptic blockers. Student’s unpaired two-sided t-test, NS. j, Input-output curves of VMH neurons from fed TrkB.T1 KD (n = 14) and control (n = 15) mice (4 – 6 mice per group). Two-way RM ANOVA: Interaction, p = 0.2; Genotype, p = 0.09. k, Representative traces. l, Representative traces and m, Frequency (Hz) and n, amplitude of sIPSC from fed control and TrkB.T1 KD VMH neurons (n = 20 cells, 4 – 5 mice per group). Student’s unpaired two-sided t-test, NS. Data represented as mean +/− SEM.
Figure 6:
Figure 6:. Specific depletion of TrkB.T1 from VMH astrocytes in adult mice leads to increased glutamate uptake at excitatory synapses.
VMH GLT-1 a, and GLAST b, protein expression in TrkB.T1 KD and control mice 5 weeks post-surgery (n = 7). Students unpaired two-sided t-test, *, p = 0.02. c, Representative western blots of GLT-1 and GLAST expression in the VMH (Data collected from two experiments). d, Effect of DL-TBOA on the NMDAR current decay (Tau weighted, ms) in fed and fasted TrkB.T1 KD and control animals (Control Fed n = 9, Control Fasted n = 7, TrkB.T1 KD Fed n = 7, TrkB.T1 KD Fasted n = 9, 5 – 7 mice per group). Ordinary Two-way ANOVA; Genotype, p = 0.0175; Energy Status p = 0.51; Interaction of Genotype and Energy Status, p = 0.003. Tukey multiple comparisons, *, p = 0.044; **, p = 0.0017. e, Average amplitude-normalized NMDAR responses at baseline (light purple) and following application of 100 uM DL-TBOA (dark purple). f, Percent change in neuronal firing rate (Hz) in response to bath DL-TBOA (100 uM) application (n = 11 cells, 4 - 5 mice, per group). Student’s unpaired two-sided t-test, *, p = 0.03. g, Spike frequency of VMH neurons of fed control and TrkB.T1 KD mice before and after bath application of 100 uM DL-TBOA (n = 11 cells, 4 - 5 mice per group). Two-way ANOVA; Treatment, p = 0.014; Genotype, p = 0.006; Treatment x Genotype Interaction, p = 0.43. Tukey multiple comparisons, *, p = 0.059. h, Representative traces in current clamp showing VMH neuronal firing. Data are represented as mean +/− SEM.
Figure 7:
Figure 7:. Knockdown of TrkB.T1 in VMH astrocytes increases astrocyte invasion of VMH synapses.
a, Representative electron microscopy images showing astrocyte processes (a, green) surrounding VMH synapses in control and TrkB.T1 KD mice 5 weeks post-surgery. Axonal bouton (b), dendritic spine (s), post-synaptic density (arrowhead). Scale bar 250 nm. For all of following panels, analysis was performed in control (n = 198 synapses) and TrkB.T1 KD (n = 166 synapses) animals (n = 4). b, Percentage of synapses contacted by astrocyte processes. Student’s unpaired two-sided t-test, NS. c, Percentage of astrocytes contacting synapses bilaterally. Students unpaired two-sided t-test, p = 0.06. d, Astrocyte process protrusion depth (nm) into synapses. Students unpaired two-sided t-test, *, p = 0.006. e, Cumulative distribution of astrocyte process synaptic protrusion depth (p < 0.0001, KS = 0.2912, Kolmogorov-Smirnov, two-sided). f, Post-synaptic density length (nm). g, Active site length (nm). h, Astrocyte process distance to the post-synaptic density. Students unpaired two-sided t-test, p = 0.19. i, Histogram of astrocyte process distance to post-synaptic density (p = 0.3, KS = 0.1165. Kolmogorov-Smirnov, two-sided). j, Model of how caloric status and BDNF signaling regulate the structural and functional plasticity of VMH astrocytes to regulate neuronal activity and energy and glucose balance. Created with Biorender.com. Data are represented as mean +/− SEM.

Comment in

  • Astroglial clean-up of satiety synapses.
    Gruber T, García-Cáceres C. Gruber T, et al. Nat Metab. 2022 May;4(5):505-506. doi: 10.1038/s42255-022-00563-3. Nat Metab. 2022. PMID: 35501600 No abstract available.

References

    1. Fu LY & van den Pol AN Agouti-related peptide and MC3/4 receptor agonists both inhibit excitatory hypothalamic ventromedial nucleus neurons. J Neurosci 28, 5433–5449, doi:10.1523/JNEUROSCI.0749-08.2008 (2008). - DOI - PMC - PubMed
    1. Huang EJ & Reichardt LF Trk receptors: roles in neuronal signal transduction. Annu Rev Biochem 72, 609–642, doi:10.1146/annurev.biochem.72.121801.161629 (2003). - DOI - PubMed
    1. Tran PV et al. Diminished hypothalamic bdnf expression and impaired VMH function are associated with reduced SF-1 gene dosage. J Comp Neurol 498, 637–648, doi:10.1002/cne.21070 (2006). - DOI - PubMed
    1. Unger TJ, Calderon GA, Bradley LC, Sena-Esteves M & Rios M Selective deletion of Bdnf in the ventromedial and dorsomedial hypothalamus of adult mice results in hyperphagic behavior and obesity. J Neurosci 27, 14265–14274, doi:10.1523/JNEUROSCI.3308-07.2007 (2007). - DOI - PMC - PubMed
    1. Rios M et al. Conditional deletion of brain-derived neurotrophic factor in the postnatal brain leads to obesity and hyperactivity. Mol Endocrinol 15, 1748–1757, doi:10.1210/mend.15.10.0706 (2001). - DOI - PubMed

Publication types