

Soluble RAGE attenuates myocardial I/R injuries via FoxO3-Bnip3 pathway
- PMID: 35501612
- PMCID: PMC11072718
- DOI: 10.1007/s00018-022-04307-0
Soluble RAGE attenuates myocardial I/R injuries via FoxO3-Bnip3 pathway
Abstract
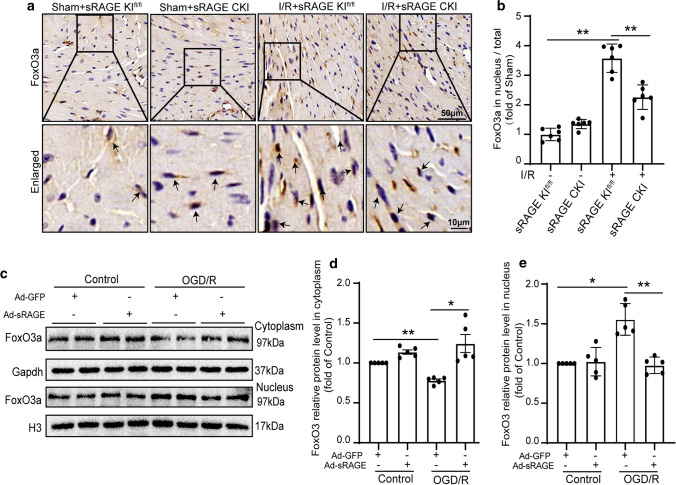
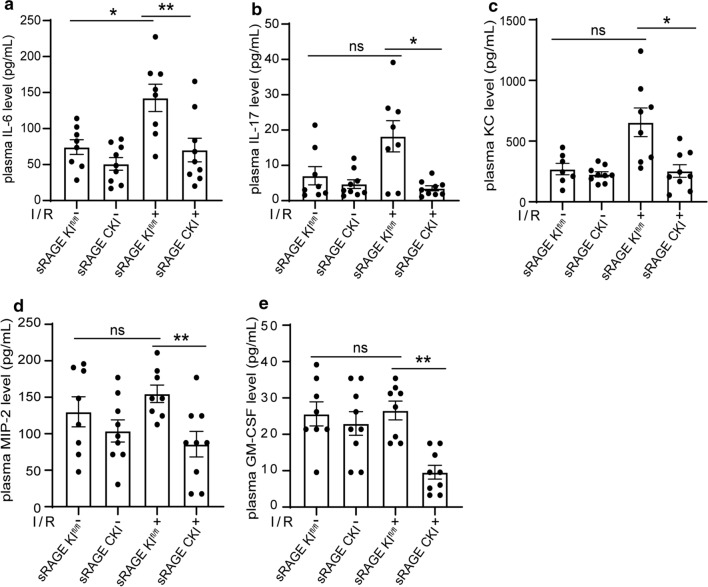
Soluble receptor for advanced glycation end-products (sRAGE) was reported to inhibit cardiac apoptosis through the mitochondrial pathway during myocardial ischemia/reperfusion (I/R) injury. Meanwhile, the proapoptotic protein Bcl2 and adenovirus E1B 19-kDa-interacting protein 3 (Bnip3) was reported to mediate mitochondrial depolarization and be activated by the Forkhead box protein O3 (FoxO3a). Therefore, it is supposed that FoxO3a-Bnip3 pathway might be involved in the inhibiting effects of sRAGE on mitochondrial apoptosis during I/R. I/R surgery or glucose deprivation/reoxygenation was adopted to explore mitochondrial depolarization, apoptosis and related signaling pathways in mice hearts and cultured cardiomyocytes. The results showed that overexpression of sRAGE in cardiomyocytes dramatically improved cardiac function and reduced infarct areas in I/R treated mice. sRAGE inhibited mitochondrial depolarization and cardiac apoptosis during I/R, which correlated with reduced expression of Bnip3, Sirt2, phosphorylation of Akt and FoxO3a which translocated into nucleus in cultured cardiomyocytes. Either Sirt2 or FoxO3a silencing enhanced the inhibiting effects of sRAGE on mitochondrial depolarization induced by I/R in cultured cardiomyocytes. Meanwhile, overexpression or silencing of FoxO3a affected the inhibiting effects of sRAGE on Bnip3 and cleaved caspase-3 in cultured cardiomyocytes. Therefore, it is suggested that sRAGE inhibited I/R injuries via reducing mitochondrial apoptosis through the FoxO3a-Bnip3 pathway.
Keywords: Inflammatory cytokines; Mitochondrial damages; Myocardium; Sirtuins.
© 2022. The Author(s), under exclusive licence to Springer Nature Switzerland AG.
Conflict of interest statement
The authors declared no conflict of interest.
Figures


Similar articles
-
Integrinβ3 mediates the protective effects of soluble receptor for advanced glycation end-products during myocardial ischemia/reperfusion through AKT/STAT3 signaling pathway.Apoptosis. 2022 Jun;27(5-6):354-367. doi: 10.1007/s10495-022-01724-1. Epub 2022 Mar 31. Apoptosis. 2022. PMID: 35359221
-
A soluble receptor for advanced glycation end-products inhibits hypoxia/reoxygenation-induced apoptosis in rat cardiomyocytes via the mitochondrial pathway.Int J Mol Sci. 2012;13(9):11923-11940. doi: 10.3390/ijms130911923. Epub 2012 Sep 20. Int J Mol Sci. 2012. PMID: 23109892 Free PMC article.
-
Soluble receptor for advance glycation end-products inhibits ischemia/reperfusion-induced myocardial autophagy via the STAT3 pathway.Free Radic Biol Med. 2019 Jan;130:107-119. doi: 10.1016/j.freeradbiomed.2018.10.437. Epub 2018 Oct 25. Free Radic Biol Med. 2019. PMID: 30367996
-
FOXO3a regulates BNIP3 and modulates mitochondrial calcium, dynamics, and function in cardiac stress.Am J Physiol Heart Circ Physiol. 2016 Dec 1;311(6):H1540-H1559. doi: 10.1152/ajpheart.00549.2016. Epub 2016 Sep 30. Am J Physiol Heart Circ Physiol. 2016. PMID: 27694219 Free PMC article.
-
Mitochondrial pruning by Nix and BNip3: an essential function for cardiac-expressed death factors.J Cardiovasc Transl Res. 2010 Aug;3(4):374-83. doi: 10.1007/s12265-010-9174-x. Epub 2010 Mar 16. J Cardiovasc Transl Res. 2010. PMID: 20559783 Free PMC article. Review.
Cited by
-
Different types of cell death and their interactions in myocardial ischemia-reperfusion injury.Cell Death Discov. 2025 Mar 5;11(1):87. doi: 10.1038/s41420-025-02372-5. Cell Death Discov. 2025. PMID: 40044643 Free PMC article. Review.
-
Accelerated AGEing: The Impact of Advanced Glycation End Products on the Prognosis of Chronic Kidney Disease.Antioxidants (Basel). 2023 Feb 26;12(3):584. doi: 10.3390/antiox12030584. Antioxidants (Basel). 2023. PMID: 36978832 Free PMC article. Review.
-
RAGE Inhibitors in Neurodegenerative Diseases.Biomedicines. 2023 Apr 9;11(4):1131. doi: 10.3390/biomedicines11041131. Biomedicines. 2023. PMID: 37189749 Free PMC article. Review.
-
Bioinformatics integration reveals key genes associated with mitophagy in myocardial ischemia-reperfusion injury.BMC Cardiovasc Disord. 2024 Mar 27;24(1):183. doi: 10.1186/s12872-024-03834-x. BMC Cardiovasc Disord. 2024. PMID: 38539069 Free PMC article.
-
Identification of immune-related genes in acute myocardial infarction based on integrated bioinformatical methods and experimental verification.PeerJ. 2023 May 16;11:e15058. doi: 10.7717/peerj.15058. eCollection 2023. PeerJ. 2023. PMID: 37214088 Free PMC article.
References
-
- Roth GA, Johnson C, Abajobir A, Abd-Allah F, Abera SF, Abyu G, Ahmed M, Aksut B, Alam T, Alam K, Alla F, Alvis-Guzman N, Amrock S, Ansari H, Arnlov J, Asayesh H, Atey TM, AvilaBurgos L, Awasthi A, Banerjee A, Barac A, Barnighausen T, Barregard L, Bedi N, Belay Ketema E, Bennett D, Berhe G, Bhutta Z, Bitew S, Carapetis J, Carrero JJ, Malta DC, Castaneda-Orjuela CA, Castillo-Rivas J, Catala-Lopez F, Choi JY, Christensen H, Cirillo M, Cooper L, Jr, Criqui M, Cundif D, Damasceno A, Dandona L, Dandona R, Davletov K, Dharmaratne S, Dorairaj P, Dubey M, Ehrenkranz R, El Sayed ZM, Faraon EJA, Esteghamati A, Farid T, Farvid M, Feigin V, Ding EL, Fowkes G, Gebrehiwot T, Gillum R, Gold A, Gona P, Gupta R, Habtewold TD, Hafezi Nejad N, Hailu T, Hailu GB, Hankey G, Hassen HY, Abate KH, Havmoeller R, Hay SI, Horino M, Hotez PJ, Jacobsen K, James S, Javanbakht M, Jeemon P, John D, Jonas J, Kalkonde Y, Karimkhani C, Kasaeian A, Khader Y, Khan A, Khang YH, Khera S, Khoja AT, Khubchandani J, Kim D, Kolte D, Kosen S, Krohn KJ, Kumar GA, Kwan GF, Lal DK, Larsson A, Linn S, Lopez A, Lotufo PA, El Razek HMA, et al. Global, regional, and national burden of cardiovascular diseases for 10 causes, 1990 to 2015. J Am Coll Cardiol. 2017;70:1–25. doi: 10.1016/j.jacc.2017.04.052. - DOI - PMC - PubMed
-
- Egaña-Gorroño L, López-Díez R, Yepuri G, Ramirez LS, Reverdatto S, Gugger PF, Shekhtman A, Ramasamy R, Schmidt AM. Receptor for advanced glycation end products (RAGE) and mechanisms and therapeutic opportunities in diabetes and cardiovascular disease: insights from human subjects and animal models. Front Cardiovasc Med. 2020;7:37. doi: 10.3389/fcvm.2020.00037. - DOI - PMC - PubMed
MeSH terms
Substances
Grants and funding
LinkOut - more resources
Full Text Sources
Research Materials
